Cadmium Pigments Market Size 2024-2028
The cadmium pigments market size is forecast to increase by USD 66.6 billion at a CAGR of 4.3% between 2023 and 2028.
- The market is experiencing significant growth due to the increasing demand from various industries, particularly in the plastic, ceramic, and glass sectors. The superior thermal and alkali resistance properties of cadmium pigments make them ideal for high-performance coloring applications at high temperatures. Two primary types of cadmium pigments, cadmium yellows, and cadmium reds, are widely used for their vibrant hues and long-lasting color stability. However, concerns regarding the health hazards associated with cadmium pigments may pose a challenge to market growth. To mitigate these concerns, manufacturers are focusing on developing alternative pigments with similar properties and exploring advanced production techniques to minimize the use of cadmium. Overall, the market is expected to continue its expansion, driven by the increasing demand for high-quality, long-lasting pigments in various industries.
What will be the Size of the Market During the Forecast Period?
- Cadmium pigments are a type of inorganic coloring agents widely used in various industries, including plastics, ceramics, industrial paints, and coatings, glass, rubber, and construction. These pigments offer desirable properties such as thermal resistance, alkali resistance, and high-performance coloring capabilities. They are available in various shades, including cadmium yellows, cadmium reds, and cadmium oranges. These pigments are known for their ability to provide vibrant and long-lasting colors. In the plastics industry, they are used to enhance the color and durability of products. In ceramics, they are utilized to create a wide range of shades and hues. In industrial paints and coatings, they offer excellent resistance to weathering and corrosion. The use of cadmium pigments in glass production dates back to the early 19th century. They are added to glass to improve its color and opacity. In the rubber industry, they are used to produce a range of colors, including red, yellow, and orange. In construction, they are used in the production of concrete and masonry products to provide color and durability. Despite their benefits, the use of these has raised health concerns due to the potential hazards associated with cadmium..
- Exposure to cadmium can lead to health problems, including kidney damage and respiratory issues. As a result, there have been efforts to develop alternative pigments that offer similar properties but with reduced health risks. The production of these involves several processes, including the striking process, pigment drying, milling and blending, and wastewater pretreatment. These processes require careful handling and adherence to safety protocols to minimize the risk of cadmium exposure. The market is an essential component of various industries, offering desirable properties for the production of high-performance products. However, the potential health risks associated with cadmium have led to efforts to develop alternative pigments. Producers must ensure strict adherence to safety protocols during the production process to minimize the risk of cadmium exposure.
How is this market segmented and which is the largest segment?
The market research report provides comprehensive data (region-wise segment analysis), with forecasts and estimates in "USD million" for the period 2024-2028, as well as historical data from 2018-2022 for the following segments.
- Application
- Paints and coatings
- Plastics
- Printing inks
- Construction materials
- Others
- Geography
- APAC
- China
- India
- Japan
- North America
- Canada
- US
- Europe
- Germany
- UK
- France
- South America
- Brazil
- Middle East and Africa
- APAC
By Application Insights
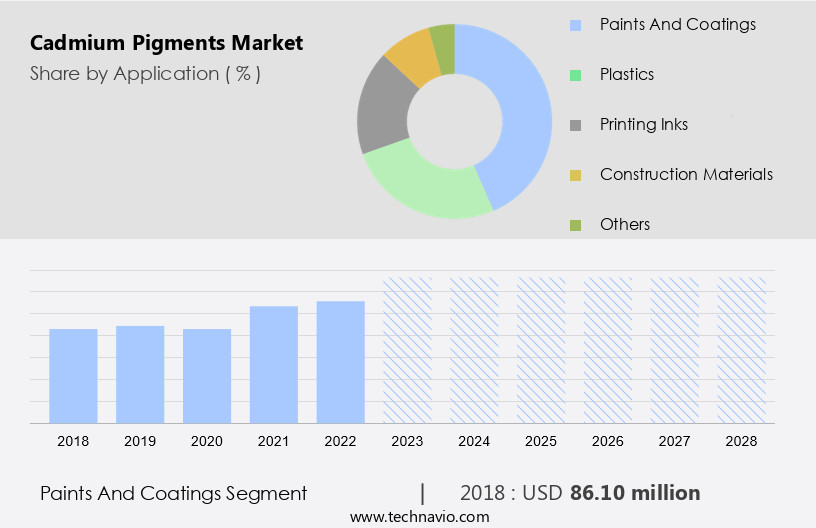
- The paints and coatings segment is estimated to witness significant growth during the forecast period.
Cadmium pigment coatings offer superior protection for various substrates, including iron, steel, brass, and aluminum, in diverse industrial applications. These coatings exhibit excellent thermal and alkali resistance, making them ideal for high-performance coloring in extreme conditions. In marine and alkaline environments, they provide reliable corrosion resistance. Cadmium, similar to zinc, acts as a protective layer that prevents the underlying substrate, such as steel, from being corroded when the coating is damaged. The coating's low coefficient of friction ensures smooth operation and predictable torque characteristics, while its high electrical conductivity enables efficient power transfer. Additionally, cadmium coatings offer protection against galvanic corrosion and facilitate easy soldering.
Furthermore, they generate minimal corrosion products, reducing the risk of machinery being jammed by debris. Cadmium yellows and cadmium reds are widely used in coatings due to their high-temperature stability and vibrant colors. These pigments contribute to the production of coatings with exceptional durability and resistance to various environmental factors.

Get a glance at the market report of share of various segments Request Free Sample
The paints and coatings segment was valued at USD 86.10 million in 2018 and showed a gradual increase during the forecast period.
Regional Analysis
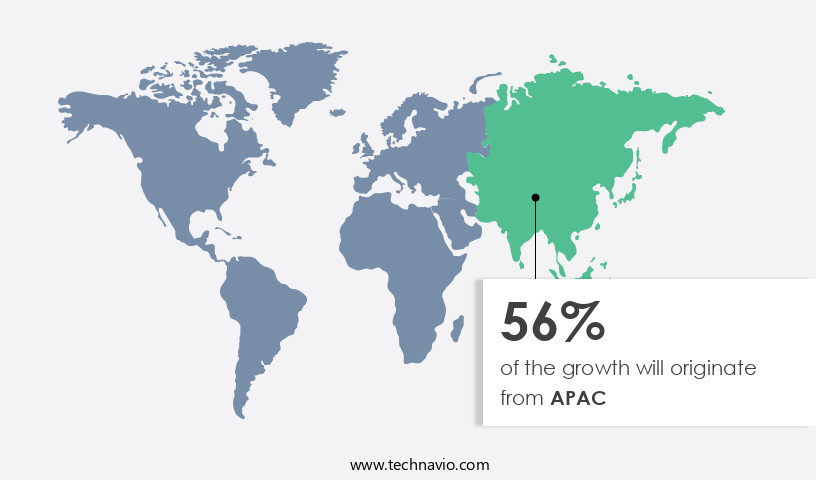
- APAC is estimated to contribute 56% to the growth of the global market during the forecast period.
Technavio's analysts have elaborately explained the regional trends and drivers that shape the market during the forecast period.
For more insights on the market share of various regions Request Free Sample
The market is primarily driven by their application in the paper and ink industries, as well as in complex polymers. In particular, the highly developed painting and coatings industries in countries like China, India, and Japan in the Asia Pacific region are expected to dominate the market. The demand for high-temperature-resistant polymers is increasing in emerging nations, and cadmium pigments are being used in these polymers due to their ability to maintain their brightness even after prolonged exposure to sunlight. This property is particularly useful in tinting plastics, such as those used for infectious hospital waste bags and for protecting PVC cladding on wires and cables from heat and light. Cadmium pigments are used in various polymers including high-density polyethylene, silicone resins, nylon, acrylonitrile butadiene styrene (ABS), polycarbonates, and other thermoplastic polymers. The opacity of cadmium pigments is also valuable for enhancing the color of these polymers.
Market Dynamics
Our researchers analyzed the data with 2023 as the base year, along with the key drivers, trends, and challenges. A holistic analysis of drivers will help companies refine their marketing strategies to gain a competitive advantage.
What are the key market drivers leading to the rise in adoption of Cadmium Pigments Market?
The exponential growth of plastic industry is the key driver of the market.
- Cadmium pigments play a significant role in various industries, particularly in the production of plastics and batteries. Their insoluble and alkali-resistant properties contribute to the longevity of plastics and make them the second most widely used pigments in batteries. In addition, they enhance the corrosion resistance of metals such as iron, steel, aluminum, and titanium due to their unique chemical properties. The growing demand in coatings, stabilizers, advanced alloys, and electronic compounds is expected to fuel market growth throughout the forecast period.
- Industrial polymers containing cadmium pigments are utilized in various applications, including power lines, gas pipes and fittings, beer crates, and motor vehicle heating fans. The use of cadmium pigments in these industries underscores their importance and highlights their potential to drive market expansion. Thus, such factors are driving the growth of the market during the forecast period.
What are the market trends shaping the Cadmium Pigments Market?
Increased adoption in ceramic and glass industry is the upcoming trend in the market.
- Cadmium pigments are inorganic coloring agents widely used in various industries, including plastics, ceramics, and industrial paints. These pigments exhibit desirable properties such as high tinting strength, thermal and chemical stability, and a high refractive index. In the ceramics industry, cadmium pigments are utilized to create vibrant yellows, oranges, and reds that can withstand the high temperatures required during the firing process. These pigments are essential for producing ornamental ceramic, glass, and enamel goods.
- In applications such as on-glaze colors, porcelain enamels for steel, and glass colors for tumblers and bottles, they are encapsulated in the glass matrix to ensure color stability and brilliance. Despite their advantages, the use of cadmium pigments has raised health concerns due to their toxicity. Therefore, their application is subject to stringent regulations to minimize potential risks. Thus, such trends will shape the growth of the market during the forecast period.
What challenges does Cadmium Pigments Market face during the growth?
Health-related issues with cadmium pigments is a key challenge affecting the market growth.
- Cadmium pigments have limited application due to health and environmental concerns. Exposure to these pigments can lead to health issues, particularly affecting the kidneys and lungs. As non-essential elements for humans, proper disposal is crucial to prevent cadmium from entering the food chain through soil or water contamination. The European Union banned the use of cadmium pigments in plastics in 2011, restricting their market growth in Europe. The environmental challenges associated with cadmium pigments have led governments to discourage their widespread use.
- In the US and North America, the demand for cadmium pigments is growing in specific industries such as construction, specialty coatings, and high-performance plastics. Orange cadmium pigments find extensive use in optical wavelength services, particularly in the production of vibrant and durable coatings. Hence, the above factors will impede the growth of the market during the forecast period.
Exclusive Customer Landscape
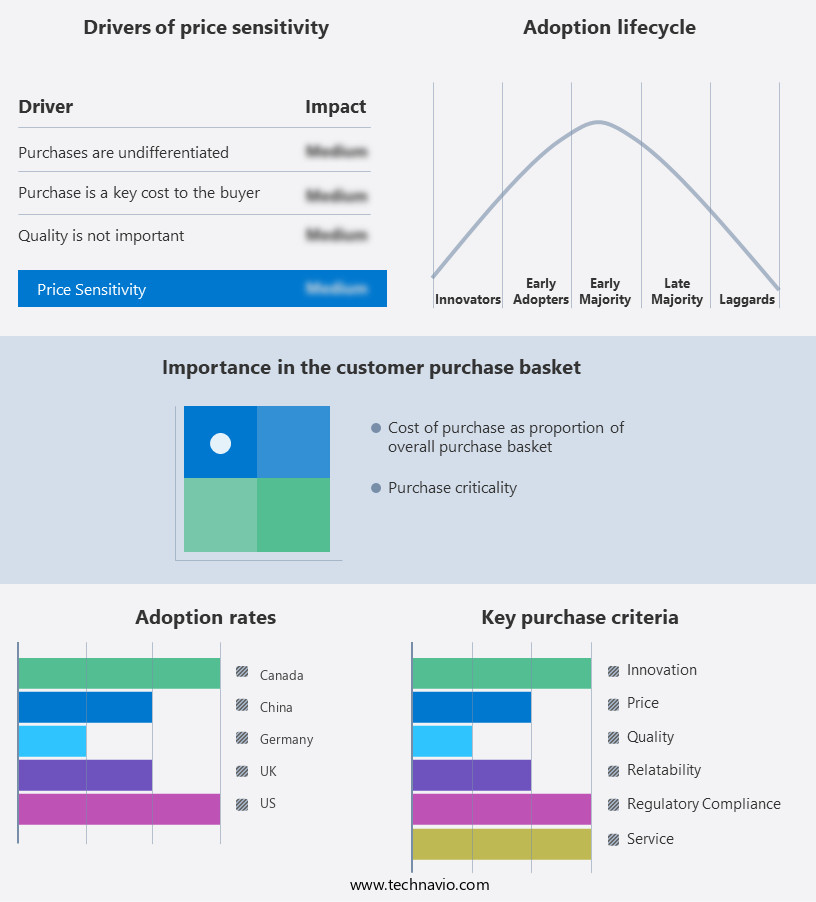
The market forecasting report includes the adoption lifecycle of the market, covering from the innovator's stage to the laggard's stage. It focuses on adoption rates in different regions based on penetration. Furthermore, the market report also includes key purchase criteria and drivers of price sensitivity to help companies evaluate and develop their market growth analysis strategies.
Customer Landscape
Key Companies & Market Insights
Companies are implementing various strategies, such as strategic alliances, market forecast, partnerships, mergers and acquisitions, geographical expansion, and product/service launches, to enhance their presence in the market. The market research and growth report includes detailed analyses of the competitive landscape of the market and information about key companies, including:
- BAJAJ COLOURS AND CHEMICALS
- Chemonova
- Fulln Glaze Co. Ltd.
- HANGZHOU EMPEROR CHEMICAL CO. LTD.
- Hunan Jufa Technology Co. Ltd.
- Hunan Noli Enamel Co. Ltd.
- Huntsman Corp.
- HUPC Chemical Co. Ltd.
- James M. Brown Ltd.
- Kremer Pigments GmbH and Co. KG
- Lanxess AG
- PROQUIMAC PFC SA
- Sudarshan Chemical Industries Ltd.
Qualitative and quantitative analysis of companies has been conducted to help clients understand the wider business environment as well as the strengths and weaknesses of key market players. Data is qualitatively analyzed to categorize companies as pure play, category-focused, industry-focused, and diversified; it is quantitatively analyzed to categorize companies as dominant, leading, strong, tentative, and weak.
Research Analyst Overview
Cadmium pigments are inorganic coloring agents widely used in various industries due to their high thermal and alkali resistance. These pigments offer high-performance coloring shades for plastics, ceramics, industrial paints, and coatings. Despite their benefits, the use of these has raised health concerns due to their toxic nature. Cadmium yellows and cadmium reds are popular cadmium pigments used in the painting and coatings industry for producing vibrant and durable colors. These pigments are suitable for high-temperature resistance plastics, complex polymers, enamels, rubber, paper, ink industries, and glass. The production process of cadmium pigments involves striking the cadmium metal to initiate the cadmium attack process, followed by milling and blending to produce the desired pigment size and shape.
Furthermore, the wastewater generated during this process requires pretreatment to prevent environmental contamination. They offer excellent chemical stability and weather fastness, making them ideal for specialty coatings and high-performance plastics. The use of cadmium orange pigments in the optical wavelength service industry has gained popularity due to their high lightfastness and ability to produce striking colors.
|
Market Scope |
|
|
Report Coverage |
Details |
|
Page number |
169 |
|
Base year |
2023 |
|
Historic period |
2018-2022 |
|
Forecast period |
2024-2028 |
|
Growth momentum & CAGR |
Accelerate at a CAGR of 4.3% |
|
Market Growth 2024-2028 |
USD 66.6 million |
|
Market structure |
Concentrated |
|
YoY growth 2023-2024(%) |
4.1 |
|
Key countries |
China, US, Canada, UK, Germany, Japan, France, India, Brazil, and Saudi Arabia |
|
Competitive landscape |
Leading Companies, Market Positioning of Companies, Competitive Strategies, and Industry Risks |
What are the Key Data Covered in this Market Research and Growth Report?
- CAGR of the market during the forecast period
- Detailed information on factors that will drive the market growth and forecasting between 2024 and 2028
- Precise estimation of the size of the market and its contribution of the market in focus to the parent market
- Accurate predictions about upcoming market growth and trends and changes in consumer behaviour
- Growth of the market across APAC, North America, Europe, South America, and Middle East and Africa
- Thorough analysis of the market's competitive landscape and detailed information about companies
- Comprehensive analysis of factors that will challenge the growth of market companies
We can help! Our analysts can customize this market research report to meet your requirements. Get in touch


