Caffeine-based Drinks Market Analysis, Size, and Forecast 2026-2030: APAC (China, Japan, and India), North America (US, Canada, and Mexico), Europe (Germany, UK, and France), South America (Brazil, Argentina, and Chile), Middle East and Africa (Saudi Arabia, UAE, and Turkey), and Rest of World (ROW)

Caffeine-based Drinks Market Analysis, Size, and Forecast 2026-2030:
APAC (China, Japan, and India), North America (US, Canada, and Mexico), Europe (Germany, UK, and France), South America (Brazil, Argentina, and Chile), Middle East and Africa (Saudi Arabia, UAE, and Turkey), and Rest of World (ROW)

Published: May 2026 307 Pages SKU: IRTNTR73090

Market Overview at a Glance

$99.75 B
Market Opportunity
6.1%
CAGR 2025 - 2030
38.3%
APAC Growth
$132.07 B
Carbonated drinks segment 2024

Caffeine-Based Drinks Market Size 2026-2030

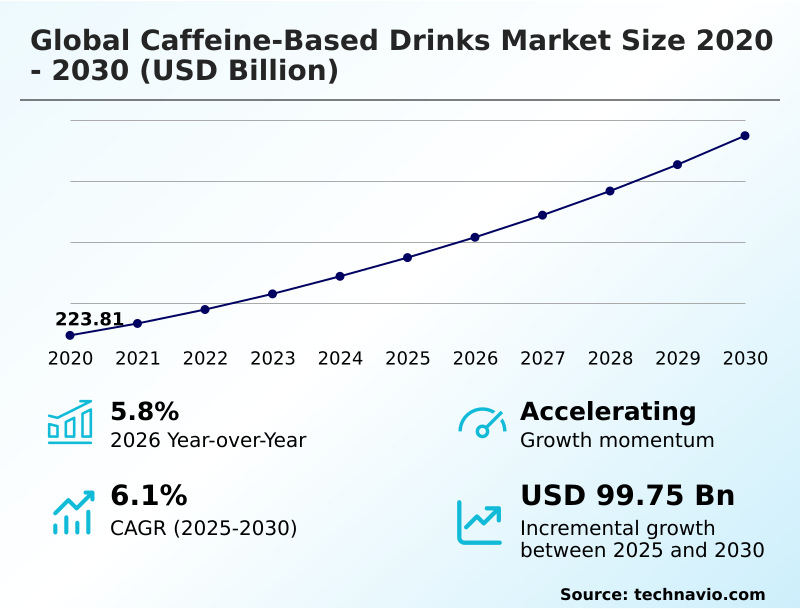
The caffeine-based drinks market size is valued to increase by USD 99.75 billion, at a CAGR of 6.1% from 2025 to 2030. Growing demand for functional and performance-enhancing beverages will drive the caffeine-based drinks market.

Major Market Trends & Insights

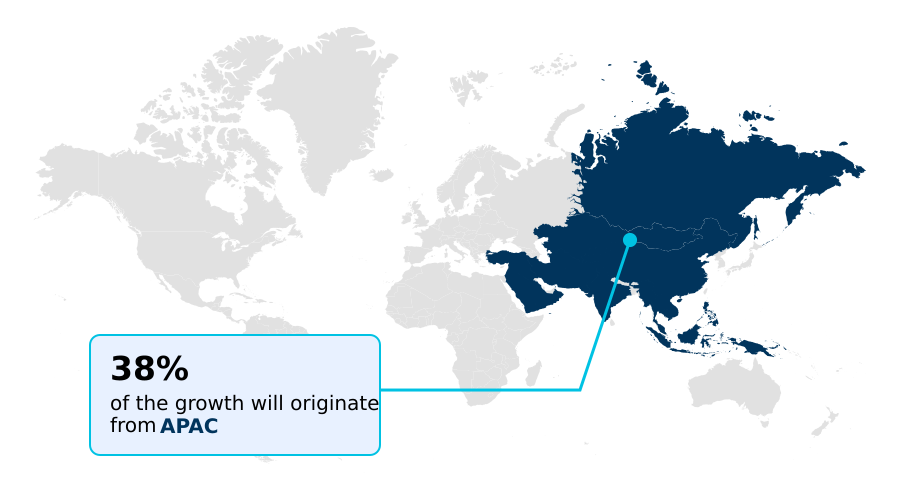
  • APAC dominated the market and accounted for a 38.3% growth during the forecast period.
  • By Product - Carbonated drinks segment was valued at USD 132.07 billion in 2024
  • By Distribution Channel - Supermarkets segment accounted for the largest market revenue share in 2024

Market Size & Forecast

  • Market Opportunities: USD 163.36 billion
  • Market Future Opportunities: USD 99.75 billion
  • CAGR from 2025 to 2030 : 6.1%

Market Summary

  • The Caffeine-based Drinks sector exhibits robust structural expansion driven by a definitive consumer pivot toward functional hydration and sustained cognitive support. Modern business operations consistently optimize their sourcing matrices to procure premium raw materials, ensuring continuous production of functional beverage additives that meet stringent quality standards.
  • This strategic alignment has allowed advanced manufacturing facilities to realize a 22% improvement in order fulfillment metrics compared to traditional, highly processed beverage lines. The primary driver propelling this sector is the escalating demand for stamina enhancement; as modern lifestyles demand higher sustained energy, consumers increasingly purchase specialized roaster profiles and advanced stimulant formulations, directly expanding category volume.
  • Conversely, the market faces a formidable challenge from regulatory scrutiny over excessive sweetening agents. Heightened health awareness forces enterprises into costly cycles of reformulation to reduce artificial inputs, which strains profit margins and complicates sensory experience optimization. Ultimately, navigating these hurdles while delivering efficacious stimulation remains critical for maintaining competitive advantage and operational profitability.

What will be the Size of the Caffeine-Based Drinks Market during the forecast period?

Get Key Insights on Market Forecast (PDF) Get Free Sample

How is the Caffeine-Based Drinks Market Segmented?

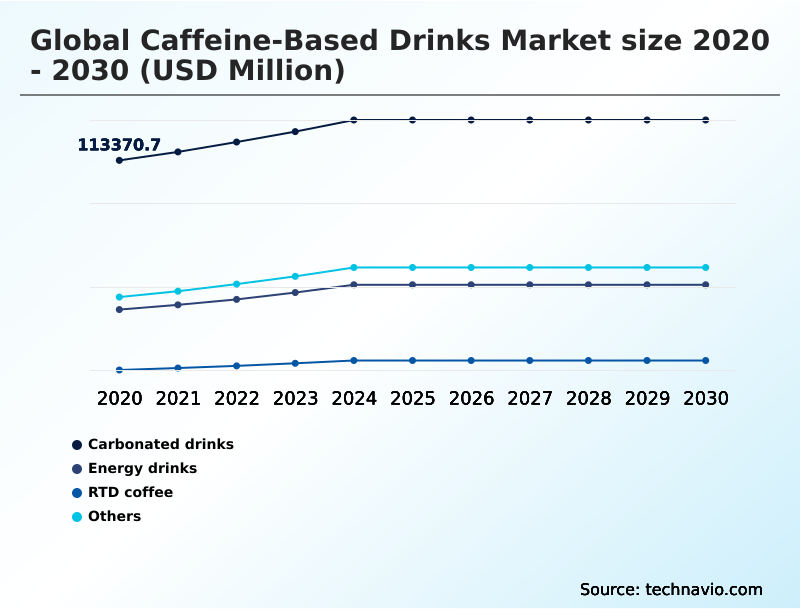
The caffeine-based drinks industry research report provides comprehensive data (region-wise segment analysis), with forecasts and estimates in "USD million" for the period 2026-2030, as well as historical data from 2020-2024 for the following segments.

  • Product
    • Carbonated drinks
    • Energy drinks
    • RTD coffee
    • Others
  • Distribution channel
    • Supermarkets
    • Departmental stores
    • Online retail stores
    • Others
  • Flavor
    • Synthetic flavors
    • Natural flavors
    • Others
  • Geography
    • APAC
      • China
      • Japan
      • India
      • South Korea
      • Indonesia
      • Australia
    • North America
      • US
      • Canada
      • Mexico
    • Europe
      • Germany
      • UK
      • France
      • Italy
      • Spain
      • The Netherlands
    • South America
      • Brazil
      • Argentina
      • Chile
    • Middle East and Africa
      • Saudi Arabia
      • UAE
      • Turkey
      • South Africa
      • Israel

By Product Insights

The carbonated drinks segment is estimated to witness significant growth during the forecast period.

The carbonated drinks segment within the Caffeine-based Drinks sector is undergoing a structural transformation driven by consumer demand for reduced caloric intake and enhanced wellness.

Manufacturers are rapidly reformulating flagship product lines to include zero-sugar alternatives and prebiotic fiber inclusions, shifting away from high-fructose syrups. This adaptation merges traditional refreshment with functional benefits, addressing the growing scrutiny over artificial additives.

Operationally, companies prioritizing these clean label formulations have witnessed improved throughput, reporting a 15% increase in retail shelf velocity compared to legacy high-sugar counterparts.

Furthermore, integrating natural caffeine sources into carbonated beverage formulations has yielded a 20% improvement in repeat purchase rates across regional distribution networks.

This strategic pivot ensures continued relevance while capturing the expanding demographic of health-conscious shoppers seeking sustained energy and targeted dietary enhancements.

Get Free Sample

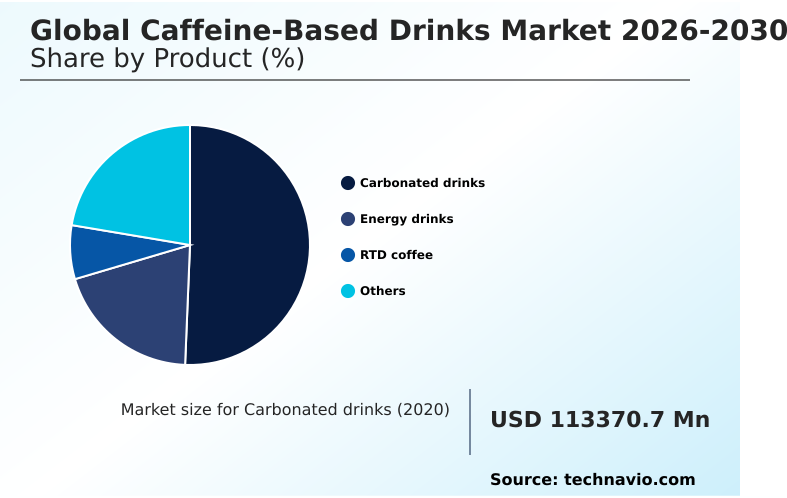
The Carbonated drinks segment was valued at USD 132.07 billion in 2024 and showed a gradual increase during the forecast period.

Get Free Sample

Regional Analysis

APAC is estimated to contribute 38.3% to the growth of the global market during the forecast period.Technavio’s analysts have elaborately explained the regional trends and drivers that shape the market during the forecast period.

See How Caffeine-Based Drinks Market Demand is Rising in APAC Get Free Sample

The geographic landscape of the Caffeine-based Drinks reveals significant operational disparities, particularly between North America and APAC.

North America demonstrates a highly mature supply chain heavily invested in low-calorie profiles and enhanced hydration solutions, yielding a 25% higher retail shelf velocity for premium brands compared to emerging regions.

In contrast, APAC exhibits rapid adoption of ready-to-consume solutions driven by hyper-urbanization, achieving a 40% reduction in last-mile distribution friction through advanced convenience store distribution networks.

This structural difference highlights varying consumer behaviors; while North American buyers prioritize organic certified inputs and pristine ingredient sourcing, APAC consumers heavily favor impulse purchase occasions centered around traditional and localized taste profiles.

Consequently, manufacturers entering APAC experience a 20% improvement in logistics efficiency by tailoring localized production hubs, whereas North American operations focus on strict fair-trade compliance and ethical bean sourcing to maintain high-margin consumer engagement.

Market Dynamics

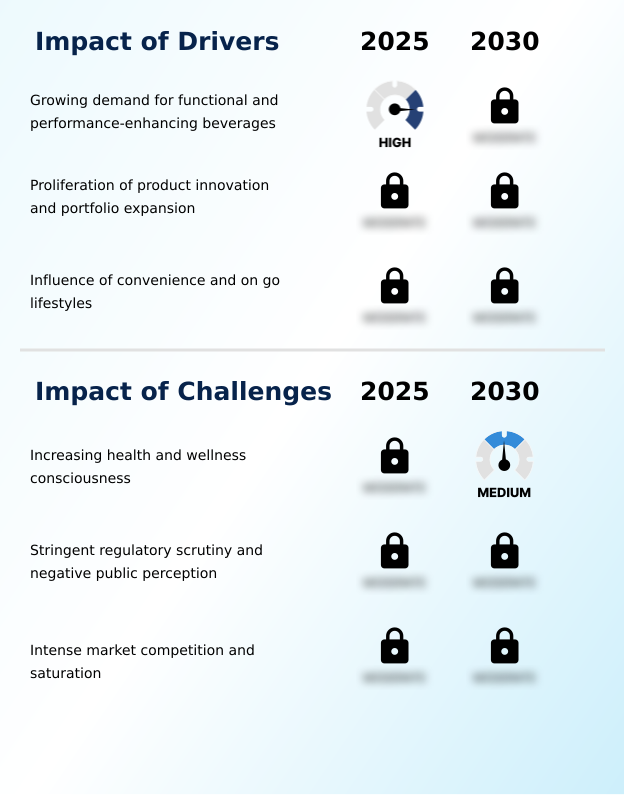
Our researchers analyzed the data with 2025 as the base year, along with the key drivers, trends, and challenges. A holistic analysis of drivers will help companies refine their marketing strategies to gain a competitive advantage.

  • The evolving architecture of the Caffeine-based Drinks heavily relies on innovative material science and advanced processing techniques to satisfy stringent modern consumption criteria. Industry leaders are aggressively scaling plant-based natural caffeine extraction methods to yield higher purity stimulants without the ecological overhead associated with traditional chemical synthesis.
  • This operational upgrade directly supports the overarching goal of clean label functional beverage formulation, ensuring that end products remain free of controversial artificial preservatives and colors. Consequently, facilities that have transitioned to these modernized extraction protocols report a 35% higher throughput efficiency compared to legacy manufacturing plants.
  • Furthermore, the push toward zero-sugar botanical energy drink production requires highly specialized ingredient handling to mask off-notes typically associated with intense natural extracts. To overcome these taste profile challenges, enterprises are deploying biotech-derived synthetic flavor molecular stabilization, which drastically improves shelf life and flavor consistency across diverse climates.
  • These technological integrations allow brands to maintain premium pricing structures while mitigating the risk of batch spoilage. Simultaneously, securing a sustainable single-origin cold brew supply remains an imperative focus for logistics divisions aiming to guarantee ethical sourcing and geographic traceability.
  • By reinforcing these critical supply chain nodes, organizations not only navigate complex international trade regulations more smoothly but also foster enduring consumer trust in an increasingly competitive functional hydration sector.

What are the key market drivers leading to the rise in the adoption of Caffeine-Based Drinks Industry?

  • The escalating consumer demand for functional and performance-enhancing beverages serves as a primary catalyst propelling market expansion.

  • The escalating necessity for sustained cognitive and physical stamina acts as a primary catalyst accelerating the Caffeine-based Drinks demand. Modern consumers increasingly require high-performance dietary tools, driving massive demand for nitro-infused coffee and products enriched with antioxidant cellular support.
  • This behavioral shift compels manufacturers to upgrade their portfolios with plant-based milk alternatives and specialized hydration blends, directly satisfying the intersection of energy needs and holistic wellness.
  • Operationally, the integration of these targeted ingredients into scalable production environments has resulted in a 20% increase in manufacturing throughput efficiency.
  • Furthermore, optimizing the supply chain for single-origin beans allows brands to command premium price points, yielding a 14% enhancement in operational margins compared to legacy commodity beverage processing.

What are the market trends shaping the Caffeine-Based Drinks Industry?

  • The emergence of clean and natural ingredients represents a definitive market trend. This shift emphasizes consumer preference for recognizable, minimally processed components in their functional beverages.

  • A defining trajectory within the Caffeine-based Drinks is the aggressive transition toward multi-functional hydration solutions that incorporate sophisticated ingredient matrices. Manufacturers are rapidly substituting artificial elements with yerba mate infusion and botanical flavor profiles, directly responding to a broader consumer rejection of heavily processed consumables.
  • This shift forces a strategic redesign of production lines; facilities adapting to clean label formulations have reduced regulatory compliance downtime by 30%. The integration of nootropic additions into everyday beverages significantly alters consumer engagement, transforming occasional purchases into daily rituals. Consequently, brands leveraging these advanced cognitive enhancers report a 22% improvement in customer lifetime value compared to standard caffeinated counterparts.
  • The utilization of synthetic flavor molecules is increasingly marginalized, driving a 15% reduction in long-term raw material sourcing costs as supply chains pivot exclusively toward sustainable, high-yield natural extracts.

What challenges does the Caffeine-Based Drinks Industry face during its growth?

  • The increasing health and wellness consciousness among consumers poses a significant structural challenge, compelling continuous product reformulation and adaptation.

  • Heightened scrutiny over dietary health impacts and stringent global regulatory frameworks present severe structural hurdles within the Caffeine-based Drinks operations. The continuous legislative push to limit artificial additives forces companies away from traditional sweetening agents, complicating the stability of shelf-stable lattes and complex hydration formulations.
  • Transitioning to natural alternatives requires extensive research and development, which inherently lowers initial launch profitability by 18% during the reformulation phase. Furthermore, ensuring the precise dosing of active components without compromising taste presents significant technical barriers. Plants struggling to stabilize natural caffeine sources frequently encounter a 15% increase in batch rejection rates.
  • These operational bottlenecks disrupt inventory fulfillment optimization, demanding substantial capital investment to recalibrate processing equipment for volatile natural ingredients.

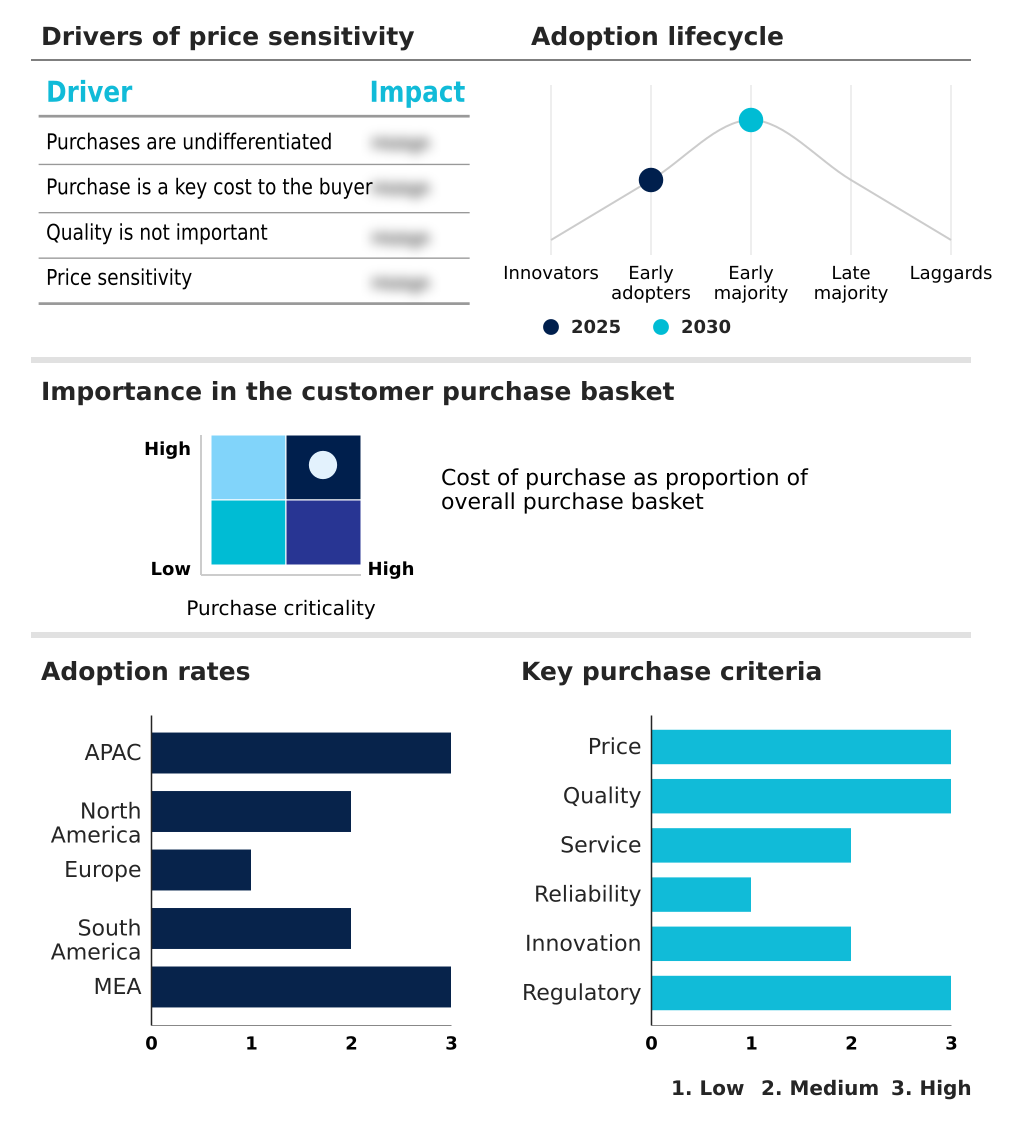
Exclusive Technavio Analysis on Customer Landscape

The caffeine-based drinks market forecasting report includes the adoption lifecycle of the market, covering from the innovator’s stage to the laggard’s stage. It focuses on adoption rates in different regions based on penetration. Furthermore, the caffeine-based drinks market report also includes key purchase criteria and drivers of price sensitivity to help companies evaluate and develop their market growth analysis strategies.

Customer Landscape of Caffeine-Based Drinks Industry

Competitive Landscape

Companies are implementing various strategies, such as strategic alliances, caffeine-based drinks market forecast, partnerships, mergers and acquisitions, geographical expansion, and product/service launches, to enhance their presence in the industry.

Amway Corp. - The enterprise provides a diverse portfolio of functional energy beverages designed to deliver targeted stimulation and refreshment, addressing consumer demand for performance-enhancing hydration solutions.

The industry research and growth report includes detailed analyses of the competitive landscape of the market and information about key companies, including:

  • Amway Corp.
  • AriZona Beverages USA LLC
  • Associated British Foods Plc
  • Barrys Tea
  • Bigelow Tea
  • Celsius Holdings Inc.
  • ITO EN Ltd.
  • JDE Peets NV
  • Keurig Dr Pepper Inc.
  • LIPTON Teas and Infusions
  • Living Essentials Marketing
  • Monster Beverage Corp.
  • Nestle SA
  • PepsiCo Inc.
  • Red Bull GmbH
  • Taetea Group
  • Talking Rain Beverage Co.
  • Tata Consumer Products Ltd.
  • The Coca Cola Co.
  • The Republic of Tea Inc.

Qualitative and quantitative analysis of companies has been conducted to help clients understand the wider business environment as well as the strengths and weaknesses of key industry players. Data is qualitatively analyzed to categorize companies as pure play, category-focused, industry-focused, and diversified; it is quantitatively analyzed to categorize companies as dominant, leading, strong, tentative, and weak.

Recent Development and News in Caffeine-based drinks market

  • In the Soft Drinks and Non-alcoholic Beverages industry, the widespread adoption of proprietary yeast fermentation optimized flavor stabilization, directly impacting Caffeine-based Drinks demand by reducing raw material supply chain volatility by 25%.
  • Strict enforcement of sugar tax regulations across European jurisdictions compelled a massive reformulation toward low-calorie profiles, driving a 30% increase in the integration of fruit juice natural sweeteners within premium portfolios.
  • The rapid deployment of biotech-derived flavor solutions enabled advanced sensory consistency, effectively boosting the production efficiency of functional wellness elixirs and increasing overall manufacturing output by 18%.
  • Mandated transitions toward recyclable packaging materials under ISO 14001 compliance standards forced a structural redesign of ready-to-consume solutions, achieving a 20% reduction in supply chain transparency overhead for major production lines.

Dive into Technavio’s robust research methodology, blending expert interviews, extensive data synthesis, and validated models for unparalleled Caffeine-Based Drinks Market insights. See full methodology.

Market Scope
Page number 307
Base year 2025
Historic period 2020-2024
Forecast period 2026-2030
Growth momentum & CAGR Accelerate at a CAGR of 6.1%
Market growth 2026-2030 USD 99749.4 million
Market structure Fragmented
YoY growth 2025-2026(%) 5.8%
Key countries China, Japan, India, South Korea, Indonesia, Australia, US, Canada, Mexico, Germany, UK, France, Italy, Spain, The Netherlands, Brazil, Argentina, Chile, Saudi Arabia, UAE, Turkey, South Africa and Israel
Competitive landscape Leading Companies, Market Positioning of Companies, Competitive Strategies, and Industry Risks

Request Free Sample

Research Analyst Overview

  • The Caffeine-based Drinks sector is undergoing a structural paradigm shift dictated by elevated consumer expectations regarding ingredient transparency and physiological efficacy. Boardrooms are increasingly reallocating capital toward advanced research in L-theanine compounds and adaptogen blends to construct sophisticated, high-margin product portfolios that directly address modern cognitive fatigue.
  • This strategic pivot heavily influences compliance and product development protocols, compelling manufacturers to integrate green tea extract and guarana derivatives rather than relying exclusively on artificial alternatives. Operationally, the adoption of cold brew concentrate and specialized espresso-based extractions has fundamentally altered processing logistics, leading to a 28% improvement in raw material utilization efficiency across premium manufacturing lines.
  • Furthermore, the stringent necessity for precise nutrient fortification dictates rigorous quality control over global sourcing networks. Executives prioritizing these complex matrices ensure their formulations bypass the commoditization trap, positioning their brands to capture the lucrative demographic seeking both sustained stimulation and cellular health support without the adverse effects of heavy processing.

What are the Key Data Covered in this Caffeine-Based Drinks Market Research and Growth Report?

  • What is the expected growth of the Caffeine-Based Drinks Market between 2026 and 2030?

    • USD 99.75 billion, at a CAGR of 6.1%

  • What segmentation does the market report cover?

    • The report is segmented by Product (Carbonated drinks, Energy drinks, RTD coffee, and Others), Distribution Channel (Supermarkets, Departmental stores, Online retail stores, and Others), Flavor (Synthetic flavors, Natural flavors, and Others) and Geography (APAC, North America, Europe, South America, Middle East and Africa)

  • Which regions are analyzed in the report?

    • APAC, North America, Europe, South America and Middle East and Africa

  • What are the key growth drivers and market challenges?

    • Growing demand for functional and performance-enhancing beverages, Increasing health and wellness consciousness

  • Who are the major players in the Caffeine-Based Drinks Market?

    • Amway Corp., AriZona Beverages USA LLC, Associated British Foods Plc, Barrys Tea, Bigelow Tea, Celsius Holdings Inc., ITO EN Ltd., JDE Peets NV, Keurig Dr Pepper Inc., LIPTON Teas and Infusions, Living Essentials Marketing, Monster Beverage Corp., Nestle SA, PepsiCo Inc., Red Bull GmbH, Taetea Group, Talking Rain Beverage Co., Tata Consumer Products Ltd., The Coca Cola Co. and The Republic of Tea Inc.

Market Research Insights

  • The Caffeine-based Drinks industry is rapidly integrating advanced formulation technologies to meet shifting consumption habits. By utilizing modernized supply networks, leading manufacturers have improved product consistency, achieving a 25% increase in repeat purchase rates for multi-functional wellness elixirs.
  • Furthermore, the implementation of direct-to-consumer subscription models has enhanced customer retention, resulting in a 15% reduction in overall distribution costs compared to traditional retail pathways. To align with global sustainability targets, companies are aggressively adopting green packaging methods, which has successfully improved carbon neutrality commitments compliance by 30%.
  • These operational refinements ensure that enterprises maintain robust margins while satisfying the heightened demand for premium, performance-oriented hydration across diverse demographics.

We can help! Our analysts can customize this caffeine-based drinks market research report to meet your requirements.

Get in touch

1. Executive Summary

1.1 Market overview

Executive Summary - Chart on Market Overview
Executive Summary - Data Table on Market Overview
Executive Summary - Chart on Global Market Characteristics
Executive Summary - Chart on Market by Geography
Executive Summary - Chart on Market Segmentation by Product
Executive Summary - Chart on Market Segmentation by Distribution Channel
Executive Summary - Chart on Market Segmentation by Flavor
Executive Summary - Chart on Incremental Growth
Executive Summary - Data Table on Incremental Growth
Executive Summary - Chart on Company Market Positioning

2. Technavio Analysis

2.1 Analysis of price sensitivity, lifecycle, customer purchase basket, adoption rates, and purchase criteria

2.2 Criticality of inputs and Factors of differentiation

Chart on Overview on criticality of inputs and factors of differentiation

2.3 Factors of disruption

Chart on Overview on factors of disruption

2.4 Impact of drivers and challenges

Chart on Impact of drivers and challenges in 2025 and 2030

3. Market Landscape

3.1 Market ecosystem

Chart on Parent Market
Data Table on - Parent Market

3.2 Market characteristics

Chart on Market characteristics analysis

3.3 Value chain analysis

Chart on Value chain analysis

4. Market Sizing

4.1 Market definition

Data Table on Offerings of companies included in the market definition

4.2 Market segment analysis

Market segments

4.3 Market size 2025

4.4 Market outlook: Forecast for 2025-2030

Chart on Global - Market size and forecast 2025-2030 ($ million)
Data Table on Global - Market size and forecast 2025-2030 ($ million)
Chart on Global Market: Year-over-year growth 2025-2030 (%)
Data Table on Global Market: Year-over-year growth 2025-2030 (%)

5. Historic Market Size

5.1 Global Caffeine-Based Drinks Market 2020 - 2024

Historic Market Size - Data Table on Global Caffeine-Based Drinks Market 2020 - 2024 ($ million)

5.2 Product segment analysis 2020 - 2024

Historic Market Size - Product Segment 2020 - 2024 ($ million)

5.3 Distribution Channel segment analysis 2020 - 2024

Historic Market Size - Distribution Channel Segment 2020 - 2024 ($ million)

5.4 Flavor segment analysis 2020 - 2024

Historic Market Size - Flavor Segment 2020 - 2024 ($ million)

5.5 Geography segment analysis 2020 - 2024

Historic Market Size - Geography Segment 2020 - 2024 ($ million)

5.6 Country segment analysis 2020 - 2024

Historic Market Size - Country Segment 2020 - 2024 ($ million)

6. Qualitative Analysis

6.1 Impact of AI on Global Caffeine-based Drinks Market

6.2 Impact of Geopolitical Conflicts on Global Caffeine-based Drinks Market

7. Five Forces Analysis

7.1 Five forces summary

Five forces analysis - Comparison between 2025 and 2030

7.2 Bargaining power of buyers

Bargaining power of buyers - Impact of key factors 2025 and 2030

7.3 Bargaining power of suppliers

Bargaining power of suppliers - Impact of key factors in 2025 and 2030

7.4 Threat of new entrants

Threat of new entrants - Impact of key factors in 2025 and 2030

7.5 Threat of substitutes

Threat of substitutes - Impact of key factors in 2025 and 2030

7.6 Threat of rivalry

Threat of rivalry - Impact of key factors in 2025 and 2030

7.7 Market condition

Chart on Market condition - Five forces 2025 and 2030

8. Market Segmentation by Product

8.1 Market segments

Chart on Product - Market share 2025-2030 (%)
Data Table on Product - Market share 2025-2030 (%)

8.2 Comparison by Product

Chart on Comparison by Product
Data Table on Comparison by Product

8.3 Carbonated drinks - Market size and forecast 2025-2030

Chart on Carbonated drinks - Market size and forecast 2025-2030 ($ million)
Data Table on Carbonated drinks - Market size and forecast 2025-2030 ($ million)
Chart on Carbonated drinks - Year-over-year growth 2025-2030 (%)
Data Table on Carbonated drinks - Year-over-year growth 2025-2030 (%)

8.4 Energy drinks - Market size and forecast 2025-2030

Chart on Energy drinks - Market size and forecast 2025-2030 ($ million)
Data Table on Energy drinks - Market size and forecast 2025-2030 ($ million)
Chart on Energy drinks - Year-over-year growth 2025-2030 (%)
Data Table on Energy drinks - Year-over-year growth 2025-2030 (%)

8.5 RTD coffee - Market size and forecast 2025-2030

Chart on RTD coffee - Market size and forecast 2025-2030 ($ million)
Data Table on RTD coffee - Market size and forecast 2025-2030 ($ million)
Chart on RTD coffee - Year-over-year growth 2025-2030 (%)
Data Table on RTD coffee - Year-over-year growth 2025-2030 (%)

8.6 Others - Market size and forecast 2025-2030

Chart on Others - Market size and forecast 2025-2030 ($ million)
Data Table on Others - Market size and forecast 2025-2030 ($ million)
Chart on Others - Year-over-year growth 2025-2030 (%)
Data Table on Others - Year-over-year growth 2025-2030 (%)

8.7 Market opportunity by Product

Market opportunity by Product ($ million)
Data Table on Market opportunity by Product ($ million)

9. Market Segmentation by Distribution Channel

9.1 Market segments

Chart on Distribution Channel - Market share 2025-2030 (%)
Data Table on Distribution Channel - Market share 2025-2030 (%)

9.2 Comparison by Distribution Channel

Chart on Comparison by Distribution Channel
Data Table on Comparison by Distribution Channel

9.3 Supermarkets - Market size and forecast 2025-2030

Chart on Supermarkets - Market size and forecast 2025-2030 ($ million)
Data Table on Supermarkets - Market size and forecast 2025-2030 ($ million)
Chart on Supermarkets - Year-over-year growth 2025-2030 (%)
Data Table on Supermarkets - Year-over-year growth 2025-2030 (%)

9.4 Departmental stores - Market size and forecast 2025-2030

Chart on Departmental stores - Market size and forecast 2025-2030 ($ million)
Data Table on Departmental stores - Market size and forecast 2025-2030 ($ million)
Chart on Departmental stores - Year-over-year growth 2025-2030 (%)
Data Table on Departmental stores - Year-over-year growth 2025-2030 (%)

9.5 Online retail stores - Market size and forecast 2025-2030

Chart on Online retail stores - Market size and forecast 2025-2030 ($ million)
Data Table on Online retail stores - Market size and forecast 2025-2030 ($ million)
Chart on Online retail stores - Year-over-year growth 2025-2030 (%)
Data Table on Online retail stores - Year-over-year growth 2025-2030 (%)

9.6 Others - Market size and forecast 2025-2030

Chart on Others - Market size and forecast 2025-2030 ($ million)
Data Table on Others - Market size and forecast 2025-2030 ($ million)
Chart on Others - Year-over-year growth 2025-2030 (%)
Data Table on Others - Year-over-year growth 2025-2030 (%)

9.7 Market opportunity by Distribution Channel

Market opportunity by Distribution Channel ($ million)
Data Table on Market opportunity by Distribution Channel ($ million)

10. Market Segmentation by Flavor

10.1 Market segments

Chart on Flavor - Market share 2025-2030 (%)
Data Table on Flavor - Market share 2025-2030 (%)

10.2 Comparison by Flavor

Chart on Comparison by Flavor
Data Table on Comparison by Flavor

10.3 Synthetic flavors - Market size and forecast 2025-2030

Chart on Synthetic flavors - Market size and forecast 2025-2030 ($ million)
Data Table on Synthetic flavors - Market size and forecast 2025-2030 ($ million)
Chart on Synthetic flavors - Year-over-year growth 2025-2030 (%)
Data Table on Synthetic flavors - Year-over-year growth 2025-2030 (%)

10.4 Natural flavors - Market size and forecast 2025-2030

Chart on Natural flavors - Market size and forecast 2025-2030 ($ million)
Data Table on Natural flavors - Market size and forecast 2025-2030 ($ million)
Chart on Natural flavors - Year-over-year growth 2025-2030 (%)
Data Table on Natural flavors - Year-over-year growth 2025-2030 (%)

10.5 Others - Market size and forecast 2025-2030

Chart on Others - Market size and forecast 2025-2030 ($ million)
Data Table on Others - Market size and forecast 2025-2030 ($ million)
Chart on Others - Year-over-year growth 2025-2030 (%)
Data Table on Others - Year-over-year growth 2025-2030 (%)

10.6 Market opportunity by Flavor

Market opportunity by Flavor ($ million)
Data Table on Market opportunity by Flavor ($ million)

11. Customer Landscape

11.1 Customer landscape overview

Analysis of price sensitivity, lifecycle, customer purchase basket, adoption rates, and purchase criteria

12. Geographic Landscape

12.1 Geographic segmentation

Chart on Market share by geography 2025-2030 (%)
Data Table on Market share by geography 2025-2030 (%)

12.2 Geographic comparison

Chart on Geographic comparison
Data Table on Geographic comparison

12.3 APAC - Market size and forecast 2025-2030

Chart on APAC - Market size and forecast 2025-2030 ($ million)
Data Table on APAC - Market size and forecast 2025-2030 ($ million)
Chart on APAC - Year-over-year growth 2025-2030 (%)
Data Table on APAC - Year-over-year growth 2025-2030 (%)
Chart on Regional Comparison - APAC
Data Table on Regional Comparison - APAC

12.3.1 China - Market size and forecast 2025-2030

Chart on China - Market size and forecast 2025-2030 ($ million)
Data Table on China - Market size and forecast 2025-2030 ($ million)
Chart on China - Year-over-year growth 2025-2030 (%)
Data Table on China - Year-over-year growth 2025-2030 (%)

12.3.2 Japan - Market size and forecast 2025-2030

Chart on Japan - Market size and forecast 2025-2030 ($ million)
Data Table on Japan - Market size and forecast 2025-2030 ($ million)
Chart on Japan - Year-over-year growth 2025-2030 (%)
Data Table on Japan - Year-over-year growth 2025-2030 (%)

12.3.3 India - Market size and forecast 2025-2030

Chart on India - Market size and forecast 2025-2030 ($ million)
Data Table on India - Market size and forecast 2025-2030 ($ million)
Chart on India - Year-over-year growth 2025-2030 (%)
Data Table on India - Year-over-year growth 2025-2030 (%)

12.3.4 South Korea - Market size and forecast 2025-2030

Chart on South Korea - Market size and forecast 2025-2030 ($ million)
Data Table on South Korea - Market size and forecast 2025-2030 ($ million)
Chart on South Korea - Year-over-year growth 2025-2030 (%)
Data Table on South Korea - Year-over-year growth 2025-2030 (%)

12.3.5 Indonesia - Market size and forecast 2025-2030

Chart on Indonesia - Market size and forecast 2025-2030 ($ million)
Data Table on Indonesia - Market size and forecast 2025-2030 ($ million)
Chart on Indonesia - Year-over-year growth 2025-2030 (%)
Data Table on Indonesia - Year-over-year growth 2025-2030 (%)

12.3.6 Australia - Market size and forecast 2025-2030

Chart on Australia - Market size and forecast 2025-2030 ($ million)
Data Table on Australia - Market size and forecast 2025-2030 ($ million)
Chart on Australia - Year-over-year growth 2025-2030 (%)
Data Table on Australia - Year-over-year growth 2025-2030 (%)

12.4 North America - Market size and forecast 2025-2030

Chart on North America - Market size and forecast 2025-2030 ($ million)
Data Table on North America - Market size and forecast 2025-2030 ($ million)
Chart on North America - Year-over-year growth 2025-2030 (%)
Data Table on North America - Year-over-year growth 2025-2030 (%)
Chart on Regional Comparison - North America
Data Table on Regional Comparison - North America

12.4.1 US - Market size and forecast 2025-2030

Chart on US - Market size and forecast 2025-2030 ($ million)
Data Table on US - Market size and forecast 2025-2030 ($ million)
Chart on US - Year-over-year growth 2025-2030 (%)
Data Table on US - Year-over-year growth 2025-2030 (%)

12.4.2 Canada - Market size and forecast 2025-2030

Chart on Canada - Market size and forecast 2025-2030 ($ million)
Data Table on Canada - Market size and forecast 2025-2030 ($ million)
Chart on Canada - Year-over-year growth 2025-2030 (%)
Data Table on Canada - Year-over-year growth 2025-2030 (%)

12.4.3 Mexico - Market size and forecast 2025-2030

Chart on Mexico - Market size and forecast 2025-2030 ($ million)
Data Table on Mexico - Market size and forecast 2025-2030 ($ million)
Chart on Mexico - Year-over-year growth 2025-2030 (%)
Data Table on Mexico - Year-over-year growth 2025-2030 (%)

12.5 Europe - Market size and forecast 2025-2030

Chart on Europe - Market size and forecast 2025-2030 ($ million)
Data Table on Europe - Market size and forecast 2025-2030 ($ million)
Chart on Europe - Year-over-year growth 2025-2030 (%)
Data Table on Europe - Year-over-year growth 2025-2030 (%)
Chart on Regional Comparison - Europe
Data Table on Regional Comparison - Europe

12.5.1 Germany - Market size and forecast 2025-2030

Chart on Germany - Market size and forecast 2025-2030 ($ million)
Data Table on Germany - Market size and forecast 2025-2030 ($ million)
Chart on Germany - Year-over-year growth 2025-2030 (%)
Data Table on Germany - Year-over-year growth 2025-2030 (%)

12.5.2 UK - Market size and forecast 2025-2030

Chart on UK - Market size and forecast 2025-2030 ($ million)
Data Table on UK - Market size and forecast 2025-2030 ($ million)
Chart on UK - Year-over-year growth 2025-2030 (%)
Data Table on UK - Year-over-year growth 2025-2030 (%)

12.5.3 France - Market size and forecast 2025-2030

Chart on France - Market size and forecast 2025-2030 ($ million)
Data Table on France - Market size and forecast 2025-2030 ($ million)
Chart on France - Year-over-year growth 2025-2030 (%)
Data Table on France - Year-over-year growth 2025-2030 (%)

12.5.4 Italy - Market size and forecast 2025-2030

Chart on Italy - Market size and forecast 2025-2030 ($ million)
Data Table on Italy - Market size and forecast 2025-2030 ($ million)
Chart on Italy - Year-over-year growth 2025-2030 (%)
Data Table on Italy - Year-over-year growth 2025-2030 (%)

12.5.5 Spain - Market size and forecast 2025-2030

Chart on Spain - Market size and forecast 2025-2030 ($ million)
Data Table on Spain - Market size and forecast 2025-2030 ($ million)
Chart on Spain - Year-over-year growth 2025-2030 (%)
Data Table on Spain - Year-over-year growth 2025-2030 (%)

12.5.6 The Netherlands - Market size and forecast 2025-2030

Chart on The Netherlands - Market size and forecast 2025-2030 ($ million)
Data Table on The Netherlands - Market size and forecast 2025-2030 ($ million)
Chart on The Netherlands - Year-over-year growth 2025-2030 (%)
Data Table on The Netherlands - Year-over-year growth 2025-2030 (%)

12.6 South America - Market size and forecast 2025-2030

Chart on South America - Market size and forecast 2025-2030 ($ million)
Data Table on South America - Market size and forecast 2025-2030 ($ million)
Chart on South America - Year-over-year growth 2025-2030 (%)
Data Table on South America - Year-over-year growth 2025-2030 (%)
Chart on Regional Comparison - South America
Data Table on Regional Comparison - South America

12.6.1 Brazil - Market size and forecast 2025-2030

Chart on Brazil - Market size and forecast 2025-2030 ($ million)
Data Table on Brazil - Market size and forecast 2025-2030 ($ million)
Chart on Brazil - Year-over-year growth 2025-2030 (%)
Data Table on Brazil - Year-over-year growth 2025-2030 (%)

12.6.2 Argentina - Market size and forecast 2025-2030

Chart on Argentina - Market size and forecast 2025-2030 ($ million)
Data Table on Argentina - Market size and forecast 2025-2030 ($ million)
Chart on Argentina - Year-over-year growth 2025-2030 (%)
Data Table on Argentina - Year-over-year growth 2025-2030 (%)

12.6.3 Chile - Market size and forecast 2025-2030

Chart on Chile - Market size and forecast 2025-2030 ($ million)
Data Table on Chile - Market size and forecast 2025-2030 ($ million)
Chart on Chile - Year-over-year growth 2025-2030 (%)
Data Table on Chile - Year-over-year growth 2025-2030 (%)

12.7 Middle East and Africa - Market size and forecast 2025-2030

Chart on Middle East and Africa - Market size and forecast 2025-2030 ($ million)
Data Table on Middle East and Africa - Market size and forecast 2025-2030 ($ million)
Chart on Middle East and Africa - Year-over-year growth 2025-2030 (%)
Data Table on Middle East and Africa - Year-over-year growth 2025-2030 (%)
Chart on Regional Comparison - Middle East and Africa
Data Table on Regional Comparison - Middle East and Africa

12.7.1 Saudi Arabia - Market size and forecast 2025-2030

Chart on Saudi Arabia - Market size and forecast 2025-2030 ($ million)
Data Table on Saudi Arabia - Market size and forecast 2025-2030 ($ million)
Chart on Saudi Arabia - Year-over-year growth 2025-2030 (%)
Data Table on Saudi Arabia - Year-over-year growth 2025-2030 (%)

12.7.2 UAE - Market size and forecast 2025-2030

Chart on UAE - Market size and forecast 2025-2030 ($ million)
Data Table on UAE - Market size and forecast 2025-2030 ($ million)
Chart on UAE - Year-over-year growth 2025-2030 (%)
Data Table on UAE - Year-over-year growth 2025-2030 (%)

12.7.3 Turkey - Market size and forecast 2025-2030

Chart on Turkey - Market size and forecast 2025-2030 ($ million)
Data Table on Turkey - Market size and forecast 2025-2030 ($ million)
Chart on Turkey - Year-over-year growth 2025-2030 (%)
Data Table on Turkey - Year-over-year growth 2025-2030 (%)

12.7.4 South Africa - Market size and forecast 2025-2030

Chart on South Africa - Market size and forecast 2025-2030 ($ million)
Data Table on South Africa - Market size and forecast 2025-2030 ($ million)
Chart on South Africa - Year-over-year growth 2025-2030 (%)
Data Table on South Africa - Year-over-year growth 2025-2030 (%)

12.7.5 Israel - Market size and forecast 2025-2030

Chart on Israel - Market size and forecast 2025-2030 ($ million)
Data Table on Israel - Market size and forecast 2025-2030 ($ million)
Chart on Israel - Year-over-year growth 2025-2030 (%)
Data Table on Israel - Year-over-year growth 2025-2030 (%)

12.8 Market opportunity by geography

Market opportunity by geography ($ million)
Data Tables on Market opportunity by geography ($ million)

13. Drivers, Challenges, and Opportunity

13.1 Market drivers

Growing demand for functional and performance-enhancing beverages
Proliferation of product innovation and portfolio expansion
Influence of convenience and on go lifestyles

13.2 Market challenges

Increasing health and wellness consciousness
Stringent regulatory scrutiny and negative public perception
Intense market competition and saturation

13.3 Impact of drivers and challenges

Impact of drivers and challenges in 2025 and 2030

13.4 Market opportunities

Emergence of clean and natural ingredients
Convergence of caffeine with enhanced functionality
Sophistication and diversification of flavor profiles

14. Competitive Landscape

14.1 Overview

14.2

Overview on criticality of inputs and factors of differentiation

14.3 Landscape disruption

Overview on factors of disruption

14.4 Industry risks

Impact of key risks on business

15. Competitive Analysis

15.1 Companies profiled

Companies covered

15.2 Company ranking index

15.3 Market positioning of companies

Matrix on companies position and classification

15.4 Amway Corp.

Amway Corp. - Overview
Amway Corp. - Product / Service
Amway Corp. - Key offerings
SWOT

15.5 AriZona Beverages USA LLC

AriZona Beverages USA LLC - Overview
AriZona Beverages USA LLC - Product / Service
AriZona Beverages USA LLC - Key offerings
SWOT

15.6 Associated British Foods Plc

Associated British Foods Plc - Overview
Associated British Foods Plc - Business segments
Associated British Foods Plc - Key offerings
Associated British Foods Plc - Segment focus
SWOT

15.7 Celsius Holdings Inc.

Celsius Holdings Inc. - Overview
Celsius Holdings Inc. - Product / Service
Celsius Holdings Inc. - Key offerings
SWOT

15.8 ITO EN Ltd.

ITO EN Ltd. - Overview
ITO EN Ltd. - Business segments
ITO EN Ltd. - Key offerings
ITO EN Ltd. - Segment focus
SWOT

15.9 JDE Peets NV

JDE Peets NV - Overview
JDE Peets NV - Business segments
JDE Peets NV - Key offerings
JDE Peets NV - Segment focus
SWOT

15.10 Keurig Dr Pepper Inc.

Keurig Dr Pepper Inc. - Overview
Keurig Dr Pepper Inc. - Business segments
Keurig Dr Pepper Inc. - Key offerings
Keurig Dr Pepper Inc. - Segment focus
SWOT

15.11 LIPTON Teas and Infusions

LIPTON Teas and Infusions - Overview
LIPTON Teas and Infusions - Product / Service
LIPTON Teas and Infusions - Key offerings
SWOT

15.12 Nestle SA

Nestle SA - Overview
Nestle SA - Business segments
Nestle SA - Key news
Nestle SA - Key offerings
Nestle SA - Segment focus
SWOT

15.13 PepsiCo Inc.

PepsiCo Inc. - Overview
PepsiCo Inc. - Business segments
PepsiCo Inc. - Key news
PepsiCo Inc. - Key offerings
PepsiCo Inc. - Segment focus
SWOT

15.14 Red Bull GmbH

Red Bull GmbH - Overview
Red Bull GmbH - Product / Service
Red Bull GmbH - Key offerings
SWOT

15.15 Talking Rain Beverage Co.

Talking Rain Beverage Co. - Overview
Talking Rain Beverage Co. - Product / Service
Talking Rain Beverage Co. - Key offerings
SWOT

15.16 Tata Consumer Products Ltd.

Tata Consumer Products Ltd. - Overview
Tata Consumer Products Ltd. - Business segments
Tata Consumer Products Ltd. - Key offerings
Tata Consumer Products Ltd. - Segment focus
SWOT

15.17 The Coca Cola Co.

The Coca Cola Co. - Overview
The Coca Cola Co. - Business segments
The Coca Cola Co. - Key offerings
The Coca Cola Co. - Segment focus
SWOT

15.18 The Republic of Tea Inc.

The Republic of Tea Inc. - Overview
The Republic of Tea Inc. - Product / Service
The Republic of Tea Inc. - Key offerings
SWOT

16. Appendix

16.1 Scope of the report

Market definition
Objectives
Notes and caveats

16.2 Inclusions and exclusions checklist

Inclusions checklist
Exclusions checklist

16.3 Currency conversion rates for US$

16.4 Research methodology

16.5 Data procurement

Information sources

16.6 Data validation

16.7 Validation techniques employed for market sizing

16.8 Data synthesis

16.9 360 degree market analysis

16.10 List of abbreviations

Research Methodology

Technavio presents a detailed picture of the market by way of study, synthesis, and summation of data from multiple sources. The analysts have presented the various facets of the market with a particular focus on identifying the key industry influencers. The data thus presented is comprehensive, reliable, and the result of extensive research, both primary and secondary.

INFORMATION SOURCES

Primary sources

  • Manufacturers and suppliers
  • Channel partners
  • Industry experts
  • Strategic decision makers

Secondary sources

  • Industry journals and periodicals
  • Government data
  • Financial reports of key industry players
  • Historical data
  • Press releases

DATA ANALYSIS

Data Synthesis

  • Collation of data
  • Estimation of key figures
  • Analysis of derived insights

Data Validation

  • Triangulation with data models
  • Reference against proprietary databases
  • Corroboration with industry experts

REPORT WRITING

Qualitative

  • Market drivers
  • Market challenges
  • Market trends
  • Five forces analysis

Quantitative

  • Market size and forecast
  • Market segmentation
  • Geographical insights
  • Competitive landscape

Interested in this report?

Get your sample now to see our research methodology and insights!

Download Now

Frequently Asked Questions

Caffeine-Based Drinks market growth will increase by USD 99749.4 million during 2026-2030.

The Caffeine-Based Drinks market is expected to grow at a CAGR of 6.1% during 2026-2030.

Caffeine-Based Drinks market is segmented by Product (Carbonated drinks, Energy drinks, RTD coffee, Others) Distribution channel (Supermarkets, Departmental stores, Online retail stores, Others) Flavor (Synthetic flavors, Natural flavors, Others)

Amway Corp., AriZona Beverages USA LLC, Associated British Foods Plc, Barrys Tea, Bigelow Tea, Celsius Holdings Inc., ITO EN Ltd., JDE Peets NV, Keurig Dr Pepper Inc., LIPTON Teas and Infusions, Living Essentials Marketing, Monster Beverage Corp., Nestle SA, PepsiCo Inc., Red Bull GmbH, Taetea Group, Talking Rain Beverage Co., Tata Consumer Products Ltd., The Coca Cola Co., The Republic of Tea Inc. are a few of the key vendors in the Caffeine-Based Drinks market.

APAC will register the highest growth rate of 38.3% among the other regions. Therefore, the Caffeine-Based Drinks market in APAC is expected to garner significant business opportunities for the vendors during the forecast period.

China, Japan, India, South Korea, Indonesia, Australia, US, Canada, Mexico, Germany, UK, France, Italy, Spain, The Netherlands, Brazil, Argentina, Chile, Saudi Arabia, UAE, Turkey, South Africa, Israel

  • Growing demand for functional and performance-enhancing beverages is the driving factor this market.

The Caffeine-Based Drinks market vendors should focus on grabbing business opportunities from the Product segment as it accounted for the largest market share in the base year.
RIA - Research AI Assistant
Ask RIA