Calcium Butyrate Market Size 2024-2028
The calcium butyrate market size is forecast to increase by USD 82.7 million at a CAGR of 7.4% between 2023 and 2028.
- The market is experiencing significant growth due to expanding opportunities In the animal feed industry, particularly in developing countries. companies in this market are increasingly focusing on new product development to cater to the evolving needs of consumers and regulatory bodies. Stringent government regulations regarding feed additives add complexity to the market landscape, necessitating compliance from market participants. These trends are shaping the growth trajectory of the market.
- Furthermore, calcium butyrate, a form of butyric acid, is a vital feed additive that offers numerous benefits, including improved gut health and enhanced feed conversion efficiency. The market's growth is underpinned by its wide application in various animal species, including poultry, swine, and ruminants. The market is poised for steady expansion In the coming years, driven by these key trends and challenges.
What will be the Size of the Calcium Butyrate Market During the Forecast Period?
- The market In the US is experiencing significant growth due to its applications in various industries, including dietary supplements and animal feeds. In the animal feed sector, calcium butyrate is increasingly being used to promote physiological balance and enhance animal performance in poultry, dairy farming, and egg production. Its role as a hormonal growth regulator and microbial growth promoter makes it an essential additive in animal feeds. Calcium butyrate aids In the production of short-chain fatty acids, which improve nutrient absorption and gut health in livestock, including swine and aquaculture species.
- Additionally, calcium butyrate boosts the immune response, contributing to better animal health and improved feed conversion ratios. The health benefits of calcium butyrate extend to humans, making it a valuable ingredient in dietary supplements for digestive enzymes and intestinal health. Overall, the market is poised for continued growth due to its role in enhancing animal health, productivity, and the production of high-quality animal protein.
How is this Calcium Butyrate Industry segmented and which is the largest segment?
The calcium butyrate industry research report provides comprehensive data (region-wise segment analysis), with forecasts and estimates in "USD million" for the period 2024-2028, as well as historical data from 2018-2022 for the following segments.
- Application
- Animal feed
- Nutritional supplements
- Pharmaceuticals
- Type
- Powder
- Liquid
- Geography
- North America
- US
- APAC
- China
- India
- Europe
- Germany
- France
- South America
- Middle East and Africa
- North America
By Application Insights
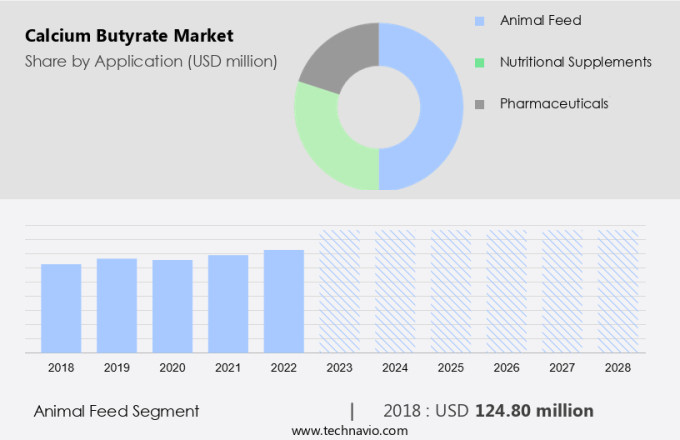
- The animal feed segment is estimated to witness significant growth during the forecast period.
Calcium butyrate, a feed additive derived from butyric acid, plays a significant role in enhancing animal health and performance In the livestock industry. This additive, available in various concentrations (98%, coated 30%, 60%, and 90%), is instrumental in fortifying the gut lining, promoting beneficial gut flora, and improving nutrient absorption and digestion in animals.
In dairy cattle, it boosts milk yield and quality, while in poultry, it enhances egg quality, including shell strength. Sanluc International offers innovative products, such as GBM Performant, a highly concentrated form of encapsulated calcium butyrate, specifically designed for monogastric animals like piglets, pigs, and sows. This additive's benefits extend to the vegan population, as it is also used as a prebiotic in human nutrition, promoting gut health and reducing inflammation and cancerous cells. The production also aligns with animal welfare standards, as it is derived from renewable sources and does not contain antibiotics or other growth promoters.
Get a glance at the Calcium Butyrate Industry report of share of various segments Request Free Sample
The animal feed segment was valued at USD 124.80 billion in 2018 and showed a gradual increase during the forecast period.
Regional Analysis
- APAC is estimated to contribute 37% to the growth of the global market during the forecast period.
Technavio's analysts have elaborately explained the regional trends and drivers that shape the market during the forecast period.
For more insights on the market share of various regions, Request Free Sample
The North American region, consisting of the US and Canada, is the largest producer of compound feed globally, accounting for approximately 20.6% of the world's total production in 2022, which stood at 1.266 billion tons. With a production volume of 261.69 million tons in 2022, representing a 0.88% increase from the previous year, North America produced over 284 million tons of finished feed and pet food annually.
In the US alone, according to the American Feed Industry Association (AFIA). It is a key ingredient in animal feed, and plays a significant role in this industry. It functions as a calcium source, coloring and flavoring agent, and a source of butyric acid, which contributes to gut health and animal performance in swine. This is derived from the fermentation of dairy products and is used In the production of compound feed to enhance animal nutrition.
Market Dynamics
Our market researchers analyzed the data with 2023 as the base year, along with the key drivers, trends, and challenges. A holistic analysis of drivers will help companies refine their marketing strategies to gain a competitive advantage.
What are the key market drivers leading to the rise In the adoption of Calcium Butyrate Industry?
Expanding the animal feed industry in developing countries is the key driver of the market.
- The market is experiencing significant growth due to the expanding animal feed industry, particularly in developing countries. For instance, India's animal feed industry was valued at USD11.7 billion in 2022, marking a 9.4% increase from the previous year. This growth is attributed to the low penetration of organic feed and increasing formal offtake. The compound feed industry is projected to expand at a rate of 6.3% from 2023 to 2028, with the potential capacity addition of 10-18 million metric tons. The rising demand for animal feed is driven by the need to enhance livestock productivity and health, leading to an increased demand for feed additives such as calcium butyrate. Calcium Butyrate is a sodium or calcium salt of butyric acid, which is a short-chain fatty acid. It is widely used as a feed additive In the animal feed industry for various health benefits. In poultry and dairy farming, it is used to maintain physiological calcium balance and improve gut health, leading to better animal performance.
- In the case of pigs, it is used as a growth promoter and improves feed conversion ratios. Moreover, calcium butyrate has been found to have anti-inflammatory and anti-cancer effects, making it an attractive additive for animal feed. It also acts as a flavoring and coloring agent in some food products. In the food industry, it is used as a preservative and In the production of functional foods, especially those related to sustainable nutrition and health and wellness. They are also used In the aquaculture industry to improve the growth and health of fish. It enhances nutrient absorption and immune response in fish, leading to better animal health and high-quality animal protein production. In the context of the vegan population, it is used as a nutritional supplement in food supplements and food additives. It is an essential nutrient for maintaining intestinal health and hormonal development in humans.
- Furthermore, calcium Butyrate is produced through microbial fermentation or chemical synthesis. It is an off-white colored, odorless, and tasteless powder. It is soluble in water and can be easily added to animal feed or food products. Overall, the market is expected to grow significantly due to the expanding animal feed industry, particularly in developing countries. Its health benefits, including improving gut health, enhancing animal performance, and acting as an anti-inflammatory and anti-cancer agent, make it an attractive additive for animal feed and food products. The increasing demand for sustainable nutrition and health and wellness products is also driving the growth of the market.
What are the market trends shaping the Calcium Butyrate Industry?
The growing focus of market players on new product development is the upcoming market trend.
- The market is experiencing growth due to the increasing demand for advanced feed additives that promote animal health and performance. Calcium butyrate, a sodium butyrate calcium salt, is gaining popularity as a key ingredient in dietary supplements and animal feeds for various livestock, including poultry, dairy farming, and egg production. The health benefits include maintaining physiological balance, enhancing inflammation response, and inhibiting the growth of pathogens such as Salmonella and coliform bacteria. In the poultry industry, it is used to improve gut health and nutrient absorption, leading to better feed conversion ratios and higher-quality animal protein.
- In dairy farming, it is used as a growth promoter and to improve hormonal development. For the vegan population, it is available as a food supplement, providing the health benefits of butyric acid, a short-chain fatty acid, without the need for animal-derived goods. Calcium butyrate is also used In the food industry as a preservative and flavoring agent, and it can be found in various dairy products. The use in animal feed and food supplements is driven by the growing trend towards sustainable nutrition and animal welfare initiatives. The market is expected to continue growing as research reveals its anti-cancer effects and its role in microbial fermentation, which can lead to improved metabolic processes and immune response.
What challenges does the Calcium Butyrate Industry face during its growth?
Stringent government regulations associated with feed additives are a key challenge affecting the industry's growth.
- The market In the US is driven by its applications in various sectors, including dietary supplements and animal feeds. In animal nutrition, calcium butyrate is utilized for promoting physiological balance, enhancing immune response, and improving nutrient absorption in poultry, dairy farming, and egg production. For poultry and livestock, calcium butyrate functions as a growth promoter and contributes to better feed conversion ratios, resulting in high-quality animal protein. In the dairy industry, calcium butyrate is used as a functional food additive, contributing to gut health and animal performance. In the feed industry, it is an advanced feed additive that aids in microbial growth and hormonal development. The compound's anti-inflammatory properties help prevent pathogens such as Salmonella and coliform bacteria, ensuring animal welfare and food safety. Calcium butyrate is also used as a preservative and flavoring agent in food supplements and dairy products. As a coloring agent, it is an off-white colored calcium salt.
- In the vegan population, calcium butyrate is used as a substitute for animal-derived goods, such as butyric acid, in pork consumption. Animal welfare initiatives have led to an increased demand for antibiotic-free farming, further driving the market. Calcium butyrate's role in metabolic processes and its anti-cancer effects have gained significant attention in recent years. The compound is produced through microbial fermentation and esterified tributyrin. The food industry utilizes them as a food additive due to its benefits in digestive health and immune response. The market's growth is influenced by factors such as increasing consumer awareness of sustainable nutrition and the rising demand for advanced feed additives.
Exclusive Customer Landscape
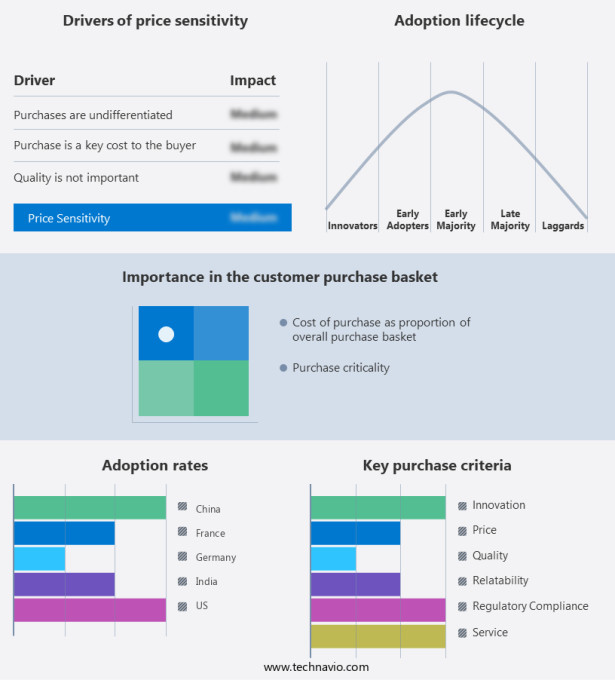
The market forecasting report includes the adoption lifecycle of the market, covering from the innovator's stage to the laggard's stage. It focuses on adoption rates in different regions based on penetration. Furthermore, the market report also includes key purchase criteria and drivers of price sensitivity to help companies evaluate and develop their market growth analysis strategies.
Customer Landscape
Key Companies & Market Insights
Companies are implementing various strategies, such as strategic alliances, market forecast, partnerships, mergers and acquisitions, geographical expansion, and product/service launches, to enhance their presence In the industry. The industry research and growth report includes detailed analyses of the competitive landscape of the market and information about key companies, including:
- A.M Food Chemical Co. Ltd.
- Aadhunik Industries
- Anmol Chemicals Pvt Ltd
- BioFuran Materials LLC
- BodyBio Inc.
- Innov Ad NV SA
- Jainex Speciality Chemical
- Jubilant Ingrevia Ltd.
- Kemin Industries Inc.
- Nutreco N.V.
- Palital BV
- PUYER BIOPHARMA CO LTD
- Sanluc International nv
- Shandong Natural Micron Pharm Tech Co Ltd.
- Sigma Aldrich Chemicals Pvt Ltd
- Singao Agribusiness Development Co Ltd
- Spectrum Laboratory Products Inc.
- Tokyo Chemical Industry Co., Ltd.
- Ultra Chemical Works
- West Bengal Chemical Industries Ltd.
Qualitative and quantitative analysis of companies has been conducted to help clients understand the wider business environment as well as the strengths and weaknesses of key industry players. Data is qualitatively analyzed to categorize companies as pure play, category-focused, industry-focused, and diversified; it is quantitatively analyzed to categorize companies as dominant, leading, strong, tentative, and weak.
Research Analyst Overview
Calcium butyrate, a calcium salt of butyric acid, is a short-chain fatty acid (SCFA) that plays a crucial role in various physiological processes. This organic compound is naturally produced In the human and animal digestive tract by the fermentation of dietary fiber by microorganisms. The demand has been increasing due to its numerous health benefits for both humans and animals. In animal nutrition, calcium butyrate is used as an advanced feed additive to promote animal health and performance. It plays a significant role in maintaining the physiological calcium balance in animals, contributing to optimal growth and development. Calcium butyrate is particularly beneficial for the livestock industry, including poultry and dairy farming. In poultry production, it is used in animal feed to improve nutrient absorption and enhance the immune response. It helps In the prevention of pathogens such as Salmonella and coliform bacteria, ensuring the production of healthy birds. In dairy farming, calcium butyrate is used to improve the health and welfare of cattle. It aids in hormonal development and contributes to better feed conversion ratios, resulting in high-quality animal protein.
Additionally, calcium butyrate has been found to have anticancer effects, making it an essential additive In the prevention of cancerous cells in animal-derived goods. This is also gaining popularity In the food industry as a food additive. It is used as a preservative and a flavoring agent in various dairy products. The off-white colored calcium salt is also used as a coloring agent in some food supplements and functional foods. The use of them in animal feed and food supplements is not limited to traditional animal agriculture. It is also used in vegan populations as a source of butyric acid, which is essential for maintaining gut health. The production involves microbial fermentation, where butyric acid is produced and then reacts with calcium to form calcium butyrate. This process ensures the production of a high-quality product that is free from harmful chemicals and materials. They have numerous applications In the food industry, including as a preservative, flavoring agent, and coloring agent. It is also used In the production of advanced feed additives for livestock and poultry, contributing to better animal health, performance, and welfare.
Furthermore, the use of calcium butyrate as a growth promoter in animal feed and food supplements is a sustainable nutrition solution that aligns with current trends In the health and wellness industry. It is an essential nutrient for maintaining the physiological balance in animals and humans, contributing to optimal growth, development, and health. Overall, it is a versatile compound with numerous applications In the animal nutrition and food industries. Its production involves microbial fermentation, ensuring the production of a high-quality product that is free from harmful chemicals and materials. The use of them as a growth promoter, feed additive, and food ingredient is a sustainable solution that contributes to better animal health, performance, and welfare, as well as human health and wellness.
|
Calcium Butyrate Market Scope |
|
|
Report Coverage |
Details |
|
Page number |
203 |
|
Base year |
2023 |
|
Historic period |
2018-2022 |
|
Forecast period |
2024-2028 |
|
Growth momentum & CAGR |
Accelerate at a CAGR of 7.4% |
|
Market growth 2024-2028 |
USD 82.7 million |
|
Market structure |
Fragmented |
|
YoY growth 2023-2024(%) |
6.0 |
|
Key countries |
US, China, India, Germany, and France |
|
Competitive landscape |
Leading Companies, Market Positioning of Companies, Competitive Strategies, and Industry Risks |
What are the Key Data Covered in this Calcium Butyrate Market Research and Growth Report?
- CAGR of the Calcium Butyrate industry during the forecast period
- Detailed information on factors that will drive the Calcium Butyrate growth and forecasting between 2024 and 2028
- Precise estimation of the size of the market and its contribution of the industry in focus to the parent market
- Accurate predictions about upcoming growth and trends and changes in consumer behaviour
- Growth of the market across North America, APAC, Europe, South America, and Middle East and Africa
- Thorough analysis of the market's competitive landscape and detailed information about companies
- Comprehensive analysis of factors that will challenge the calcium butyrate market growth of industry companies
We can help! Our analysts can customize this calcium butyrate market research report to meet your requirements.


