North America Calcium Carbonate Market Analysis, Size, and Forecast 2026-2030: North America (US, Mexico, and Canada)

North America Calcium Carbonate Market Analysis, Size, and Forecast 2026-2030:
North America (US, Mexico, and Canada)

Published: May 2026 214 Pages SKU: IRTNTR73072

Market Overview at a Glance

$6.05 B
Market Opportunity
7.5%
CAGR 2025 - 2030
7.0%
YoY growth 2025-2026(%)
$10.25 B
GCC segment 2024

North America Calcium Carbonate Market Size 2026-2030

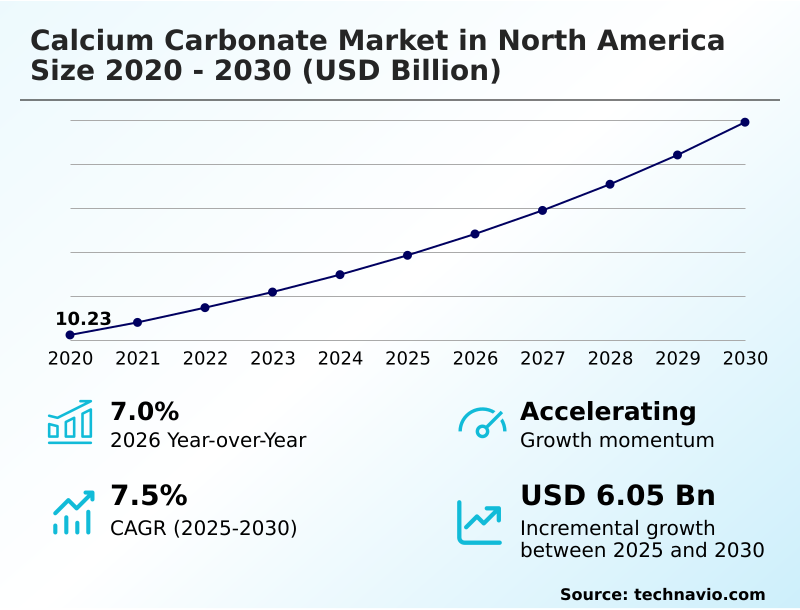
The north america calcium carbonate market size is valued to increase by USD 6.05 billion, at a CAGR of 7.5% from 2025 to 2030. Strategic integration of carbon capture and mineralization technologies will drive the north america calcium carbonate market.

Major Market Trends & Insights

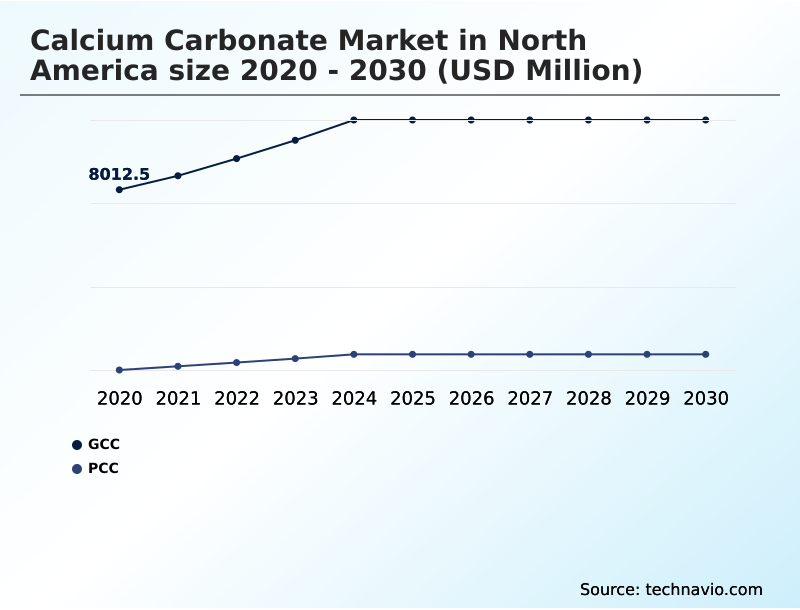
  • By Type - GCC segment was valued at USD 10.25 billion in 2024
  • By Application - Fillers segment accounted for the largest market revenue share in 2024

Market Size & Forecast

  • Market Opportunities: USD 9.67 billion
  • Market Future Opportunities: USD 6.05 billion
  • CAGR from 2025 to 2030 : 7.5%

Market Summary

  • The calcium carbonate market in North America is characterized by a fundamental division between ground calcium carbonate (gcc), produced by mechanically processing limestone, and precipitated calcium carbonate (pcc), a synthetic product offering higher purity. As a critical functional filler, it enhances performance while reducing costs in sectors such as paper, plastics, and construction.
  • A key dynamic is the push toward industrial decarbonization, which is reshaping production. For instance, a paper manufacturer might implement on-site satellite production of pcc, integrating it directly into its supply chain. This move not only reduces logistical costs and improves paper brightness but also provides a competitive advantage by aligning with corporate sustainability goals.
  • While this shift requires significant capital investment, it addresses the dual pressures of market demand for high-performance materials and the growing imperative for environmentally responsible manufacturing. The market's evolution is thus defined by this balance between cost-effective bulk applications and the strategic adoption of advanced, sustainable production technologies.

What will be the Size of the North America Calcium Carbonate Market during the forecast period?

Get Key Insights on Market Forecast (PDF) Get Free Sample

How is the North America Calcium Carbonate Market Segmented?

The north america calcium carbonate industry research report provides comprehensive data (region-wise segment analysis), with forecasts and estimates in "USD million" for the period 2026-2030, as well as historical data from 2020-2024 for the following segments.

  • Type
    • GCC
    • PCC
  • Application
    • Fillers
    • Pigments
    • Raw chemical materials
    • pH balancing agents
    • Dietary supplements
  • End-user
    • Construction
    • Paper and pulp
    • Plastics
    • Paints and coatings
    • Others
  • Geography
    • North America
      • US
      • Mexico
      • Canada

By Type Insights

The gcc segment is estimated to witness significant growth during the forecast period.

The calcium carbonate market in North America is primarily segmented by product type, with ground calcium carbonate (GCC) representing the foundational category.

Produced via a mechanical grinding process, GCC is favored for its cost-effectiveness as a functional filler and for material extension in high-volume industries. Its application in flue gas desulfurization and as a soil amendment highlights its role in environmental compliance.

Demand is driven by the need for sustainable raw materials that support circular economy principles and resource efficiency.

As industries seek comprehensive mineral solutions, GCC's utility in water treatment applications and as a key component in pH adjustment systems continues to expand, solidifying its importance across construction, agriculture, and environmental sectors, where it improves material rigidity by up to 25%.

Get Free Sample

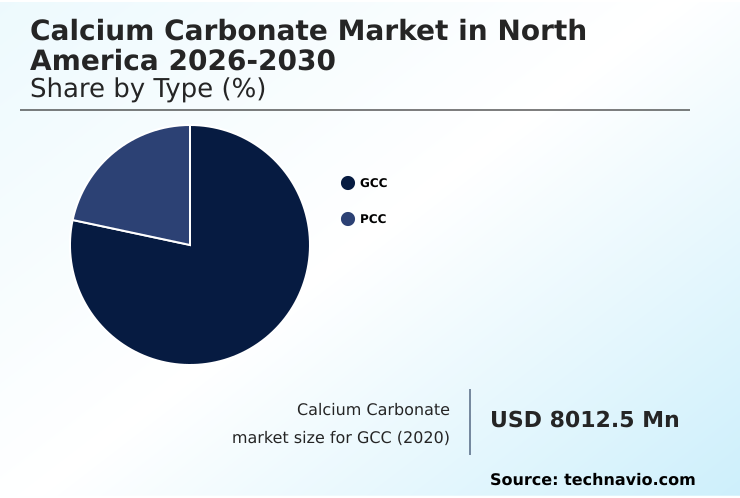
The GCC segment was valued at USD 10.25 billion in 2024 and showed a gradual increase during the forecast period.

Get Free Sample

Market Dynamics

Our researchers analyzed the data with 2025 as the base year, along with the key drivers, trends, and challenges. A holistic analysis of drivers will help companies refine their marketing strategies to gain a competitive advantage.

  • The application of precipitated calcium carbonate in paper production continues to evolve, with an emphasis on improving opacity in paper with mineral fillers. Simultaneously, the use of ground calcium carbonate for plastic composites is expanding, driven by the need for lightweighting automotive parts through advanced mineral fillers.
  • A significant development is the focus on carbon neutral mineral fillers applications, stemming from innovations in using ccu for calcium carbonate synthesis. This sustainable sourcing of industrial minerals is reshaping the industry's approach to the calcium carbonate role in circular economy.
  • In coatings, ultra-fine calcium carbonate in coatings enhances finish and durability, while surface-treated calcium carbonate for pvc improves processing and final product quality. The use of calcium carbonate for flue gas desulfurization and as a pH balancing agent in industrial minerals in water treatment processes highlights its environmental utility.
  • The impact of mineralogy on gcc performance remains a key research area to optimize particle size for polymer reinforcement. High-purity pcc for pharmaceuticals and specialty mineral additives for food fortification demonstrate the material's versatility. In construction, limestone aggregates in construction materials and calcium carbonate in sealants and adhesives are foundational.
  • Facilities adopting such integrated processes report operational uptimes more than 15% higher than those with traditional supply chains.

What are the key market drivers leading to the rise in the adoption of North America Calcium Carbonate Industry?

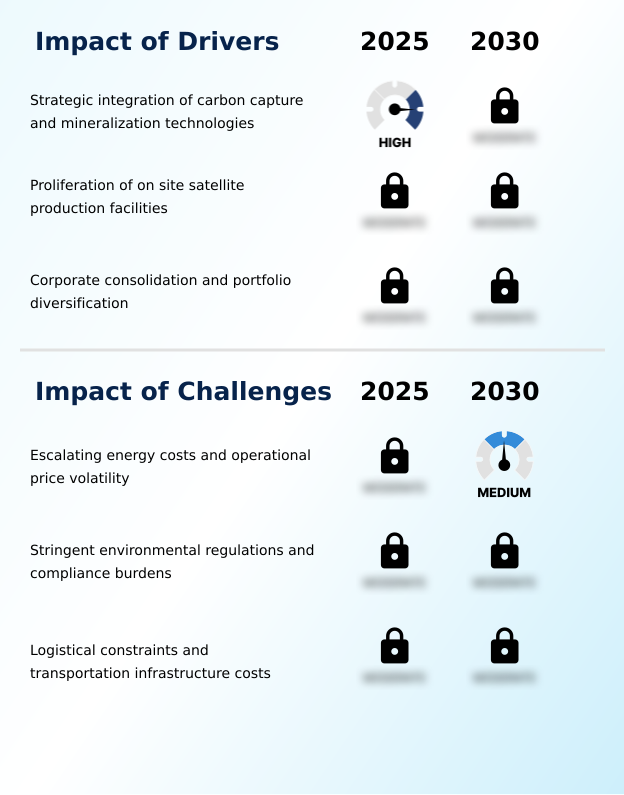
  • The strategic integration of carbon capture and mineralization technologies stands as a key driver propelling market expansion.

  • The adoption of green chemical manufacturing is a major driver, utilizing chemical carbonation of high-purity limestone to produce high-purity calcium carbonate.
  • This creates carbon-neutral precipitated calcium carbonate, which serves as a high-performance industrial mineral and pigment extender, improving product weatherability and impact resistance.
  • A significant push toward supply chain resilience is accelerating the adoption of a localized manufacturing approach, with on-site plants reducing mineral slurry transport costs by up to 90%. This strategy, coupled with investments in value-added processing, enhances regional capabilities.
  • These integrated models not only lower operational expenses but also improve material consistency, with some facilities reporting a 10% reduction in production line defects.

What are the market trends shaping the North America Calcium Carbonate Industry?

  • The strategic integration of carbon capture and mineralization technologies is emerging as a significant market trend. This shift is redefining production methods and sustainability standards within the industry.

  • A primary trend is the shift toward mineral synthesis via carbon capture and utilization, creating carbon neutral minerals and advancing industrial decarbonization. This approach produces high-purity precipitated calcium carbonate, with innovations in particle engineering enhancing its performance and optical properties.
  • The adoption of on-site satellite production, which improves operational agility and has been shown to reduce logistics-related emissions by 35%, reflects a move toward strategic resource management. This localization, coupled with advanced processing technologies, meets the rising demand for eco-friendly materials.
  • As sustainable procurement becomes standard, these trends are reshaping supply chains, with digitally monitored systems increasing grade consistency by over 20%.

What challenges does the North America Calcium Carbonate Industry face during its growth?

  • Escalating energy costs and operational price volatility present a key challenge affecting the industry's growth trajectory.

  • A key challenge involves the high energy costs of the chemical precipitation process and mechanical grinding for producing materials used in polymer composites and for mechanical reinforcement. Volatile energy prices can cause production costs to fluctuate by 15-20%, pressuring margins. While specialized mineral reagents and nanotechnology offer technical differentiation, scaling these requires significant capital.
  • The industry also faces the need to invest in low-emission technologies and emissions management to meet stricter regulations. Integrating carbon-negative fillers, excipients, and firming agents into products like joint compounds presents logistical hurdles, as transportation can add up to 30% to the final material cost, complicating supply chain economics.

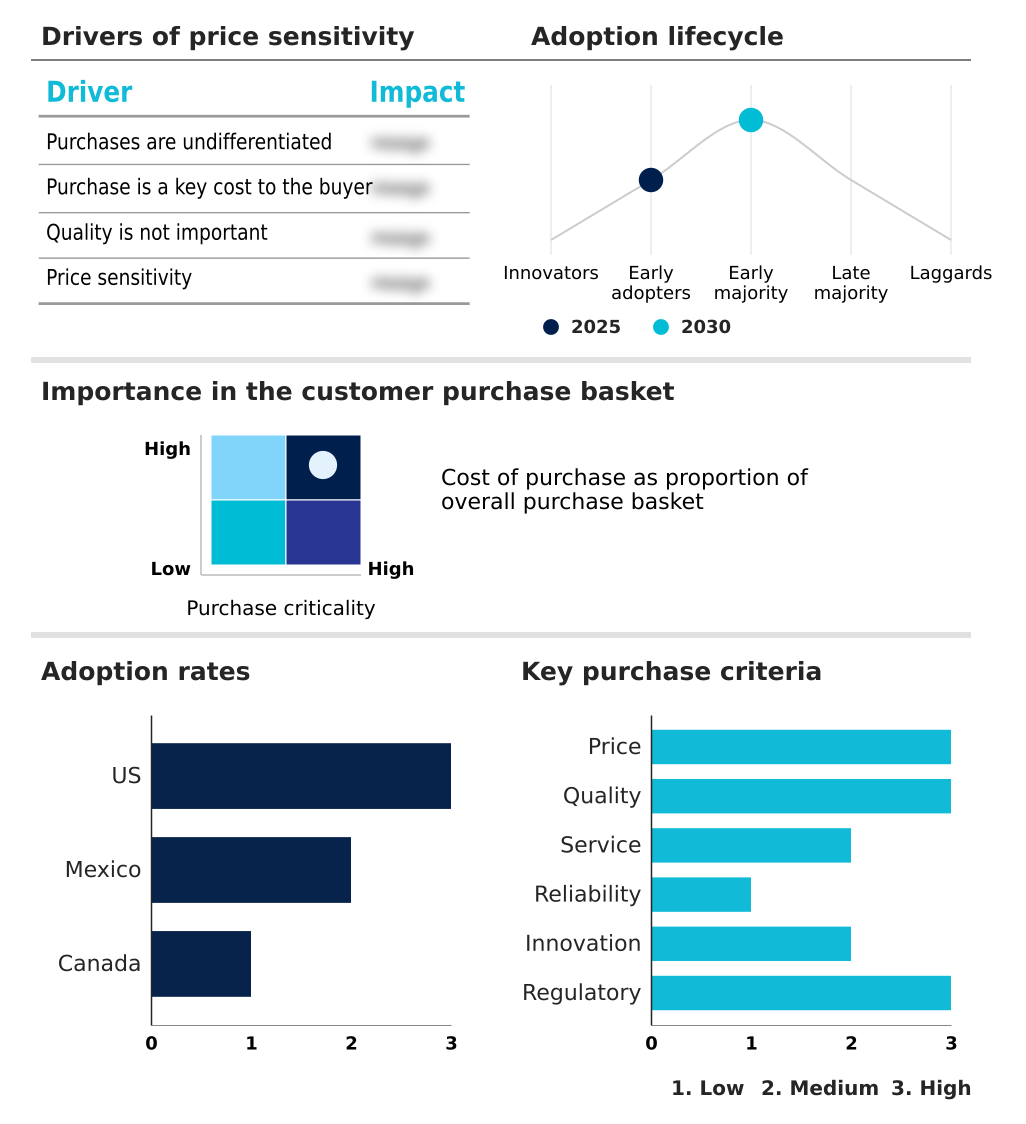
Exclusive Technavio Analysis on Customer Landscape

The north america calcium carbonate market forecasting report includes the adoption lifecycle of the market, covering from the innovator’s stage to the laggard’s stage. It focuses on adoption rates in different regions based on penetration. Furthermore, the north america calcium carbonate market report also includes key purchase criteria and drivers of price sensitivity to help companies evaluate and develop their market growth analysis strategies.

Customer Landscape of North America Calcium Carbonate Industry

Competitive Landscape

Companies are implementing various strategies, such as strategic alliances, north america calcium carbonate market forecast, partnerships, mergers and acquisitions, geographical expansion, and product/service launches, to enhance their presence in the industry.

AGSCO Corp. - Offerings center on industrial minerals, primarily calcium carbonate-based fillers and pigments, engineered for diverse manufacturing and polymer applications.

The industry research and growth report includes detailed analyses of the competitive landscape of the market and information about key companies, including:

  • AGSCO Corp.
  • Arkema Group
  • Carmeuse SA
  • Chemi Enterprises LLP
  • Covia Holdings LLC
  • GLC Minerals
  • Graymont Ltd.
  • Holcim Ltd.
  • Imerys S.A.
  • J M Huber Corp.
  • Kishida Chemical Co. Ltd.
  • Lhoist SA
  • Mccarthy Bush Corp.
  • Minerals Technologies Inc.
  • Mississippi Lime Co.
  • Omya International AG
  • Pete Lien and Sons Inc.
  • SCR Sibelco NV
  • Solvay SA
  • Tan Ky Mineral JSC

Qualitative and quantitative analysis of companies has been conducted to help clients understand the wider business environment as well as the strengths and weaknesses of key industry players. Data is qualitatively analyzed to categorize companies as pure play, category-focused, industry-focused, and diversified; it is quantitatively analyzed to categorize companies as dominant, leading, strong, tentative, and weak.

Recent Development and News in North america calcium carbonate market

  • In February 2025, Domtar, in a strategic collaboration with Omya AG, successfully established an on-site PCC plant at its Nekoosa mill in Wisconsin to ensure a reliable and cost-effective supply of essential raw materials.
  • In February 2025, CarbonFree introduced EnduroCal, a zero-carbon precipitated calcium carbonate alternative designed to help manufacturers reduce Scope 3 emissions.
  • In October 2024, Mississippi Lime Co. completed the acquisition of Burnett, Inc., a move that significantly expanded its mineral solutions platform and operational presence in the Southeast United States.
  • In November 2024, CarbonFree initiated the commercial-scale operation of its SkyCycle technology at a major steel facility in Gary, Indiana, to mineralize flue gas emissions into carbon-neutral precipitated calcium carbonate.

Dive into Technavio’s robust research methodology, blending expert interviews, extensive data synthesis, and validated models for unparalleled North America Calcium Carbonate Market insights. See full methodology.

Market Scope
Page number 214
Base year 2025
Historic period 2020-2024
Forecast period 2026-2030
Growth momentum & CAGR Accelerate at a CAGR of 7.5%
Market growth 2026-2030 USD 6046.3 million
Market structure Fragmented
YoY growth 2025-2026(%) 7.0%
Key countries US, Mexico and Canada
Competitive landscape Leading Companies, Market Positioning of Companies, Competitive Strategies, and Industry Risks

Request Free Sample

Research Analyst Overview

  • The calcium carbonate market in North America is transitioning from a commodity-centric model to one emphasizing high-value, specialized materials. The proliferation of carbon capture and utilization is a critical factor, enabling the production of carbon-neutral minerals and advancing industrial decarbonization.
  • This shift requires significant boardroom-level decisions regarding capital allocation: whether to invest in proprietary chemical precipitation process technology or acquire firms with existing capabilities in particle engineering and surface-treated grades. Innovations in mechanical grinding processes are yielding ultra-fine ground calcium carbonate with superior rheological properties, essential for advanced polymer composites.
  • Producers are focusing on creating functional fillers and specialty mineral additives that offer enhanced mechanical reinforcement, thermal conductivity, and impact resistance. Investments in advanced grinding technology have yielded a 15% improvement in particle size consistency, enabling the development of sophisticated mineral solutions for applications ranging from pigment extenders to non-toxic excipients, demonstrating a clear move toward technical differentiation.

What are the Key Data Covered in this North America Calcium Carbonate Market Research and Growth Report?

  • What is the expected growth of the North America Calcium Carbonate Market between 2026 and 2030?

    • USD 6.05 billion, at a CAGR of 7.5%

  • What segmentation does the market report cover?

    • The report is segmented by Type (GCC, and PCC), Application (Fillers, Pigments, Raw chemical materials, pH balancing agents, and Dietary supplements), End-user (Construction, Paper and pulp, Plastics, Paints and coatings, and Others) and Geography (North America)

  • Which regions are analyzed in the report?

    • North America

  • What are the key growth drivers and market challenges?

    • Strategic integration of carbon capture and mineralization technologies, Escalating energy costs and operational price volatility

  • Who are the major players in the North America Calcium Carbonate Market?

    • AGSCO Corp., Arkema Group, Carmeuse SA, Chemi Enterprises LLP, Covia Holdings LLC, GLC Minerals, Graymont Ltd., Holcim Ltd., Imerys S.A., J M Huber Corp., Kishida Chemical Co. Ltd., Lhoist SA, Mccarthy Bush Corp., Minerals Technologies Inc., Mississippi Lime Co., Omya International AG, Pete Lien and Sons Inc., SCR Sibelco NV, Solvay SA and Tan Ky Mineral JSC

Market Research Insights

  • Market dynamics are increasingly influenced by a strategic pivot toward supply chain optimization and decarbonization. The proliferation of on-site satellite production models, which can reduce material waste by over 10%, exemplifies a wider push for operational agility and supply chain resilience.
  • This shift aligns with corporate consolidation trends, where acquisitions have enabled top players to increase regional service coverage by an average of 5%. Furthermore, investments in green chemical manufacturing and advanced processing technologies underscore a commitment to enhancing environmental credentials.
  • These efforts are not just about compliance but are central to creating value-added processing capabilities that meet the demand for eco-friendly materials and support industrial reshoring initiatives.

We can help! Our analysts can customize this north america calcium carbonate market research report to meet your requirements.

Get in touch

1. Executive Summary

1.1 Market overview

Executive Summary - Chart on Market Overview
Executive Summary - Data Table on Market Overview
Executive Summary - Chart on Country Market Characteristics
Executive Summary - Chart on Market by Geography
Executive Summary - Chart on Market Segmentation by Type
Executive Summary - Chart on Market Segmentation by Application
Executive Summary - Chart on Market Segmentation by End-user
Executive Summary - Chart on Incremental Growth
Executive Summary - Data Table on Incremental Growth
Executive Summary - Chart on Company Market Positioning

2. Technavio Analysis

2.1 Analysis of price sensitivity, lifecycle, customer purchase basket, adoption rates, and purchase criteria

2.2 Criticality of inputs and Factors of differentiation

Overview on criticality of inputs and factors of differentiation

2.3 Factors of disruption

Overview on factors of disruption

2.4 Impact of drivers and challenges

Impact of drivers and challenges in 2025 and 2030

3. Market Landscape

3.1 Market ecosystem

Chart on Parent Market
Data Table on - Parent Market

3.2 Market characteristics

Chart on Market characteristics analysis

3.3 Value chain analysis

Chart on Value chain analysis

4. Market Sizing

4.1 Market definition

Data Table on Offerings of companies included in the market definition

4.2 Market segment analysis

Market segments

4.3 Market size 2025

4.4 Market outlook: Forecast for 2025-2030

Chart on North America - Market size and forecast 2025-2030 ($ million)
Data Table on Regional - Market size and forecast 2025-2030 ($ million)
Chart on North America: Year-over-year growth 2025-2030 (%)
Data Table on Regional - Market size and forecast 2025-2030 ($ million)

5. Historic Market Size

5.1 Calcium Carbonate Market in North America 2020 - 2024

Historic Market Size - Data Table on Calcium Carbonate Market in North America 2020 - 2024 ($ million)

5.2 Type segment analysis 2020 - 2024

Historic Market Size - Type Segment 2020 - 2024 ($ million)

5.3 Application segment analysis 2020 - 2024

Historic Market Size - Application Segment 2020 - 2024 ($ million)

5.4 End-user segment analysis 2020 - 2024

Historic Market Size - End-user Segment 2020 - 2024 ($ million)

5.5 Geography segment analysis 2020 - 2024

Historic Market Size - Geography Segment 2020 - 2024 ($ million)

6. Qualitative Analysis

6.1 Impact of AI on calcium carbonate market in North America

6.2 Impact of geopolitical conflict on calcium carbonate market in North America

7. Five Forces Analysis

7.1 Five forces summary

Five forces analysis - Comparison between 2025 and 2030

7.2 Bargaining power of buyers

Bargaining power of buyers - Impact of key factors 2025 and 2030

7.3 Bargaining power of suppliers

Bargaining power of suppliers - Impact of key factors in 2025 and 2030

7.4 Threat of new entrants

Threat of new entrants - Impact of key factors in 2025 and 2030

7.5 Threat of substitutes

Threat of substitutes - Impact of key factors in 2025 and 2030

7.6 Threat of rivalry

Threat of rivalry - Impact of key factors in 2025 and 2030

7.7 Market condition

Chart on Market condition - Five forces 2025 and 2030

8. Market Segmentation by Type

8.1 Market segments

Chart on Type - Market share 2025-2030 (%)
Data Table on Type - Market share 2025-2030 (%)

8.2 Comparison by Type

Chart on Comparison by Type
Data Table on Comparison by Type

8.3 GCC - Market size and forecast 2025-2030

Chart on GCC - Market size and forecast 2025-2030 ($ million)
Data Table on GCC - Market size and forecast 2025-2030 ($ million)
Chart on GCC - Year-over-year growth 2025-2030 (%)
Data Table on GCC - Year-over-year growth 2025-2030 (%)

8.4 PCC - Market size and forecast 2025-2030

Chart on PCC - Market size and forecast 2025-2030 ($ million)
Data Table on PCC - Market size and forecast 2025-2030 ($ million)
Chart on PCC - Year-over-year growth 2025-2030 (%)
Data Table on PCC - Year-over-year growth 2025-2030 (%)

8.5 Market opportunity by Type

Market opportunity by Type ($ million)
Data Table on Market opportunity by Type ($ million)

9. Market Segmentation by Application

9.1 Market segments

Chart on Application - Market share 2025-2030 (%)
Data Table on Application - Market share 2025-2030 (%)

9.2 Comparison by Application

Chart on Comparison by Application
Data Table on Comparison by Application

9.3 Fillers - Market size and forecast 2025-2030

Chart on Fillers - Market size and forecast 2025-2030 ($ million)
Data Table on Fillers - Market size and forecast 2025-2030 ($ million)
Chart on Fillers - Year-over-year growth 2025-2030 (%)
Data Table on Fillers - Year-over-year growth 2025-2030 (%)

9.4 Pigments - Market size and forecast 2025-2030

Chart on Pigments - Market size and forecast 2025-2030 ($ million)
Data Table on Pigments - Market size and forecast 2025-2030 ($ million)
Chart on Pigments - Year-over-year growth 2025-2030 (%)
Data Table on Pigments - Year-over-year growth 2025-2030 (%)

9.5 Raw chemical materials - Market size and forecast 2025-2030

Chart on Raw chemical materials - Market size and forecast 2025-2030 ($ million)
Data Table on Raw chemical materials - Market size and forecast 2025-2030 ($ million)
Chart on Raw chemical materials - Year-over-year growth 2025-2030 (%)
Data Table on Raw chemical materials - Year-over-year growth 2025-2030 (%)

9.6 pH balancing agents - Market size and forecast 2025-2030

Chart on pH balancing agents - Market size and forecast 2025-2030 ($ million)
Data Table on pH balancing agents - Market size and forecast 2025-2030 ($ million)
Chart on pH balancing agents - Year-over-year growth 2025-2030 (%)
Data Table on pH balancing agents - Year-over-year growth 2025-2030 (%)

9.7 Dietary supplements - Market size and forecast 2025-2030

Chart on Dietary supplements - Market size and forecast 2025-2030 ($ million)
Data Table on Dietary supplements - Market size and forecast 2025-2030 ($ million)
Chart on Dietary supplements - Year-over-year growth 2025-2030 (%)
Data Table on Dietary supplements - Year-over-year growth 2025-2030 (%)

9.8 Market opportunity by Application

Market opportunity by Application ($ million)
Data Table on Market opportunity by Application ($ million)

10. Market Segmentation by End-user

10.1 Market segments

Chart on End-user - Market share 2025-2030 (%)
Data Table on End-user - Market share 2025-2030 (%)

10.2 Comparison by End-user

Chart on Comparison by End-user
Data Table on Comparison by End-user

10.3 Construction - Market size and forecast 2025-2030

Chart on Construction - Market size and forecast 2025-2030 ($ million)
Data Table on Construction - Market size and forecast 2025-2030 ($ million)
Chart on Construction - Year-over-year growth 2025-2030 (%)
Data Table on Construction - Year-over-year growth 2025-2030 (%)

10.4 Paper and pulp - Market size and forecast 2025-2030

Chart on Paper and pulp - Market size and forecast 2025-2030 ($ million)
Data Table on Paper and pulp - Market size and forecast 2025-2030 ($ million)
Chart on Paper and pulp - Year-over-year growth 2025-2030 (%)
Data Table on Paper and pulp - Year-over-year growth 2025-2030 (%)

10.5 Plastics - Market size and forecast 2025-2030

Chart on Plastics - Market size and forecast 2025-2030 ($ million)
Data Table on Plastics - Market size and forecast 2025-2030 ($ million)
Chart on Plastics - Year-over-year growth 2025-2030 (%)
Data Table on Plastics - Year-over-year growth 2025-2030 (%)

10.6 Paints and coatings - Market size and forecast 2025-2030

Chart on Paints and coatings - Market size and forecast 2025-2030 ($ million)
Data Table on Paints and coatings - Market size and forecast 2025-2030 ($ million)
Chart on Paints and coatings - Year-over-year growth 2025-2030 (%)
Data Table on Paints and coatings - Year-over-year growth 2025-2030 (%)

10.7 Others - Market size and forecast 2025-2030

Chart on Others - Market size and forecast 2025-2030 ($ million)
Data Table on Others - Market size and forecast 2025-2030 ($ million)
Chart on Others - Year-over-year growth 2025-2030 (%)
Data Table on Others - Year-over-year growth 2025-2030 (%)

10.8 Market opportunity by End-user

Market opportunity by End-user ($ million)
Data Table on Market opportunity by End-user ($ million)

11. Customer Landscape

11.1 Customer landscape overview

Analysis of price sensitivity, lifecycle, customer purchase basket, adoption rates, and purchase criteria

12. Geographic Landscape

12.1 Geographic segmentation

Chart on Market share by geography - 2025-2030 (%)
Data Table on Market share by geography - 2025-2030 (%)

12.2 Geographic comparison

Chart on Geographic comparison
Data Table on Geographic comparison

12.3 US - Market size and forecast 2025-2030

Chart on US - Market size and forecast 2025-2030 ($ million)
Data Table on US - Market size and forecast 2025-2030 ($ million)
Chart on US - Year-over-year growth 2025-2030 (%)
Data Table on US - Year-over-year growth 2025-2030 (%)

12.4 Mexico - Market size and forecast 2025-2030

Chart on Mexico - Market size and forecast 2025-2030 ($ million)
Data Table on Mexico - Market size and forecast 2025-2030 ($ million)
Chart on Mexico - Year-over-year growth 2025-2030 (%)
Data Table on Mexico - Year-over-year growth 2025-2030 (%)

12.5 Canada - Market size and forecast 2025-2030

Chart on Canada - Market size and forecast 2025-2030 ($ million)
Data Table on Canada - Market size and forecast 2025-2030 ($ million)
Chart on Canada - Year-over-year growth 2025-2030 (%)
Data Table on Canada - Year-over-year growth 2025-2030 (%)

12.6 Market opportunity by geography

Market opportunity by geography ($ million)
Data Table on Market opportunity by geography ($ million)

13. Drivers, Challenges, and Opportunity

13.1 Market drivers

Strategic integration of carbon capture and mineralization technologies
Proliferation of on site satellite production facilities
Corporate consolidation and portfolio diversification

13.2 Market challenges

Escalating energy costs and operational price volatility
Stringent environmental regulations and compliance burdens
Logistical constraints and transportation infrastructure costs

13.3 Impact of drivers and challenges

Impact of drivers and challenges in 2025 and 2030

13.4 Market opportunities

Strategic integration of carbon capture and mineralization technologies
Accelerated market consolidation and regional portfolio expansion
Structural optimization and digital transformation of industrial operations

14. Competitive Landscape

14.1 Overview

14.2

Overview on criticality of inputs and factors of differentiation

14.3 Landscape disruption

Overview on factors of disruption

14.4 Industry risks

Impact of key risks on business

15. Competitive Analysis

15.1 Companies profiled

Companies covered

15.2 Company ranking index

15.3 Market positioning of companies

Matrix on companies position and classification

15.4 AGSCO Corp.

AGSCO Corp. - Overview
AGSCO Corp. - Product / Service
AGSCO Corp. - Key offerings
SWOT

15.5 Arkema Group

Arkema Group - Overview
Arkema Group - Business segments
Arkema Group - Key offerings
Arkema Group - Segment focus
SWOT

15.6 Carmeuse SA

Carmeuse SA - Overview
Carmeuse SA - Product / Service
Carmeuse SA - Key offerings
SWOT

15.7 Covia Holdings LLC

Covia Holdings LLC - Overview
Covia Holdings LLC - Product / Service
Covia Holdings LLC - Key offerings
SWOT

15.8 GLC Minerals

GLC Minerals - Overview
GLC Minerals - Product / Service
GLC Minerals - Key offerings
SWOT

15.9 Graymont Ltd.

Graymont Ltd. - Overview
Graymont Ltd. - Product / Service
Graymont Ltd. - Key offerings
SWOT

15.10 Holcim Ltd.

Holcim Ltd. - Overview
Holcim Ltd. - Business segments
Holcim Ltd. - Key news
Holcim Ltd. - Key offerings
Holcim Ltd. - Segment focus
SWOT

15.11 Imerys S.A.

Imerys S.A. - Overview
Imerys S.A. - Business segments
Imerys S.A. - Key news
Imerys S.A. - Key offerings
Imerys S.A. - Segment focus
SWOT

15.12 J M Huber Corp.

J M Huber Corp. - Overview
J M Huber Corp. - Product / Service
J M Huber Corp. - Key offerings
SWOT

15.13 Lhoist SA

Lhoist SA - Overview
Lhoist SA - Product / Service
Lhoist SA - Key offerings
SWOT

15.14 Minerals Technologies Inc.

Minerals Technologies Inc. - Overview
Minerals Technologies Inc. - Business segments
Minerals Technologies Inc. - Key offerings
Minerals Technologies Inc. - Segment focus
SWOT

15.15 Mississippi Lime Co.

Mississippi Lime Co. - Overview
Mississippi Lime Co. - Product / Service
Mississippi Lime Co. - Key offerings
SWOT

15.16 Omya International AG

Omya International AG - Overview
Omya International AG - Product / Service
Omya International AG - Key offerings
SWOT

15.17 SCR Sibelco NV

SCR Sibelco NV - Overview
SCR Sibelco NV - Product / Service
SCR Sibelco NV - Key offerings
SWOT

15.18 Solvay SA

Solvay SA - Overview
Solvay SA - Business segments
Solvay SA - Key offerings
Solvay SA - Segment focus
SWOT

16. Appendix

16.1 Scope of the report

Market definition
Objectives
Notes and caveats

16.2 Inclusions and exclusions checklist

Inclusions checklist
Exclusions checklist

16.3 Currency conversion rates for US$

16.4 Research methodology

16.5 Data procurement

Information sources

16.6 Data validation

16.7 Validation techniques employed for market sizing

16.8 Data synthesis

16.9 360 degree market analysis

16.10 List of abbreviations

Research Methodology

Technavio presents a detailed picture of the market by way of study, synthesis, and summation of data from multiple sources. The analysts have presented the various facets of the market with a particular focus on identifying the key industry influencers. The data thus presented is comprehensive, reliable, and the result of extensive research, both primary and secondary.

INFORMATION SOURCES

Primary sources

  • Manufacturers and suppliers
  • Channel partners
  • Industry experts
  • Strategic decision makers

Secondary sources

  • Industry journals and periodicals
  • Government data
  • Financial reports of key industry players
  • Historical data
  • Press releases

DATA ANALYSIS

Data Synthesis

  • Collation of data
  • Estimation of key figures
  • Analysis of derived insights

Data Validation

  • Triangulation with data models
  • Reference against proprietary databases
  • Corroboration with industry experts

REPORT WRITING

Qualitative

  • Market drivers
  • Market challenges
  • Market trends
  • Five forces analysis

Quantitative

  • Market size and forecast
  • Market segmentation
  • Geographical insights
  • Competitive landscape

Interested in this report?

Get your sample now to see our research methodology and insights!

Download Now

Frequently Asked Questions

North America Calcium Carbonate market growth will increase by USD 6046.3 million during 2026-2030.

The North America Calcium Carbonate market is expected to grow at a CAGR of 7.5% during 2026-2030.

North America Calcium Carbonate market is segmented by Type (GCC, PCC) Application (Fillers, Pigments, Raw chemical materials, pH balancing agents, Dietary supplements) End-user (Construction, Paper and pulp, Plastics, Paints and coatings, Others)

AGSCO Corp., Arkema Group, Carmeuse SA, Chemi Enterprises LLP, Covia Holdings LLC, GLC Minerals, Graymont Ltd., Holcim Ltd., Imerys S.A., J M Huber Corp., Kishida Chemical Co. Ltd., Lhoist SA, Mccarthy Bush Corp., Minerals Technologies Inc., Mississippi Lime Co., Omya International AG, Pete Lien and Sons Inc., SCR Sibelco NV, Solvay SA, Tan Ky Mineral JSC are a few of the key vendors in the North America Calcium Carbonate market.

North America will register the highest growth rate of 100% among the other regions. Therefore, the North America Calcium Carbonate market in North America is expected to garner significant business opportunities for the vendors during the forecast period.

US, Mexico, Canada

  • Strategic integration of carbon capture and mineralization technologies is the driving factor this market.

The North America Calcium Carbonate market vendors should focus on grabbing business opportunities from the Type segment as it accounted for the largest market share in the base year.
RIA - Research AI Assistant
Ask RIA