Canned Chicken Market Size 2024-2028
The canned chicken market size is forecast to increase by USD 1.32 billion at a CAGR of 7.3% between 2023 and 2028. The market is experiencing significant growth due to several key factors. One major trend is the increasing demand for convenient and quick meal solutions, with dishes like Chicken Fried Rice and Colorful Vegetables with Cooked Rice becoming popular choices. The use of soy sauce and fresh vegetables in these dishes adds to the appeal, providing a balanced meal with lean protein and essential nutrients. However, the market also faces challenges, including the controversial subject of highly processed foods and their impact on health. Canned chicken roducts are ideal for quick and easy meal preparations, such as Easy Chicken Carbonara, a popular spaghetti dish made with cooked bacon, eggs, cream, and rich garlic sauce. New product launches continue to drive market growth, with companies introducing innovative canned chicken varieties to cater to diverse consumer preferences.
What will the size of the market be during the forecast period?
The market has been witnessing significant growth due to the increasing demand for quick and easy meal options. Canned chicken is a versatile and convenient protein source that caters to various meal preferences, including family lunches and dinners. Canned chicken offers several advantages over fresh and frozen chicken. Its long shelf life makes it an ideal choice for consumers seeking a pantry staple. Moreover, canned chicken retains its moisture and flavor, ensuring a delicious taste even after prolonged storage. Both dark meat and light meat varieties are available in the market, catering to individual preferences and budgets. The demand for canned chicken is driven by its role in creating quick and easy meals. For instance, it is extensively used in pasta salads, green salads, and other dishes that require shredded or cubed chicken. Canned chicken breast meat is an excellent alternative to fresh or cooked chicken for recipes like easy chicken carbonara, spaghetti dishes, and chicken fried rice. The versatility of canned chicken extends beyond main dishes. It is also used as an ingredient in various recipes, such as soups, stews, and casseroles. Furthermore, canned chicken is an affordable protein option for households, making it a popular choice for budget-conscious consumers.
Further, canned chicken's convenience factor is a significant draw for consumers. It eliminates the need for meal planning and grocery store trips for fresh chicken. Additionally, it reduces food waste as consumers only use the required amount for their recipes, minimizing the chances of spoilage. The market is expected to continue its growth trajectory due to the increasing trend of busy lifestyles and the need for convenient meal solutions. The market is also witnessing innovation, with new product offerings such as packaged chicken strips and value-added products like cooked bacon and eggs, which can be easily integrated into various dishes. In conclusion, the market in the United States is poised for growth due to its convenience, versatility, and affordability. As consumers continue to seek quick and easy meal solutions, canned chicken is expected to remain a popular choice for households.
Market Segmentation
The market research report provides comprehensive data (region-wise segment analysis), with forecasts and estimates in "USD million" for the period 2024-2028, as well as historical data from 2018-2022 for the following segments.
- Product Type
- Chicken breast
- Shredded chicken
- Chicken thigh
- Whole chicken
- Others
- Distribution Channel
- Offline
- Online
- Geography
- North America
- Canada
- US
- Europe
- Germany
- UK
- France
- Italy
- Spain
- APAC
- China
- Japan
- South America
- Middle East and Africa
- North America
By Product Type Insights
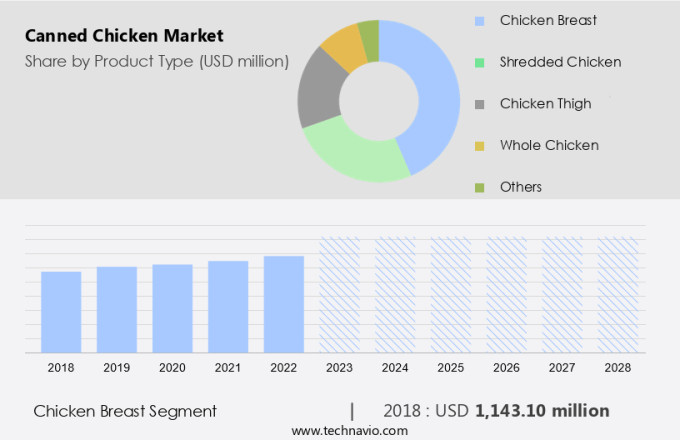
The chicken breast segment is estimated to witness significant growth during the forecast period. The market for canned chicken in the United States has witnessed a notable trend toward the consumption of boneless, skinless chicken breast. The preference for this particular cut can be attributed to several factors. First, its ease of preparation makes it a popular choice for busy households. Second, its versatility allows it to be incorporated into various dishes, catering to diverse culinary preferences. Lastly, consumers are increasingly conscious of their health and are seeking nutritious food options. Boneless, skinless chicken breast is a rich source of essential nutrients such as Vitamin E, Beta-carotene, and Omega-3 fatty acids. Despite its popularity, the production of canned chicken has been a subject of controversy due to concerns over factory farming, inhumane conditions, and the use of antibiotics. Industrial chicken farming practices have raised concerns about the health and welfare of the animals, as well as the potential for antibiotic resistance.
However, efforts are being made to address these issues, with some manufacturers focusing on more humane and sustainable farming practices. In conclusion, the market in the United States is witnessing a shift towards the consumption of boneless, skinless chicken breast, driven by its versatility, convenience, and nutritional benefits. While concerns over factory farming and antibiotic use persist, consumers can make informed choices by opting for products from reputable manufacturers committed to ethical and sustainable farming practices.
Get a glance at the market share of various segments Request Free Sample
The chicken breast segment accounted for USD 1.14 billion in 2018 and showed a gradual increase during the forecast period.
Regional Insights
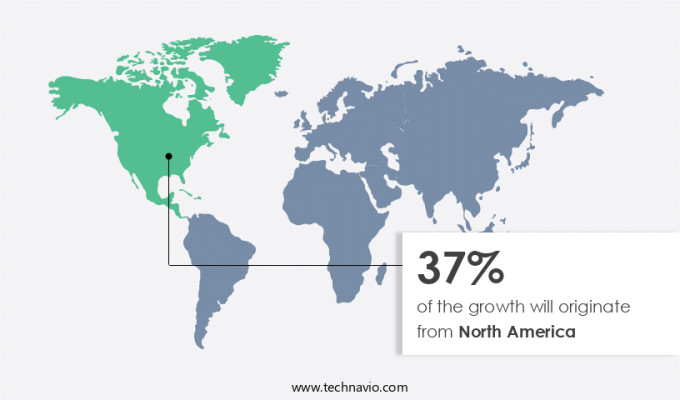
North America is estimated to contribute 37% to the growth of the global market during the forecast period. Technavio's analysts have elaborately explained the regional trends and drivers that shape the market during the forecast period.
For more insights on the market share of various regions Request Free Sample
The market in North America, with a particular focus on the United States, is witnessing notable growth due to the high demand for quick and convenient protein sources for family meals and dinners. Chicken, being an affordable and popular food item in the region, is consumed extensively, with the US accounting for approximately 15,000 metric tons of annual intake. This substantial consumption rate underscores chicken's significance in American diets. Canned chicken offers numerous applications, including in pasta salads, green salads, and other dishes, making it a versatile and preferred choice for many households. The affordability and long shelf life of canned chicken further add to its appeal.
Our researchers analyzed the data with 2023 as the base year, along with the key drivers, trends, and challenges. A holistic analysis of drivers will help companies refine their marketing strategies to gain a competitive advantage.
Market Driver
Convenience and shelf stability is the key driver of the market. The market in the US is fueled by two primary factors: convenience and durability. These aspects resonate strongly with American consumers who value ease of use and extended storage capabilities in their grocery purchases. Canned chicken boasts an impressive shelf life of up to five years, making it a dependable and long-lasting food solution. This longevity is particularly significant for online sales, as it instills confidence in consumers regarding the product's longevity and decreases the need for frequent repurchasing.
Furthermore, canned chicken's low fat and carbohydrate content, combined with high protein levels, make it a nutritious choice for health-conscious consumers. With its extended shelf life and nutritional benefits, canned chicken is a popular pantry staple in US households.
Market Trends
New product launches is the upcoming trend in the market. The market is experiencing a noteworthy transformation due to the emergence of innovative products catering to consumers' demands for convenience, health, and diversity. One such recent development is the introduction of Gants Chunky Chicken, a new line of value-added canned chicken breast products launched in July 2023. This launch signifies a significant advancement in the sector, especially for domestic manufacturers.
Consequently, these choices cater to various taste palates and serve as a nutritious and convenient meal solution. The canned chicken industry continues to evolve, offering consumers a wider range of options beyond traditional canned chicken. These products are ideal for creating dishes like Chicken Fried Rice with colorful vegetables and cooked rice, seasoned with soy sauce, adding a burst of flavor and nutrition to the meal.
Market Challenge
The bird flu crisis is a key challenge affecting the market growth. The poultry industry in the United States faces significant challenges due to the ongoing avian influenza outbreaks. Despite the popularity of dishes such as fried chicken, which enjoys an approval rating of 83%, the industry encounters hurdles in meeting demand. Avian influenza, or bird flu, can lead to substantial disruptions in poultry supply chains. When outbreaks occur, large numbers of birds may need to be culled to prevent the spread of the virus, resulting in decreased poultry availability. This shortage impacts not only fried chicken but also other poultry products, potentially leading to increased prices and potential shortages. For instance, consumers preparing Easy Chicken Carbonara or Spaghetti dishes with packaged chicken strips may find it difficult to source these ingredients.
Cooked bacon and eggs, key components of these dishes, are not affected in the same way, but the rich sauce made with cubed chicken or cream may become harder to come by. As a result, consumers may need to explore alternative ingredients or adjust their recipes to accommodate the changing market conditions. In summary, the avian influenza crisis poses a significant challenge to the poultry industry in the United States, affecting the availability and affordability of various poultry products, including cubed chicken and packaged chicken strips. This, in turn, impacts the preparation of popular dishes like Easy Chicken Carbonara and Spaghetti.
Exclusive Customer Landscape
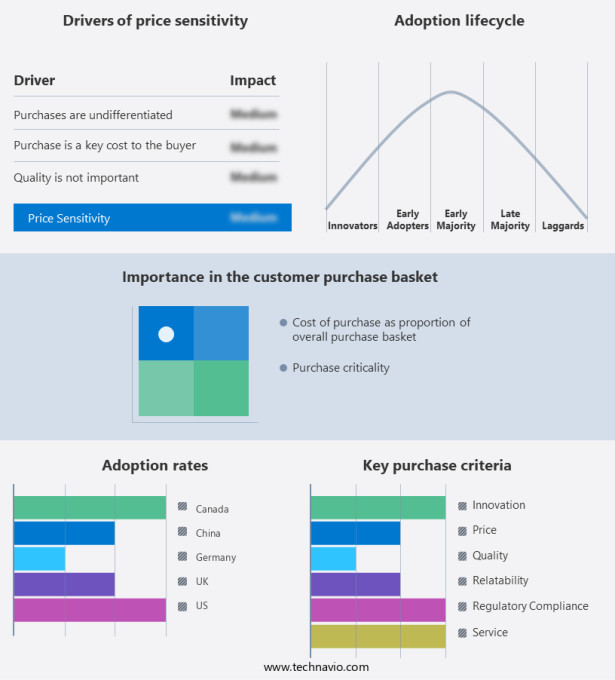
The market forecasting report includes the adoption lifecycle of the market, covering from the innovator's stage to the laggard's stage. It focuses on adoption rates in different regions based on penetration. Furthermore, the report also includes key purchase criteria and drivers of price sensitivity to help companies evaluate and develop their market growth analysis strategies.
Customer Landscape
Key Companies & Market Insights
Companies are implementing various strategies, such as strategic alliances, partnerships, mergers and acquisitions, geographical expansion, and product/service launches, to enhance their presence in the market.
Ayam Sarl - The company offers canned chicken such as Pulled Chicken Hot Chilli 150g, Pulled Chicken Black Pepper 150g, and others.
The market research and growth report includes detailed analyses of the competitive landscape of the market and information about key companies, including:
- Bumble Bee Foods LLC
- Campbell Soup Co.
- Century Pacific Food Inc.
- Crider Foods
- Danish Crown AS
- Groot Holland B.V.
- Hannaford Bros. Co. LLC
- Hormel Foods Corp.
- Keystone Meats
- LunchOne
- Raleys
- Robert Damkjaer AS
- SNS FOODS SP. Z O.O.
- Survival Frog
- Tyson Foods Inc.
- Wegmans Food Markets
- Werling and Sons Inc.
- Wild Planet Foods Inc.
Qualitative and quantitative analysis of companies has been conducted to help clients understand the wider business environment as well as the strengths and weaknesses of key market players. Data is qualitatively analyzed to categorize companies as pure play, category-focused, industry-focused, and diversified; it is quantitatively analyzed to categorize companies as dominant, leading, strong, tentative, and weak.
Research Analyst Overview
Canned chicken is a convenient and affordable solution for quick meals, ideal for family lunches and dinners. This nonperishable food item offers the benefits of protein-rich chicken in a form that does not require refrigeration. Both dark and light meat varieties are available in cans, providing flexibility for various dishes. Canned chicken's moisture retention ensures that it remains flavorful and tender, making it an excellent ingredient for pasta salads, green salads, and other dishes. Its versatility extends to recipes like chicken carbonara, spaghetti dishes, and chicken fried rice. Despite its advantages, canned chicken is a controversial subject for some due to concerns over its processing methods.
Further, industrial chicken production, factory farms, and inhumane conditions are criticized for the potential use of antibiotics and their impact on animal welfare. Nutrition-conscious consumers may also be concerned about the sodium content, harmful pathogens, and the canning process's effect on vitamin E, beta-carotene, and omega-3 fatty acids. Cooking canned chicken is simple, requiring minimal equipment and spices. However, it is essential to follow food safety guidelines, such as checking the expiration date and cooking temperature, to ensure food safety and prevent foodborne illnesses like food poisoning. Home canning is not recommended due to the potential risks associated with pressure canners and equipment safety.
|
Market Scope |
|
|
Report Coverage |
Details |
|
Page number |
212 |
|
Base year |
2023 |
|
Historic period |
2018-2022 |
|
Forecast period |
2024-2028 |
|
Growth momentum & CAGR |
Accelerate at a CAGR of 7.3% |
|
Market Growth 2024-2028 |
USD 1.32 billion |
|
Market structure |
Fragmented |
|
YoY growth 2023-2024(%) |
5.9 |
|
Regional analysis |
North America, Europe, APAC, South America, and Middle East and Africa |
|
Performing market contribution |
North America at 37% |
|
Key countries |
US, China, Canada, Germany, UK, Japan, France, Italy, Australia, and Spain |
|
Competitive landscape |
Leading Companies, Market Positioning of Companies, Competitive Strategies, and Industry Risks |
|
Key companies profiled |
Ayam Sarl, Bumble Bee Foods LLC, Campbell Soup Co., Century Pacific Food Inc., Crider Foods, Danish Crown AS, Groot Holland B.V., Hannaford Bros. Co. LLC, Hormel Foods Corp., Keystone Meats, LunchOne, Raleys, Robert Damkjaer AS, SNS FOODS SP. Z O.O., Survival Frog, Tyson Foods Inc., Wegmans Food Markets, Werling and Sons Inc., and Wild Planet Foods Inc. |
|
Market dynamics |
Parent market analysis, market growth inducers and obstacles, market forecast, fast-growing and slow-growing segment analysis, COVID-19 impact and recovery analysis and future consumer dynamics, market condition analysis for the forecast period |
|
Customization purview |
If our market report has not included the data that you are looking for, you can reach out to our analysts and get segments customized. |
What are the Key Data Covered in this Market Research and Growth Report?
- CAGR of the market during the forecast period
- Detailed information on factors that will drive the market growth and forecasting between 2024 and 2028
- Precise estimation of the size of the market and its contribution of the market in focus to the parent market
- Accurate predictions about upcoming market growth and trends and changes in consumer behaviour
- Growth of the market across North America, Europe, APAC, South America, and Middle East and Africa
- A thorough analysis of the market's competitive landscape and detailed information about companies
- Comprehensive analysis of factors that will challenge the growth of market companies
We can help! Our analysts can customize this market research report to meet your requirements. Get in touch


