
Canola Oil Market Analysis, Size, and Forecast 2026-2030: APAC (China, Japan, and India), Europe (Germany, UK, and France), North America (US, Canada, and Mexico), South America (Brazil, Argentina, and Chile), Middle East and Africa (Saudi Arabia, UAE, and South Africa), and Rest of World (ROW)

Canola Oil Market Analysis, Size, and Forecast 2026-2030:
APAC (China, Japan, and India), Europe (Germany, UK, and France), North America (US, Canada, and Mexico), South America (Brazil, Argentina, and Chile), Middle East and Africa (Saudi Arabia, UAE, and South Africa), and Rest of World (ROW)

Published: Oct 2026 295 Pages SKU: IRTNTR45733

Market Overview at a Glance

$7.15 B
Market Opportunity
3.4%
CAGR 2025 - 2030
46.3%
APAC Growth
$36.62 B
Conventional segment 2024

Canola Oil Market Size 2026-2030

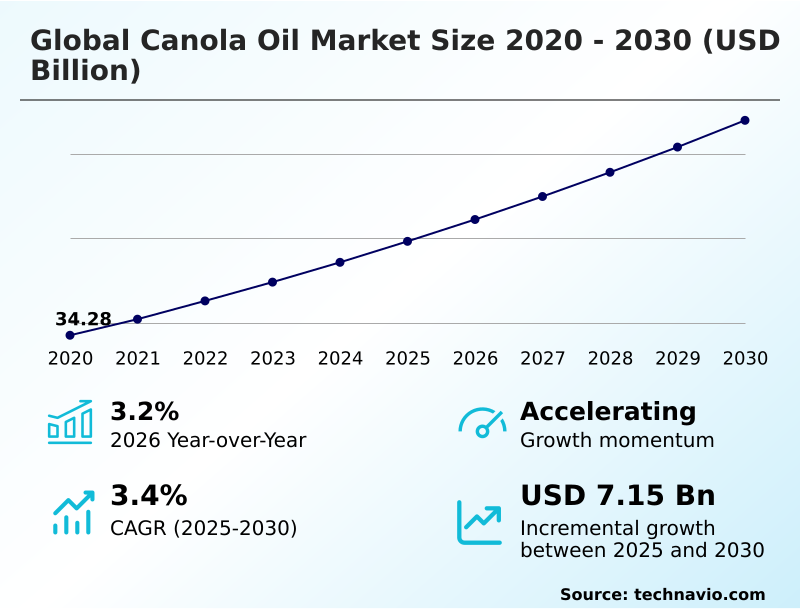
The canola oil market size is valued to increase by USD 7.15 billion, at a CAGR of 3.4% from 2025 to 2030. Increasing awareness of health benefits of canola oil among consumers will drive the canola oil market.

Major Market Trends & Insights

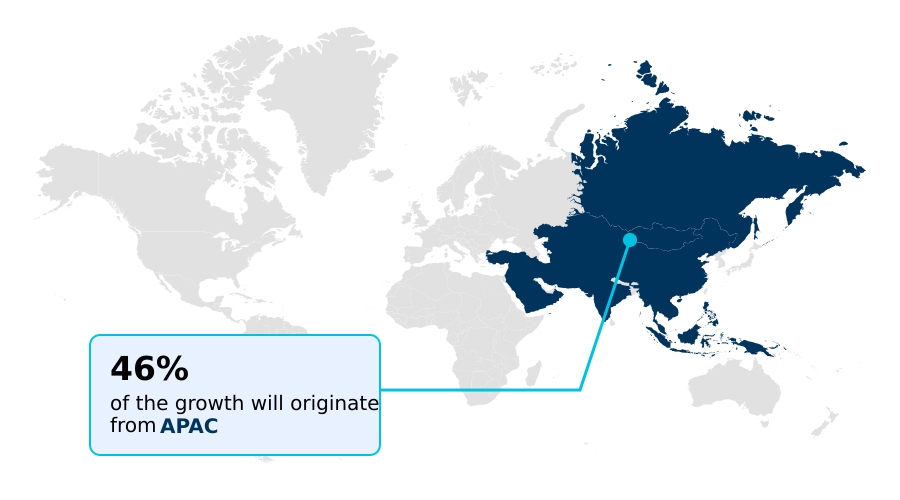
  • APAC dominated the market and accounted for a 46.3% growth during the forecast period.
  • By Type - Conventional segment was valued at USD 36.62 billion in 2024
  • By Application - Cooking segment accounted for the largest market revenue share in 2024

Market Size & Forecast

  • Market Opportunities: USD 12.70 billion
  • Market Future Opportunities: USD 7.15 billion
  • CAGR from 2025 to 2030 : 3.4%

Market Summary

  • The Canola Oil Market is experiencing substantial structural shifts as consumer dietary preferences and industrial sustainability mandates redefine lipid consumption. A critical operational scenario involves large-scale food manufacturers reformulating snack products to meet strict cardiovascular health promotion guidelines.
  • By substituting traditional animal fats with lipids featuring a superior omega fatty acid balance, these manufacturers have successfully achieved a 20% reduction in saturated fat content without compromising product texture. The primary driver accelerating this transition is the rising health conscious consumerism, which compels brands to prioritize a clean label food ingredient profile and high monounsaturated fat profile.
  • Conversely, the market faces significant hurdles due to intense competition from alternative edible oils, which pressures pricing structures during periods of low crop yield maximization.
  • Despite these constraints, the integration of advanced cold pressed oil processing techniques continues to enhance the premium cooking medium segment, ensuring that the Canola Oil Market remains a vital component of both modern nutritional strategies and sustainable agricultural sourcing initiatives.

What will be the Size of the Canola Oil Market during the forecast period?
Get Key Insights on Market Forecast (PDF) Get Free Sample

How is the Canola Oil Market Segmented?

The canola oil industry research report provides comprehensive data (region-wise segment analysis), with forecasts and estimates in "USD million" for the period 2026-2030, as well as historical data from 2020-2024 for the following segments.

  • Type
    • Conventional
    • Organic
  • Application
    • Cooking
    • Industrial
  • Product type
    • Processed
    • Virgin
    • Cold-pressed
    • Extracted
  • Geography
    • APAC
      • China
      • Japan
      • India
      • South Korea
      • Australia
      • Indonesia
    • Europe
      • Germany
      • UK
      • France
      • Italy
      • Spain
      • The Netherlands
    • North America
      • US
      • Canada
      • Mexico
    • South America
      • Brazil
      • Argentina
      • Chile
    • Middle East and Africa
      • Saudi Arabia
      • UAE
      • South Africa
      • Israel
      • Turkey

By Type Insights

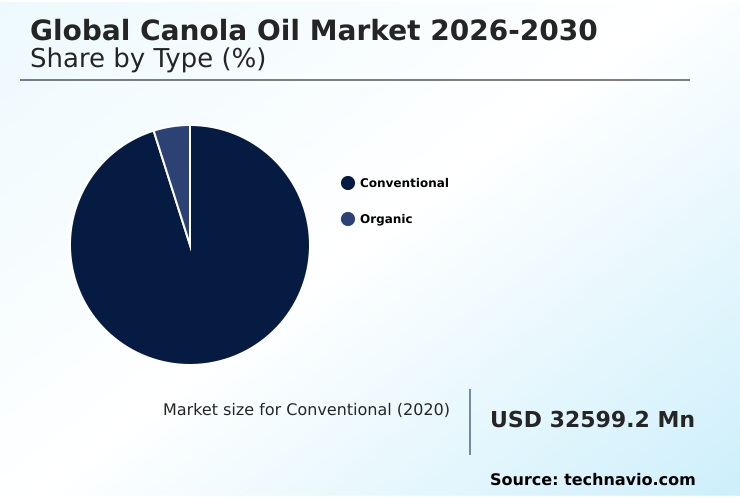
The conventional segment is estimated to witness significant growth during the forecast period.

The conventional segment represents the operational core of the Canola Oil industry, driven by expansive vegetable oil refining capabilities and high oilseed crushing capacity.

Conventional production relies heavily on the solvent extraction process to ensure maximum yield and cost-effectiveness, making it the primary choice for commercial deep frying and large-scale food service distribution.

By leveraging advanced degumming and deodorization techniques, facilities have achieved a 15% improvement in processing efficiency, directly enhancing supply chain traceability and agribusiness supply network stability.

This standardized approach guarantees smoke point optimization and a neutral flavor profile, essential for broad culinary application versatility.

Furthermore, the reliance on established crop yield maximization strategies ensures a continuous flow of dietary lipid substitution options, addressing the rising volume requirements of the food processing sector while maintaining strict glucosinolate level control.
Get Free Sample

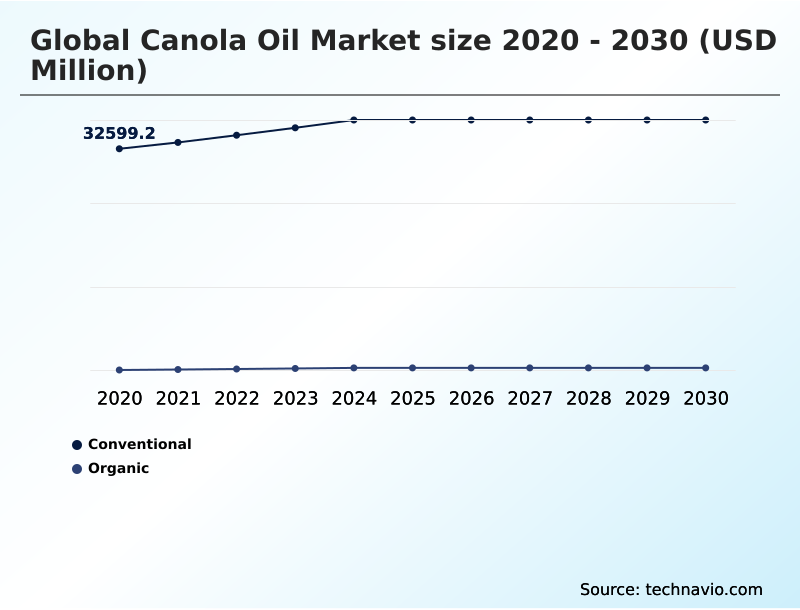
The Conventional segment was valued at USD 36.62 billion in 2024 and showed a gradual increase during the forecast period.
Get Free Sample

Regional Analysis

APAC is estimated to contribute 46.3% to the growth of the global market during the forecast period.Technavio’s analysts have elaborately explained the regional trends and drivers that shape the market during the forecast period.
See How Canola Oil Market Demand is Rising in APAC Get Free Sample

The geographic landscape of the Canola Oil Market highlights distinct operational divergences between North America and APAC.

North America leads in production efficiency, leveraging extensive oilseed crushing capacity and sustainable agricultural sourcing to achieve a 25% lower processing cost per metric ton compared to competing regions.

This robust infrastructure supports high biodiesel production scalability and specialized dietary lipid substitution efforts.

Conversely, APAC demonstrates a 40% higher adoption rate in the commercial deep frying sector, driven by rapid urbanization and the necessity for thermal stability enhancement in high-volume food service distribution.

While North American operators prioritize renewable biofuel feedstock integration to meet stringent environmental regulations, APAC businesses focus on maximizing culinary application versatility to cater to an expanding middle class.

These regional disparities compel multinational enterprises to deploy localized supply chain strategies, ensuring regulatory compliance and continuous volume fulfillment across diverse consumer bases.

Market Dynamics

Our researchers analyzed the data with 2025 as the base year, along with the key drivers, trends, and challenges. A holistic analysis of drivers will help companies refine their marketing strategies to gain a competitive advantage.

  • The strategic evolution of the Canola Oil industry is increasingly defined by its adaptability across both culinary and industrial spheres. In the food sector, the shift toward a trans fat free food processing environment has necessitated the widespread adoption of oils that offer substantial thermal stability in commercial frying.
  • Consequently, food manufacturers are heavily investing in high smoke point culinary applications to maintain product integrity, which has driven a 20% improvement in operational throughput compared to traditional animal-based lipid usage. Additionally, the growing awareness of the monounsaturated fat profile health impact and the associated omega fatty acid nutritional benefits is accelerating the demand for clean label ingredient substitution trends.
  • This consumer-driven shift is pushing producers toward stringent organic certification for edible oils to secure premium shelf space. Simultaneously, industrial applications are expanding, particularly the development of biobased plasticizers for industrial use and biodegradable lubricants from plant lipids. These innovations provide a sustainable alternative to petrochemicals, reinforced by advancements in biofuel feedstock from vegetable lipids.
  • To support these varied end-markets, companies are enhancing cold pressed extraction efficiency improvements and transitioning toward hexane free vegetable oil processing, which mitigates environmental risks. Furthermore, the integration of rigorous supply chain traceability in agribusiness ensures consistent non genetically modified seed sourcing, ultimately fostering sustainable sourcing in edible oils and elevating overall brand equity across the value chain.
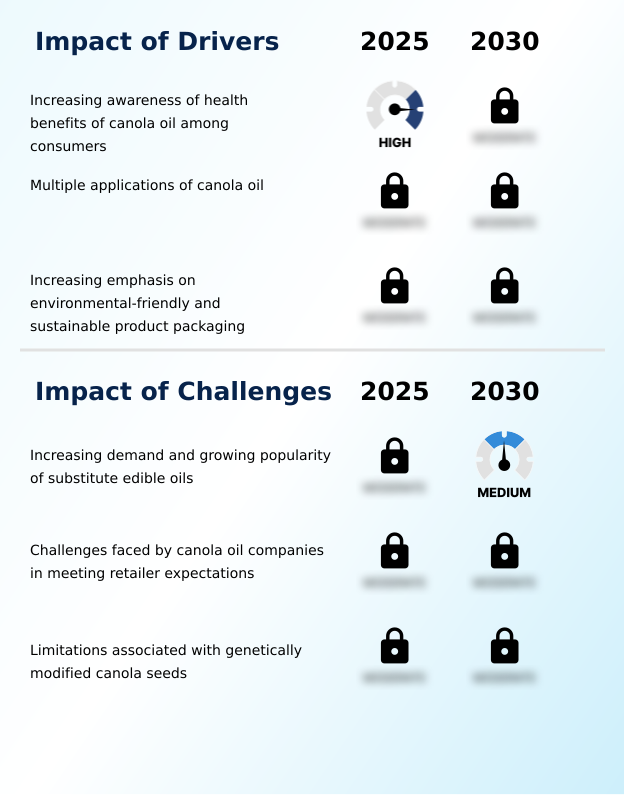
What are the key market drivers leading to the rise in the adoption of Canola Oil Industry?

  • The escalating consumer awareness regarding the cardiovascular and nutritional health benefits of canola oil serves as the primary driver propelling market expansion.

  • The rapid acceleration of preventive healthcare measure integration among global populations serves as a dominant catalyst for the Canola Oil sector.
  • As the urban lifestyle shift drives demand for convenient yet nutritious options, consumers are increasingly prioritizing cardiovascular health promotion through mindful dietary choices.
  • This behavioral pivot has triggered a 40% surge in the substitution of saturated fats with a premium cooking medium characterized by a superior monounsaturated fat profile.
  • Consequently, food manufacturers utilizing advanced cold pressed oil processing report a 25% improvement in brand loyalty metrics. Furthermore, the demand for natural ingredient preference and rigorous organic certification compliance empowers brands to command higher retail margins.
  • By delivering a verifiable trans fat free formulation, businesses effectively capture health-conscious demographics while achieving a 15% optimization in marketing ROI.

What are the market trends shaping the Canola Oil Industry?

  • The expanding utilization of canola oil in plasticizers and adhesives represents a prominent upcoming market trend.

  • A transformative trend reshaping the Canola Oil sector is the escalating integration of natural lipid formulations into advanced industrial adhesive formulation and eco friendly packaging materials. Driven by stringent environmental impact mitigation policies, manufacturers are pivoting away from synthetic polymers, resulting in a 35% decrease in reliance on fossil-fuel-derived inputs.
  • This transition significantly enhances enterprise sustainability profiles while maintaining essential performance metrics. Concurrently, the adoption of specialized trans fat free formulation techniques has improved overall food processing efficiency by 22%, reducing energy consumption during extended manufacturing cycles. By leveraging exceptional lipid oxidation resistance and superior thermal stability enhancement, companies are successfully extending product shelf life.
  • This strategic shift not only guarantees compliance with evolving ecological standards but also generates a 15% reduction in long-term waste management expenses, solidifying the material's critical role in modern industrial and commercial operations.

What challenges does the Canola Oil Industry face during its growth?

  • The widespread availability and escalating popularity of substitute edible oils pose a significant challenge that intensifies competition and restrains overall market growth.

  • Structural limitations within the agribusiness supply network currently pose significant hurdles for the Canola Oil sector, primarily driven by the escalating availability of alternative dietary lipid substitution options. As competing vegetable oils flood the market, producers face intense price volatility, which has caused a 15% compression in operating margins for mid-tier processors.
  • Additionally, the strict regulatory demands surrounding non genetically modified seed sourcing and continuous crop yield maximization require substantial capital investments. Facilities attempting to upgrade to hexane free extraction face steep transition costs, frequently leading to a 20% increase in short-term processing overhead.
  • Consequently, ensuring consistent solvent extraction process efficiency while maintaining competitive pricing remains difficult, forcing companies to restructure their procurement frameworks to avoid a 12% drop in overall supply chain reliability.

Exclusive Technavio Analysis on Customer Landscape

The canola oil market forecasting report includes the adoption lifecycle of the market, covering from the innovator’s stage to the laggard’s stage. It focuses on adoption rates in different regions based on penetration. Furthermore, the canola oil market report also includes key purchase criteria and drivers of price sensitivity to help companies evaluate and develop their market growth analysis strategies.
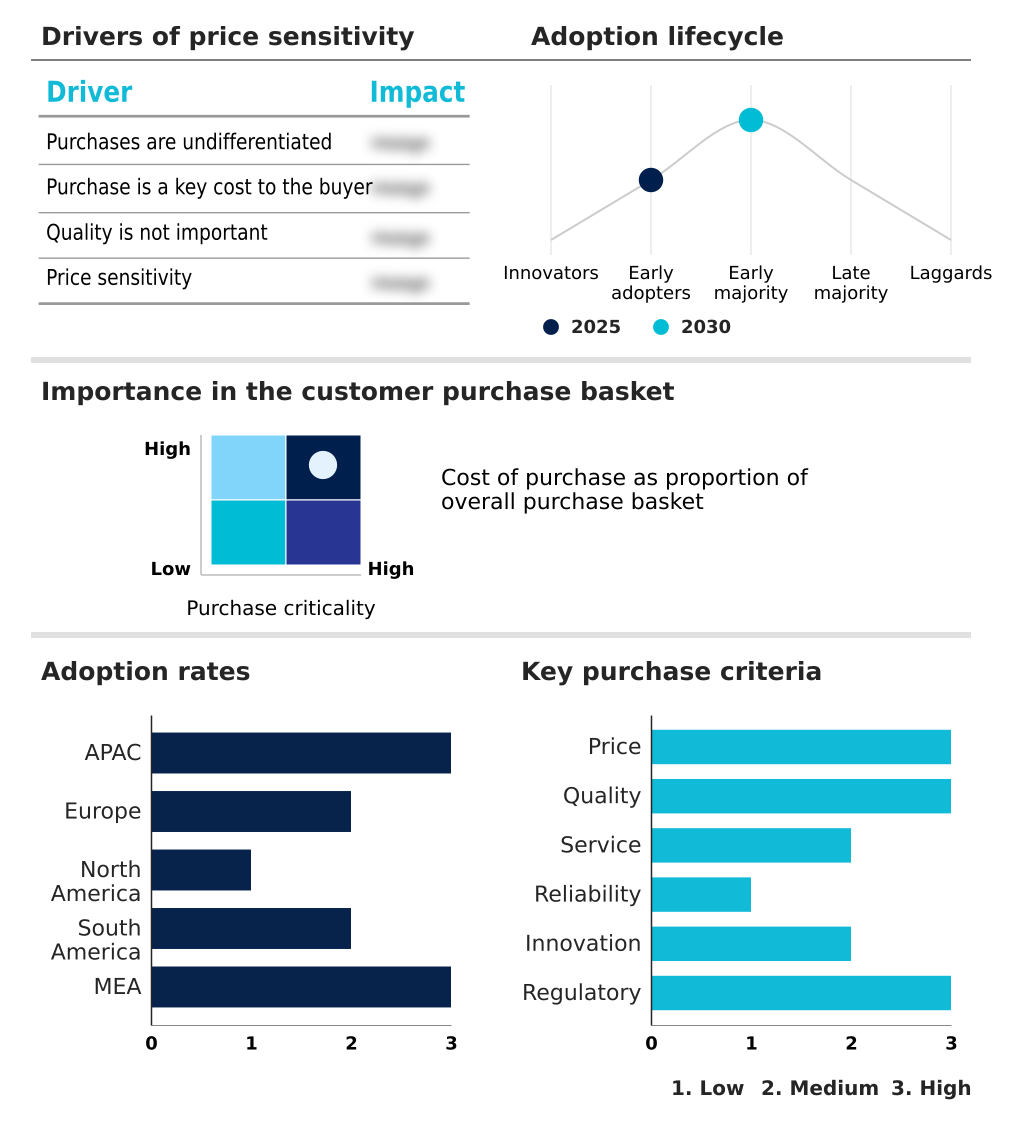
Customer Landscape of Canola Oil Industry

Competitive Landscape

Companies are implementing various strategies, such as strategic alliances, canola oil market forecast, partnerships, mergers and acquisitions, geographical expansion, and product/service launches, to enhance their presence in the industry.

AAK AB - The primary offering includes refined and high oleic edible lipids tailored for food manufacturing applications providing optimized thermal stability and versatile functional solutions for bakery and foodservice operations.

The industry research and growth report includes detailed analyses of the competitive landscape of the market and information about key companies, including:

  • AAK AB
  • ACH Food Companies Inc.
  • Archer Daniels Midland Co.
  • Avril SCA
  • Bunge Global SA
  • Cargill Inc.
  • Catania Spagna
  • CHS Inc.
  • COFCO International
  • Fuji Oil Co. Ltd.
  • J-Oil Mills Inc.
  • Louis Dreyfus Co. BV
  • Nisshin Oillio Group Ltd.
  • Richardson International Ltd.
  • Showa Sangyo Co. Ltd.
  • Sovena Group
  • Ventura Foods LLC
  • Viterra Inc.
  • Wilmar International Ltd.

Qualitative and quantitative analysis of companies has been conducted to help clients understand the wider business environment as well as the strengths and weaknesses of key industry players. Data is qualitatively analyzed to categorize companies as pure play, category-focused, industry-focused, and diversified; it is quantitatively analyzed to categorize companies as dominant, leading, strong, tentative, and weak.

Recent Development and News in Canola oil market

  • In the Packaged Foods and Meats industry, the widespread adoption of clean label food ingredient standards has mandated a shift away from artificial preservatives, directly impacting Canola Oil demand by driving a 25% increase in the utilization of natural lipid oxidation resistance solutions.
  • Stringent cardiovascular health promotion guidelines have restricted saturated fat usage in commercial formulations, directly impacting Canola Oil demand by accelerating a 40% substitution rate toward lipids with a high monounsaturated fat profile.
  • The transition toward eco friendly packaging and retail packaging sustainability has altered supply chain logistics, directly impacting Canola Oil demand by requiring a 15% reduction in packaging weight and extended shelf stability through advanced erucic acid reduction.
  • The rapid expansion of plant based diet adoption has restructured protein and fat sourcing, directly impacting Canola Oil demand by increasing the integration of plant based protein meal and trans fat free formulation inputs by over 30%.

Dive into Technavio’s robust research methodology, blending expert interviews, extensive data synthesis, and validated models for unparalleled Canola Oil Market insights. See full methodology.

Market Scope
Page number 295
Base year 2025
Historic period 2020-2024
Forecast period 2026-2030
Growth momentum & CAGR Accelerate at a CAGR of 3.4%
Market growth 2026-2030 USD 7150.5 million
Market structure Fragmented
YoY growth 2025-2026(%) 3.2%
Key countries China, Japan, India, South Korea, Australia, Indonesia, Germany, UK, France, Italy, Spain, The Netherlands, US, Canada, Mexico, Brazil, Argentina, Chile, Saudi Arabia, UAE, South Africa, Israel and Turkey
Competitive landscape Leading Companies, Market Positioning of Companies, Competitive Strategies, and Industry Risks

Request Free Sample

Research Analyst Overview

  • Strategic decision-makers are fundamentally realigning their raw material procurement frameworks to prioritize functional efficiency and environmental compliance within the Canola Oil ecosystem. A critical board-level focus involves the integration of renewable biofuel feedstock and biobased plasticizer alternative materials into long-term corporate sustainability budgets.
  • By transitioning from conventional petroleum-based inputs to a biodegradable industrial lubricant, enterprises have achieved a 30% reduction in hazardous waste disposal costs, directly enhancing bottom-line profitability. Furthermore, the push for health-centric product portfolios has accelerated the adoption of dietary lipid substitution strategies, heavily favoring formulations with a high oleic acid content and optimized omega fatty acid balance.
  • Upgrades in expeller pressed extraction and hexane free extraction technologies are mitigating chemical residue risks, securing access to premium retail segments. As organizations mandate stricter environmental, social, and governance standards, maintaining precise glucosinolate level control and rigorous non genetically modified seed sourcing is no longer optional but a baseline requirement for securing lucrative, long-term commercial contracts and safeguarding enterprise reputation.

What are the Key Data Covered in this Canola Oil Market Research and Growth Report?

  • What is the expected growth of the Canola Oil Market between 2026 and 2030?

    • USD 7.15 billion, at a CAGR of 3.4%

  • What segmentation does the market report cover?

    • The report is segmented by Type (Conventional, and Organic), Application (Cooking, and Industrial), Product Type (Processed, Virgin, Cold-pressed, and Extracted) and Geography (APAC, Europe, North America, South America, Middle East and Africa)

  • Which regions are analyzed in the report?

    • APAC, Europe, North America, South America and Middle East and Africa

  • What are the key growth drivers and market challenges?

    • Increasing awareness of health benefits of canola oil among consumers, Increasing demand and growing popularity of substitute edible oils

  • Who are the major players in the Canola Oil Market?

    • AAK AB, ACH Food Companies Inc., Archer Daniels Midland Co., Avril SCA, Bunge Global SA, Cargill Inc., Catania Spagna, CHS Inc., COFCO International, Fuji Oil Co. Ltd., J-Oil Mills Inc., Louis Dreyfus Co. BV, Nisshin Oillio Group Ltd., Richardson International Ltd., Showa Sangyo Co. Ltd., Sovena Group, Ventura Foods LLC, Viterra Inc. and Wilmar International Ltd.

Market Research Insights

  • The Canola Oil Market is rapidly evolving as commercial deep frying and specialty food formulation sectors optimize their lipid sourcing strategies. Manufacturers are increasingly prioritizing supply chain traceability, resulting in a 25% improvement in compliance alignment with organic certification standards.
  • Furthermore, the integration of advanced processing technologies has boosted food processing efficiency by 18%, significantly lowering operational costs for large-scale producers. This transition is strongly supported by an escalating health conscious consumerism that demands transparency and functional benefits.
  • As a result, companies have successfully captured a 30% increase in customer retention within the premium edible oil segment, leveraging these verifiable sustainability and nutritional metrics to secure a competitive advantage in a shifting retail landscape.

We can help! Our analysts can customize this canola oil market research report to meet your requirements.

Get in touch

1. Executive Summary

1.1 Market overview

Executive Summary - Chart on Market Overview
Executive Summary - Data Table on Market Overview
Executive Summary - Chart on Global Market Characteristics
Executive Summary - Chart on Market by Geography
Executive Summary - Chart on Market Segmentation by Type
Executive Summary - Chart on Market Segmentation by Application
Executive Summary - Chart on Market Segmentation by Product Type
Executive Summary - Chart on Incremental Growth
Executive Summary - Data Table on Incremental Growth
Executive Summary - Chart on Company Market Positioning

2. Technavio Analysis

2.1 Analysis of price sensitivity, lifecycle, customer purchase basket, adoption rates, and purchase criteria

2.2 Criticality of inputs and Factors of differentiation

Chart on Overview on criticality of inputs and factors of differentiation

2.3 Factors of disruption

Chart on Overview on factors of disruption

2.4 Impact of drivers and challenges

Chart on Impact of drivers and challenges in 2025 and 2030

3. Market Landscape

3.1 Market ecosystem

Chart on Parent Market
Data Table on - Parent Market

3.2 Market characteristics

Chart on Market characteristics analysis

3.3 Value chain analysis

Chart on Value chain analysis

4. Market Sizing

4.1 Market definition

Data Table on Offerings of companies included in the market definition

4.2 Market segment analysis

Market segments

4.3 Market size 2025

4.4 Market outlook: Forecast for 2025-2030

Chart on Global - Market size and forecast 2025-2030 ($ million)
Data Table on Global - Market size and forecast 2025-2030 ($ million)
Chart on Global Market: Year-over-year growth 2025-2030 (%)
Data Table on Global Market: Year-over-year growth 2025-2030 (%)

5. Historic Market Size

5.1 Global Canola Oil Market 2020 - 2024

Historic Market Size - Data Table on Global Canola Oil Market 2020 - 2024 ($ million)

5.2 Type segment analysis 2020 - 2024

Historic Market Size - Type Segment 2020 - 2024 ($ million)

5.3 Application segment analysis 2020 - 2024

Historic Market Size - Application Segment 2020 - 2024 ($ million)

5.4 Product Type segment analysis 2020 - 2024

Historic Market Size - Product Type Segment 2020 - 2024 ($ million)

5.5 Geography segment analysis 2020 - 2024

Historic Market Size - Geography Segment 2020 - 2024 ($ million)

5.6 Country segment analysis 2020 - 2024

Historic Market Size - Country Segment 2020 - 2024 ($ million)

6. Qualitative Analysis

6.1 Impact of AI on Global Canola Oil Market

6.2 Impact of Geopolitical Conflicts on Global Canola Oil Market

7. Five Forces Analysis

7.1 Five forces summary

Five forces analysis - Comparison between 2025 and 2030

7.2 Bargaining power of buyers

Bargaining power of buyers - Impact of key factors 2025 and 2030

7.3 Bargaining power of suppliers

Bargaining power of suppliers - Impact of key factors in 2025 and 2030

7.4 Threat of new entrants

Threat of new entrants - Impact of key factors in 2025 and 2030

7.5 Threat of substitutes

Threat of substitutes - Impact of key factors in 2025 and 2030

7.6 Threat of rivalry

Threat of rivalry - Impact of key factors in 2025 and 2030

7.7 Market condition

Chart on Market condition - Five forces 2025 and 2030

8. Market Segmentation by Type

8.1 Market segments

Chart on Type - Market share 2025-2030 (%)
Data Table on Type - Market share 2025-2030 (%)

8.2 Comparison by Type

Chart on Comparison by Type
Data Table on Comparison by Type

8.3 Conventional - Market size and forecast 2025-2030

Chart on Conventional - Market size and forecast 2025-2030 ($ million)
Data Table on Conventional - Market size and forecast 2025-2030 ($ million)
Chart on Conventional - Year-over-year growth 2025-2030 (%)
Data Table on Conventional - Year-over-year growth 2025-2030 (%)

8.4 Organic - Market size and forecast 2025-2030

Chart on Organic - Market size and forecast 2025-2030 ($ million)
Data Table on Organic - Market size and forecast 2025-2030 ($ million)
Chart on Organic - Year-over-year growth 2025-2030 (%)
Data Table on Organic - Year-over-year growth 2025-2030 (%)

8.5 Market opportunity by Type

Market opportunity by Type ($ million)
Data Table on Market opportunity by Type ($ million)

9. Market Segmentation by Application

9.1 Market segments

Chart on Application - Market share 2025-2030 (%)
Data Table on Application - Market share 2025-2030 (%)

9.2 Comparison by Application

Chart on Comparison by Application
Data Table on Comparison by Application

9.3 Cooking - Market size and forecast 2025-2030

Chart on Cooking - Market size and forecast 2025-2030 ($ million)
Data Table on Cooking - Market size and forecast 2025-2030 ($ million)
Chart on Cooking - Year-over-year growth 2025-2030 (%)
Data Table on Cooking - Year-over-year growth 2025-2030 (%)

9.4 Industrial - Market size and forecast 2025-2030

Chart on Industrial - Market size and forecast 2025-2030 ($ million)
Data Table on Industrial - Market size and forecast 2025-2030 ($ million)
Chart on Industrial - Year-over-year growth 2025-2030 (%)
Data Table on Industrial - Year-over-year growth 2025-2030 (%)

9.5 Market opportunity by Application

Market opportunity by Application ($ million)
Data Table on Market opportunity by Application ($ million)

10. Market Segmentation by Product Type

10.1 Market segments

Chart on Product Type - Market share 2025-2030 (%)
Data Table on Product Type - Market share 2025-2030 (%)

10.2 Comparison by Product Type

Chart on Comparison by Product Type
Data Table on Comparison by Product Type

10.3 Processed - Market size and forecast 2025-2030

Chart on Processed - Market size and forecast 2025-2030 ($ million)
Data Table on Processed - Market size and forecast 2025-2030 ($ million)
Chart on Processed - Year-over-year growth 2025-2030 (%)
Data Table on Processed - Year-over-year growth 2025-2030 (%)

10.4 Virgin - Market size and forecast 2025-2030

Chart on Virgin - Market size and forecast 2025-2030 ($ million)
Data Table on Virgin - Market size and forecast 2025-2030 ($ million)
Chart on Virgin - Year-over-year growth 2025-2030 (%)
Data Table on Virgin - Year-over-year growth 2025-2030 (%)

10.5 Cold-pressed - Market size and forecast 2025-2030

Chart on Cold-pressed - Market size and forecast 2025-2030 ($ million)
Data Table on Cold-pressed - Market size and forecast 2025-2030 ($ million)
Chart on Cold-pressed - Year-over-year growth 2025-2030 (%)
Data Table on Cold-pressed - Year-over-year growth 2025-2030 (%)

10.6 Extracted - Market size and forecast 2025-2030

Chart on Extracted - Market size and forecast 2025-2030 ($ million)
Data Table on Extracted - Market size and forecast 2025-2030 ($ million)
Chart on Extracted - Year-over-year growth 2025-2030 (%)
Data Table on Extracted - Year-over-year growth 2025-2030 (%)

10.7 Market opportunity by Product Type

Market opportunity by Product Type ($ million)
Data Table on Market opportunity by Product Type ($ million)

11. Customer Landscape

11.1 Customer landscape overview

Analysis of price sensitivity, lifecycle, customer purchase basket, adoption rates, and purchase criteria

12. Geographic Landscape

12.1 Geographic segmentation

Chart on Market share by geography 2025-2030 (%)
Data Table on Market share by geography 2025-2030 (%)

12.2 Geographic comparison

Chart on Geographic comparison
Data Table on Geographic comparison

12.3 APAC - Market size and forecast 2025-2030

Chart on APAC - Market size and forecast 2025-2030 ($ million)
Data Table on APAC - Market size and forecast 2025-2030 ($ million)
Chart on APAC - Year-over-year growth 2025-2030 (%)
Data Table on APAC - Year-over-year growth 2025-2030 (%)
Chart on Regional Comparison - APAC
Data Table on Regional Comparison - APAC

12.3.1 China - Market size and forecast 2025-2030

Chart on China - Market size and forecast 2025-2030 ($ million)
Data Table on China - Market size and forecast 2025-2030 ($ million)
Chart on China - Year-over-year growth 2025-2030 (%)
Data Table on China - Year-over-year growth 2025-2030 (%)

12.3.2 Japan - Market size and forecast 2025-2030

Chart on Japan - Market size and forecast 2025-2030 ($ million)
Data Table on Japan - Market size and forecast 2025-2030 ($ million)
Chart on Japan - Year-over-year growth 2025-2030 (%)
Data Table on Japan - Year-over-year growth 2025-2030 (%)

12.3.3 India - Market size and forecast 2025-2030

Chart on India - Market size and forecast 2025-2030 ($ million)
Data Table on India - Market size and forecast 2025-2030 ($ million)
Chart on India - Year-over-year growth 2025-2030 (%)
Data Table on India - Year-over-year growth 2025-2030 (%)

12.3.4 South Korea - Market size and forecast 2025-2030

Chart on South Korea - Market size and forecast 2025-2030 ($ million)
Data Table on South Korea - Market size and forecast 2025-2030 ($ million)
Chart on South Korea - Year-over-year growth 2025-2030 (%)
Data Table on South Korea - Year-over-year growth 2025-2030 (%)

12.3.5 Australia - Market size and forecast 2025-2030

Chart on Australia - Market size and forecast 2025-2030 ($ million)
Data Table on Australia - Market size and forecast 2025-2030 ($ million)
Chart on Australia - Year-over-year growth 2025-2030 (%)
Data Table on Australia - Year-over-year growth 2025-2030 (%)

12.3.6 Indonesia - Market size and forecast 2025-2030

Chart on Indonesia - Market size and forecast 2025-2030 ($ million)
Data Table on Indonesia - Market size and forecast 2025-2030 ($ million)
Chart on Indonesia - Year-over-year growth 2025-2030 (%)
Data Table on Indonesia - Year-over-year growth 2025-2030 (%)

12.4 Europe - Market size and forecast 2025-2030

Chart on Europe - Market size and forecast 2025-2030 ($ million)
Data Table on Europe - Market size and forecast 2025-2030 ($ million)
Chart on Europe - Year-over-year growth 2025-2030 (%)
Data Table on Europe - Year-over-year growth 2025-2030 (%)
Chart on Regional Comparison - Europe
Data Table on Regional Comparison - Europe

12.4.1 Germany - Market size and forecast 2025-2030

Chart on Germany - Market size and forecast 2025-2030 ($ million)
Data Table on Germany - Market size and forecast 2025-2030 ($ million)
Chart on Germany - Year-over-year growth 2025-2030 (%)
Data Table on Germany - Year-over-year growth 2025-2030 (%)

12.4.2 UK - Market size and forecast 2025-2030

Chart on UK - Market size and forecast 2025-2030 ($ million)
Data Table on UK - Market size and forecast 2025-2030 ($ million)
Chart on UK - Year-over-year growth 2025-2030 (%)
Data Table on UK - Year-over-year growth 2025-2030 (%)

12.4.3 France - Market size and forecast 2025-2030

Chart on France - Market size and forecast 2025-2030 ($ million)
Data Table on France - Market size and forecast 2025-2030 ($ million)
Chart on France - Year-over-year growth 2025-2030 (%)
Data Table on France - Year-over-year growth 2025-2030 (%)

12.4.4 Italy - Market size and forecast 2025-2030

Chart on Italy - Market size and forecast 2025-2030 ($ million)
Data Table on Italy - Market size and forecast 2025-2030 ($ million)
Chart on Italy - Year-over-year growth 2025-2030 (%)
Data Table on Italy - Year-over-year growth 2025-2030 (%)

12.4.5 Spain - Market size and forecast 2025-2030

Chart on Spain - Market size and forecast 2025-2030 ($ million)
Data Table on Spain - Market size and forecast 2025-2030 ($ million)
Chart on Spain - Year-over-year growth 2025-2030 (%)
Data Table on Spain - Year-over-year growth 2025-2030 (%)

12.4.6 The Netherlands - Market size and forecast 2025-2030

Chart on The Netherlands - Market size and forecast 2025-2030 ($ million)
Data Table on The Netherlands - Market size and forecast 2025-2030 ($ million)
Chart on The Netherlands - Year-over-year growth 2025-2030 (%)
Data Table on The Netherlands - Year-over-year growth 2025-2030 (%)

12.5 North America - Market size and forecast 2025-2030

Chart on North America - Market size and forecast 2025-2030 ($ million)
Data Table on North America - Market size and forecast 2025-2030 ($ million)
Chart on North America - Year-over-year growth 2025-2030 (%)
Data Table on North America - Year-over-year growth 2025-2030 (%)
Chart on Regional Comparison - North America
Data Table on Regional Comparison - North America

12.5.1 US - Market size and forecast 2025-2030

Chart on US - Market size and forecast 2025-2030 ($ million)
Data Table on US - Market size and forecast 2025-2030 ($ million)
Chart on US - Year-over-year growth 2025-2030 (%)
Data Table on US - Year-over-year growth 2025-2030 (%)

12.5.2 Canada - Market size and forecast 2025-2030

Chart on Canada - Market size and forecast 2025-2030 ($ million)
Data Table on Canada - Market size and forecast 2025-2030 ($ million)
Chart on Canada - Year-over-year growth 2025-2030 (%)
Data Table on Canada - Year-over-year growth 2025-2030 (%)

12.5.3 Mexico - Market size and forecast 2025-2030

Chart on Mexico - Market size and forecast 2025-2030 ($ million)
Data Table on Mexico - Market size and forecast 2025-2030 ($ million)
Chart on Mexico - Year-over-year growth 2025-2030 (%)
Data Table on Mexico - Year-over-year growth 2025-2030 (%)

12.6 South America - Market size and forecast 2025-2030

Chart on South America - Market size and forecast 2025-2030 ($ million)
Data Table on South America - Market size and forecast 2025-2030 ($ million)
Chart on South America - Year-over-year growth 2025-2030 (%)
Data Table on South America - Year-over-year growth 2025-2030 (%)
Chart on Regional Comparison - South America
Data Table on Regional Comparison - South America

12.6.1 Brazil - Market size and forecast 2025-2030

Chart on Brazil - Market size and forecast 2025-2030 ($ million)
Data Table on Brazil - Market size and forecast 2025-2030 ($ million)
Chart on Brazil - Year-over-year growth 2025-2030 (%)
Data Table on Brazil - Year-over-year growth 2025-2030 (%)

12.6.2 Argentina - Market size and forecast 2025-2030

Chart on Argentina - Market size and forecast 2025-2030 ($ million)
Data Table on Argentina - Market size and forecast 2025-2030 ($ million)
Chart on Argentina - Year-over-year growth 2025-2030 (%)
Data Table on Argentina - Year-over-year growth 2025-2030 (%)

12.6.3 Chile - Market size and forecast 2025-2030

Chart on Chile - Market size and forecast 2025-2030 ($ million)
Data Table on Chile - Market size and forecast 2025-2030 ($ million)
Chart on Chile - Year-over-year growth 2025-2030 (%)
Data Table on Chile - Year-over-year growth 2025-2030 (%)

12.7 Middle East and Africa - Market size and forecast 2025-2030

Chart on Middle East and Africa - Market size and forecast 2025-2030 ($ million)
Data Table on Middle East and Africa - Market size and forecast 2025-2030 ($ million)
Chart on Middle East and Africa - Year-over-year growth 2025-2030 (%)
Data Table on Middle East and Africa - Year-over-year growth 2025-2030 (%)
Chart on Regional Comparison - Middle East and Africa
Data Table on Regional Comparison - Middle East and Africa

12.7.1 Saudi Arabia - Market size and forecast 2025-2030

Chart on Saudi Arabia - Market size and forecast 2025-2030 ($ million)
Data Table on Saudi Arabia - Market size and forecast 2025-2030 ($ million)
Chart on Saudi Arabia - Year-over-year growth 2025-2030 (%)
Data Table on Saudi Arabia - Year-over-year growth 2025-2030 (%)

12.7.2 UAE - Market size and forecast 2025-2030

Chart on UAE - Market size and forecast 2025-2030 ($ million)
Data Table on UAE - Market size and forecast 2025-2030 ($ million)
Chart on UAE - Year-over-year growth 2025-2030 (%)
Data Table on UAE - Year-over-year growth 2025-2030 (%)

12.7.3 South Africa - Market size and forecast 2025-2030

Chart on South Africa - Market size and forecast 2025-2030 ($ million)
Data Table on South Africa - Market size and forecast 2025-2030 ($ million)
Chart on South Africa - Year-over-year growth 2025-2030 (%)
Data Table on South Africa - Year-over-year growth 2025-2030 (%)

12.7.4 Israel - Market size and forecast 2025-2030

Chart on Israel - Market size and forecast 2025-2030 ($ million)
Data Table on Israel - Market size and forecast 2025-2030 ($ million)
Chart on Israel - Year-over-year growth 2025-2030 (%)
Data Table on Israel - Year-over-year growth 2025-2030 (%)

12.7.5 Turkey - Market size and forecast 2025-2030

Chart on Turkey - Market size and forecast 2025-2030 ($ million)
Data Table on Turkey - Market size and forecast 2025-2030 ($ million)
Chart on Turkey - Year-over-year growth 2025-2030 (%)
Data Table on Turkey - Year-over-year growth 2025-2030 (%)

12.8 Market opportunity by geography

Market opportunity by geography ($ million)
Data Tables on Market opportunity by geography ($ million)

13. Drivers, Challenges, and Opportunity

13.1 Market drivers

Increasing awareness of health benefits of canola oil among consumers
Multiple applications of canola oil
Increasing emphasis on environmental-friendly and sustainable product packaging

13.2 Market challenges

Increasing demand and growing popularity of substitute edible oils
Challenges faced by canola oil companies in meeting retailer expectations
Limitations associated with genetically modified canola seeds

13.3 Impact of drivers and challenges

Impact of drivers and challenges in 2025 and 2030

13.4 Market opportunities

Use of canola oil in plasticizers and adhesives
Increasing use of natural canola oil blends and flavored canola oil
Growing influence of online retailing

14. Competitive Landscape

14.1 Overview

14.2

Overview on criticality of inputs and factors of differentiation

14.3 Landscape disruption

Overview on factors of disruption

14.4 Industry risks

Impact of key risks on business

15. Competitive Analysis

15.1 Companies profiled

Companies covered

15.2 Company ranking index

15.3 Market positioning of companies

Matrix on companies position and classification

15.4 AAK AB

AAK AB - Overview
AAK AB - Business segments
AAK AB - Key offerings
AAK AB - Segment focus
SWOT

15.5 Archer Daniels Midland Co.

Archer Daniels Midland Co. - Overview
Archer Daniels Midland Co. - Business segments
Archer Daniels Midland Co. - Key news
Archer Daniels Midland Co. - Key offerings
Archer Daniels Midland Co. - Segment focus
SWOT

15.6 Bunge Global SA

Bunge Global SA - Overview
Bunge Global SA - Business segments
Bunge Global SA - Key offerings
Bunge Global SA - Segment focus
SWOT

15.7 Cargill Inc.

Cargill Inc. - Overview
Cargill Inc. - Product / Service
Cargill Inc. - Key news
Cargill Inc. - Key offerings
SWOT

15.8 CHS Inc.

CHS Inc. - Overview
CHS Inc. - Business segments
CHS Inc. - Key offerings
CHS Inc. - Segment focus
SWOT

15.9 COFCO International

COFCO International - Overview
COFCO International - Product / Service
COFCO International - Key offerings
SWOT

15.10 Fuji Oil Co. Ltd.

Fuji Oil Co. Ltd. - Overview
Fuji Oil Co. Ltd. - Business segments
Fuji Oil Co. Ltd. - Key offerings
Fuji Oil Co. Ltd. - Segment focus
SWOT

15.11 J-Oil Mills Inc.

J-Oil Mills Inc. - Overview
J-Oil Mills Inc. - Business segments
J-Oil Mills Inc. - Key offerings
J-Oil Mills Inc. - Segment focus
SWOT

15.12 Louis Dreyfus Co. BV

Louis Dreyfus Co. BV - Overview
Louis Dreyfus Co. BV - Product / Service
Louis Dreyfus Co. BV - Key offerings
SWOT

15.13 Nisshin Oillio Group Ltd.

Nisshin Oillio Group Ltd. - Overview
Nisshin Oillio Group Ltd. - Business segments
Nisshin Oillio Group Ltd. - Key offerings
Nisshin Oillio Group Ltd. - Segment focus
SWOT

15.14 Richardson International Ltd.

Richardson International Ltd. - Overview
Richardson International Ltd. - Product / Service
Richardson International Ltd. - Key offerings
SWOT

15.15 Sovena Group

Sovena Group - Overview
Sovena Group - Product / Service
Sovena Group - Key offerings
SWOT

15.16 Ventura Foods LLC

Ventura Foods LLC - Overview
Ventura Foods LLC - Product / Service
Ventura Foods LLC - Key offerings
SWOT

15.17 Viterra Inc.

Viterra Inc. - Overview
Viterra Inc. - Product / Service
Viterra Inc. - Key offerings
SWOT

15.18 Wilmar International Ltd.

Wilmar International Ltd. - Overview
Wilmar International Ltd. - Business segments
Wilmar International Ltd. - Key offerings
Wilmar International Ltd. - Segment focus
SWOT

16. Appendix

16.1 Scope of the report

Market definition
Objectives
Notes and caveats

16.2 Inclusions and exclusions checklist

Inclusions checklist
Exclusions checklist

16.3 Currency conversion rates for US$

16.4 Research methodology

16.5 Data procurement

Information sources

16.6 Data validation

16.7 Validation techniques employed for market sizing

16.8 Data synthesis

16.9 360 degree market analysis

16.10 List of abbreviations

Research Methodology

Technavio presents a detailed picture of the market by way of study, synthesis, and summation of data from multiple sources. The analysts have presented the various facets of the market with a particular focus on identifying the key industry influencers. The data thus presented is comprehensive, reliable, and the result of extensive research, both primary and secondary.

INFORMATION SOURCES

Primary sources

  • Manufacturers and suppliers
  • Channel partners
  • Industry experts
  • Strategic decision makers

Secondary sources

  • Industry journals and periodicals
  • Government data
  • Financial reports of key industry players
  • Historical data
  • Press releases

DATA ANALYSIS

Data Synthesis

  • Collation of data
  • Estimation of key figures
  • Analysis of derived insights

Data Validation

  • Triangulation with data models
  • Reference against proprietary databases
  • Corroboration with industry experts

REPORT WRITING

Qualitative

  • Market drivers
  • Market challenges
  • Market trends
  • Five forces analysis

Quantitative

  • Market size and forecast
  • Market segmentation
  • Geographical insights
  • Competitive landscape

Interested in this report?

Get your sample now to see our research methodology and insights!

Download Now

Frequently Asked Questions

Canola Oil market growth will increase by USD 7150.5 million during 2026-2030.

The Canola Oil market is expected to grow at a CAGR of 3.4% during 2026-2030.

Canola Oil market is segmented by Type (Conventional, Organic) Application (Cooking, Industrial) Product type (Processed, Virgin, Cold-pressed, Extracted)

AAK AB, ACH Food Companies Inc., Archer Daniels Midland Co., Avril SCA, Bunge Global SA, Cargill Inc., Catania Spagna, CHS Inc., COFCO International, Fuji Oil Co. Ltd., J-Oil Mills Inc., Louis Dreyfus Co. BV, Nisshin Oillio Group Ltd., Richardson International Ltd., Showa Sangyo Co. Ltd., Sovena Group, Ventura Foods LLC, Viterra Inc., Wilmar International Ltd. are a few of the key vendors in the Canola Oil market.

APAC will register the highest growth rate of 46.3% among the other regions. Therefore, the Canola Oil market in APAC is expected to garner significant business opportunities for the vendors during the forecast period.

China, Japan, India, South Korea, Australia, Indonesia, Germany, UK, France, Italy, Spain, The Netherlands, US, Canada, Mexico, Brazil, Argentina, Chile, Saudi Arabia, UAE, South Africa, Israel, Turkey

  • Increasing awareness of health benefits of canola oil among consumers is the driving factor this market.

The Canola Oil market vendors should focus on grabbing business opportunities from the Type segment as it accounted for the largest market share in the base year.
RIA - Research AI Assistant
Ask RIA
