Car Rental Market Analysis, Size, and Forecast 2026-2030: North America (US, Canada, and Mexico), Europe (Germany, France, and UK), APAC (China, Japan, and Australia), Middle East and Africa (Saudi Arabia, UAE, and South Africa), South America (Brazil and Argentina), and Rest of World (ROW)

Car Rental Market Analysis, Size, and Forecast 2026-2030:
North America (US, Canada, and Mexico), Europe (Germany, France, and UK), APAC (China, Japan, and Australia), Middle East and Africa (Saudi Arabia, UAE, and South Africa), South America (Brazil and Argentina), and Rest of World (ROW)

Published: Mar 2026 298 Pages SKU: IRTNTR40065

Market Overview at a Glance

$83.85 B
Market Opportunity
10.2%
CAGR 2025 - 2030
42%
North America Growth
$65.72 B
Offline segment 2024

Car Rental Market Size 2026-2030

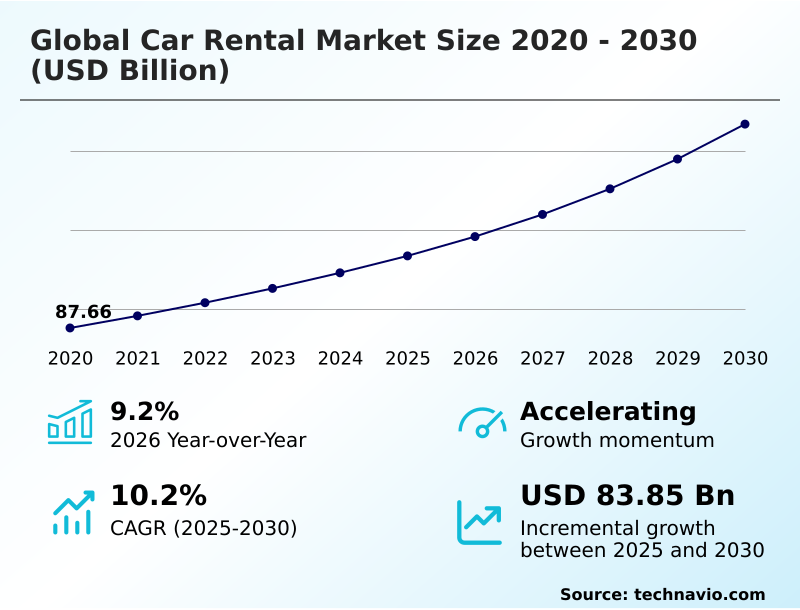
The car rental market size is valued to increase by USD 83.85 billion, at a CAGR of 10.2% from 2025 to 2030. Rise in vehicle ownership cost will drive the car rental market.

Major Market Trends & Insights

  • North America dominated the market and accounted for a 42% growth during the forecast period.
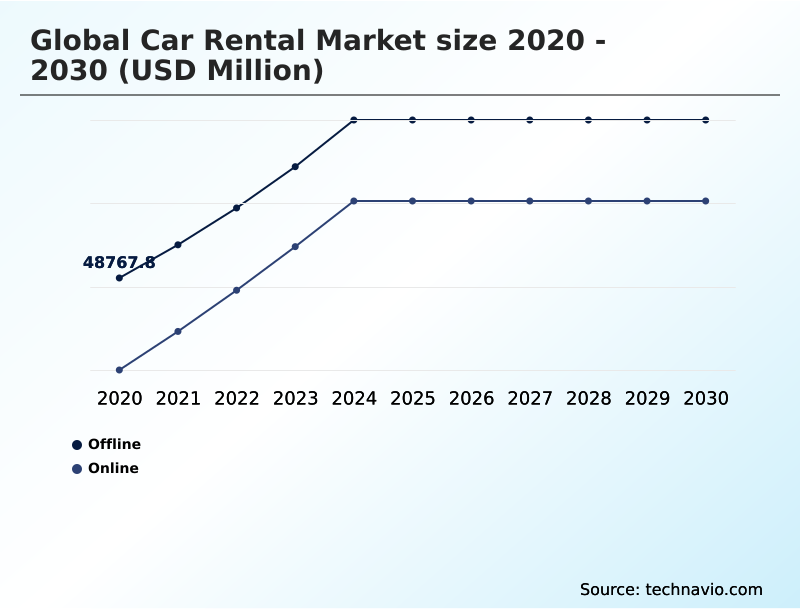
  • By Mode of Booking - Offline segment was valued at USD 65.72 billion in 2024
  • By Rental Category - Airport transport segment accounted for the largest market revenue share in 2024

Market Size & Forecast

  • Market Opportunities: USD 129.71 billion
  • Market Future Opportunities: USD 83.85 billion
  • CAGR from 2025 to 2030 : 10.2%

Market Summary

  • The car rental market is undergoing a profound transformation driven by shifts in consumer behavior and technological innovation. Rising vehicle ownership costs and urbanization are compelling individuals and corporations to favor access over ownership, turning to rentals for flexibility and cost-effectiveness.
  • This trend is amplified by the integration of digital platforms, which have streamlined the entire rental process from booking to return. A key business scenario involves a logistics company that eschews a wholly owned fleet, instead using a mix of long-term rentals for predictable routes and on-demand rentals to manage seasonal demand peaks.
  • This approach, supported by fleet utilization optimization and advanced demand forecasting models, minimizes capital expenditure and reduces operational risks associated with vehicle maintenance and depreciation. Concurrently, the industry is navigating challenges from car-sharing and ride-hailing services by diversifying into subscription models and enhancing the customer experience with personalized, data-driven offerings.

What will be the Size of the Car Rental Market during the forecast period?

Get Key Insights on Market Forecast (PDF) Request Free Sample

How is the Car Rental Market Segmented?

The car rental industry research report provides comprehensive data (region-wise segment analysis), with forecasts and estimates in "USD million" for the period 2026-2030, as well as historical data from 2020-2024 for the following segments.

  • Mode of booking
    • Offline
    • Online
  • Rental category
    • Airport transport
    • Local transport
    • Outstation transport
    • Others
  • Type
    • Economy cars
    • Executive cars
    • Luxury cars
    • SUVs
    • MUVs
  • Geography
    • North America
      • US
      • Canada
      • Mexico
    • Europe
      • Germany
      • France
      • UK
    • APAC
      • China
      • Japan
      • Australia
    • Middle East and Africa
      • Saudi Arabia
      • UAE
      • South Africa
    • South America
      • Brazil
      • Argentina
    • Rest of World (ROW)

By Mode of Booking Insights

The offline segment is estimated to witness significant growth during the forecast period.

Offline channels remain a vital component of the car rental market, particularly for high-value transactions in corporate travel management and luxury car hire services.

These segments often require personalized interaction for arranging chauffeur-driven services or complex corporate car leasing solutions, which strengthens customer relationship management (CRM) and loyalty program management.

While digital payment gateways are standard online, offline touchpoints provide opportunities for direct upselling and addressing nuanced needs for business travel car rental.

In certain regions, particularly for car rental for international travel and vacation car rentals, physical counters build trust and facilitate automated vehicle inspection before vehicle handover.

Operators use sophisticated demand forecasting models to balance inventory between online and offline channels, ensuring availability for premium and specialized premium vehicle rental requests, which contribute over 35% of revenue in the corporate sector.

Request Free Sample

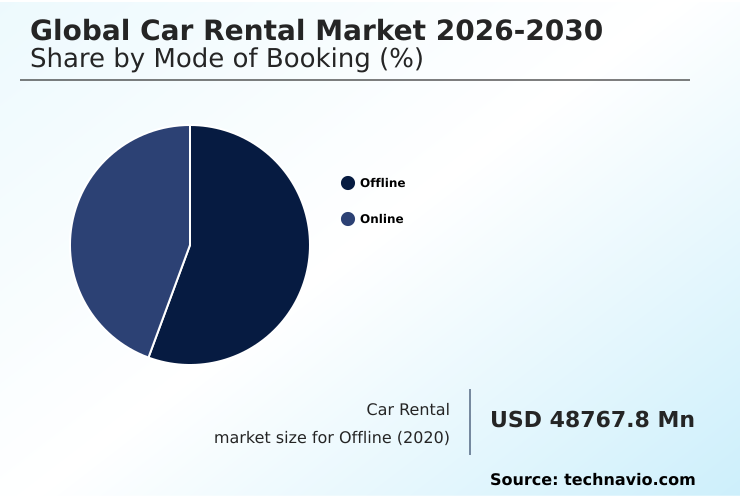
The Offline segment was valued at USD 65.72 billion in 2024 and showed a gradual increase during the forecast period.

Request Free Sample

Regional Analysis

North America is estimated to contribute 42% to the growth of the global market during the forecast period.Technavio’s analysts have elaborately explained the regional trends and drivers that shape the market during the forecast period.

See How Car Rental Market Demand is Rising in North America Request Free Sample

The geographic landscape is diverse, with North America contributing 42% of incremental growth, driven by extensive airport car rental services and a mature corporate market.

Europe is focusing on sustainability, with rapid adoption of vehicle-to-grid (V2G) technology and comprehensive electric vehicle (EV) charging infrastructure to support electric fleets. In this region, mobility-as-a-service (MaaS) integration has improved connectivity, reducing urban congestion.

The APAC region, exhibiting the highest growth at 11.4%, is a hub for innovation in autonomous vehicle rental and battery health monitoring for its expanding EV fleets.

Across regions, firms are implementing predictive maintenance scheduling and fleet utilization optimization powered by car rental fleet management software.

Offering flexible car rental insurance packages, diverse options for family car rental, and attractive car rental loyalty programs for frequent travelers, alongside convenient one-way car rental deals are key competitive strategies.

Market Dynamics

Our researchers analyzed the data with 2025 as the base year, along with the key drivers, trends, and challenges. A holistic analysis of drivers will help companies refine their marketing strategies to gain a competitive advantage.

  • Strategic decision-making in the global car rental market 2026-2030 increasingly revolves around complex operational questions. Executives are evaluating how to integrate telematics in car rental systems to unlock the full benefits of dynamic pricing for car rentals and improve asset tracking.
  • A primary focus is addressing the challenges of managing an EV rental fleet, from optimizing charging cycles to mitigating battery degradation. Boardroom discussions frequently involve comparing car rental vs car sharing costs to understand shifting consumer preferences and the competitive threat.
  • Furthermore, the impact of MaaS on the global car rental market 2026-2030 is forcing a re-evaluation of traditional business models, pushing firms to adopt best practices for car rental fleet utilization.
  • Technology is at the forefront, with a push to define the future of autonomous car rental services and explore AI applications in car rental customer service to enhance user experience. The role of IoT in predictive vehicle maintenance is another critical area, with firms using this technology reporting vehicle-on-road availability rates nearly double those of competitors relying on reactive repairs.
  • Security features in contactless car rental and data privacy concerns in car rental telematics are non-negotiable considerations. Operationally, the industry is focused on optimizing car rental airport operations, reducing operational costs in car rental business, and managing corporate car rental sustainability reporting mandates.
  • The market is also shaped by how online travel agencies affect car rental pricing, the need for effective software for managing peer-to-peer car rentals, and the logistics of implementing subscription models for car rentals.
  • Finally, post-pandemic operational adjustments include implementing stringent vehicle sanitization protocols for rental fleets and developing robust strategies for managing residual value risk, alongside integrating car rentals with public transport apps.

What are the key market drivers leading to the rise in the adoption of Car Rental Industry?

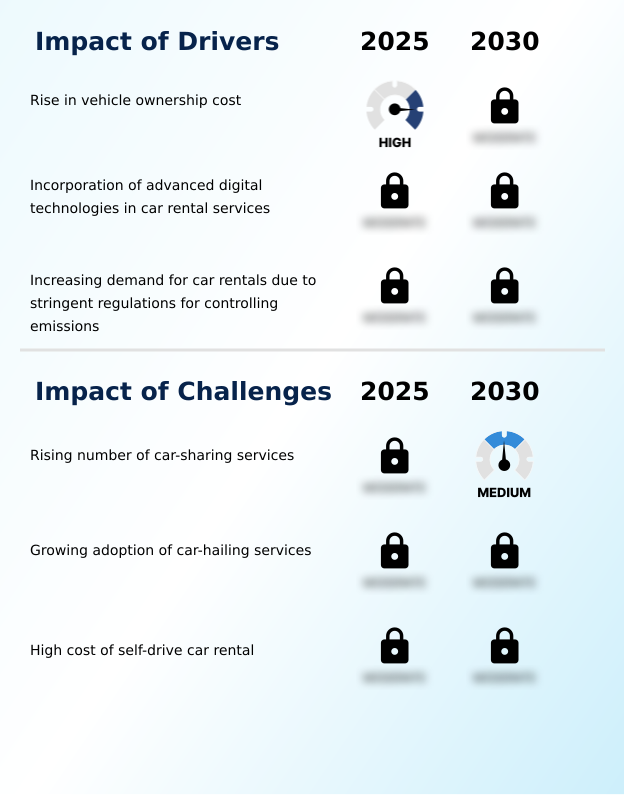
  • The increasing cost of vehicle ownership stands as a key market driver, prompting a shift in consumer preference toward more flexible and financially viable rental options.

  • Advanced digital technologies are a primary driver, transforming service delivery and operational efficiency. The adoption of AI-powered revenue management and dynamic pricing algorithms allows for real-time rate adjustments, optimizing yield by over 15% during peak seasons.
  • The customer experience is enhanced through contactless vehicle access, enabled by keyless entry systems and digital key solutions managed via smartphone, with firms reporting a 40% reduction in customer wait times at pickup locations.
  • This move toward contactless car pickup aligns with demand for sustainable transportation rental and flexible vehicle hire.
  • Furthermore, the development of software-defined vehicles and connected car platforms is paving the way for advanced diagnostics and feature customization, making economy car rental and long-term car rental subscription offerings more appealing.
  • The shift towards electric vehicle rental options is also accelerating.

What are the market trends shaping the Car Rental Industry?

  • The advent of intermediaries is significantly reshaping the global car rental market's competitive landscape. These platforms are altering how supply meets demand and how customer relationships are managed.

  • The rise of digital intermediaries, including online travel agencies (OTAs) and car rental booking aggregators, is fundamentally reshaping market dynamics. These platforms, accessible via on-demand car rental app interfaces, create a transparent digital car rental marketplace where consumers use car rental price comparison tools to find deals.
  • This trend is complemented by the integration of rentals into broader multi-modal travel platforms, blending car access with public transit. Concurrently, the use of vehicle telematics systems is surging, with IoT-enabled fleet management and telematics data analytics enabling new models like usage-based insurance (UBI).
  • This shift supports flexible subscription-based mobility and short-term vehicle rental options, with data showing that telematics can improve fleet efficiency by up to 18%. Operators offering monthly car rental plans through these advanced systems report higher customer retention.

What challenges does the Car Rental Industry face during its growth?

  • The rising prevalence of car-sharing services presents a key challenge to industry growth by offering a highly convenient and flexible alternative to traditional car rentals.

  • The market faces significant challenges from alternative smart mobility solutions that redefine urban transport. The proliferation of peer-to-peer (P2P) carsharing and self-drive car rental platform models erodes the traditional rental market, particularly for short-term urban use cases and last-mile mobility solutions. These platforms offer greater flexibility to car rental for gig economy workers and other users in urban mobility services.
  • Simultaneously, the rising popularity of ride-hailing services diminishes the need for rentals, especially for airport transfers. Internally, operators grapple with complex one-way rental logistics and effective residual value risk management for large fleets of SUV rental services and van and truck rental services.
  • The high capital outlay for corporate fleet leasing and advanced technology like advanced driver-assistance systems (ADAS) and biometric authentication adds to the cost pressures, impacting profitability.

Exclusive Technavio Analysis on Customer Landscape

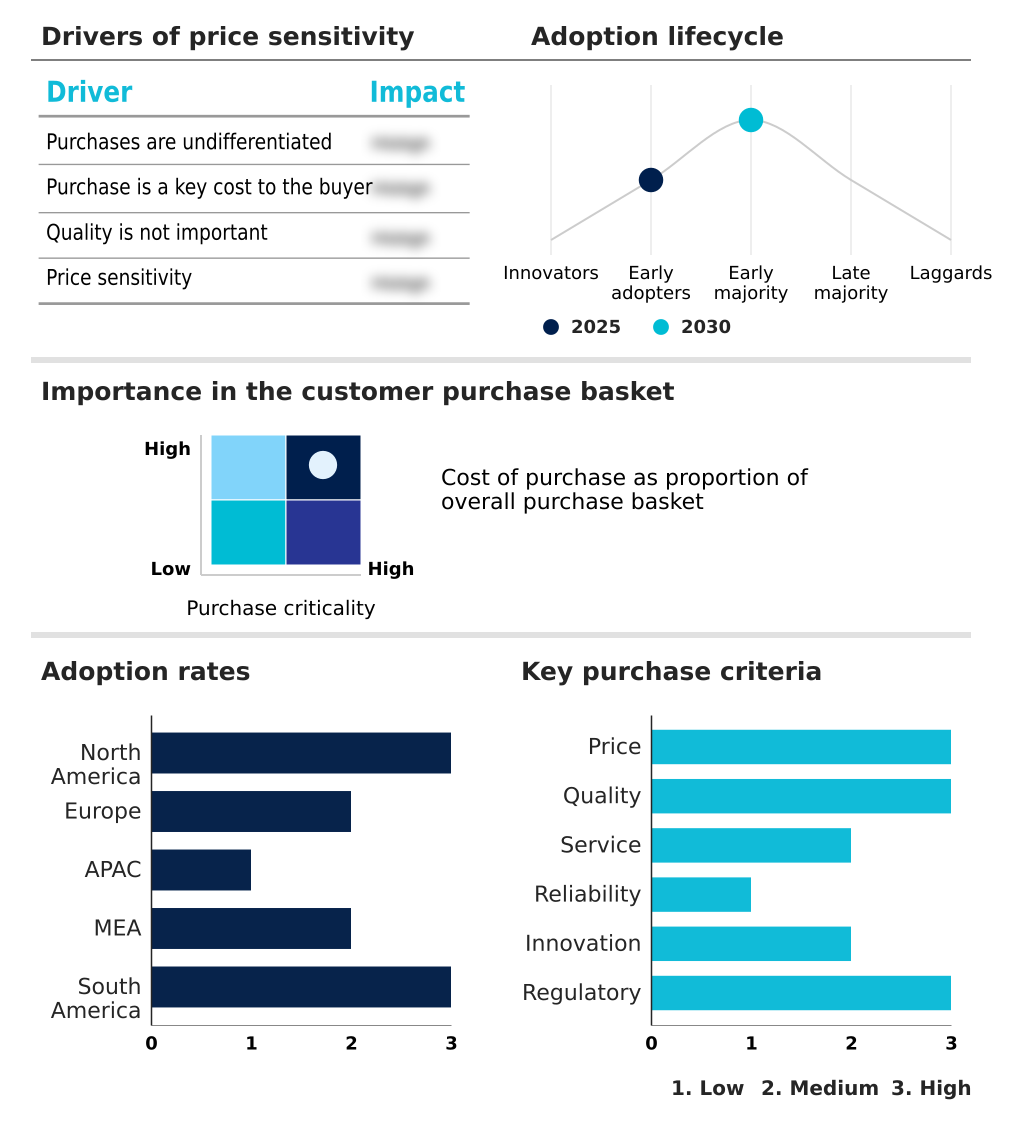
The car rental market forecasting report includes the adoption lifecycle of the market, covering from the innovator’s stage to the laggard’s stage. It focuses on adoption rates in different regions based on penetration. Furthermore, the car rental market report also includes key purchase criteria and drivers of price sensitivity to help companies evaluate and develop their market growth analysis strategies.

Customer Landscape of Car Rental Industry

Competitive Landscape

Companies are implementing various strategies, such as strategic alliances, car rental market forecast, partnerships, mergers and acquisitions, geographical expansion, and product/service launches, to enhance their presence in the industry.

ACE Rent A Car Reservations Inc - The global booking platform aggregates multiple rental brands, offering extensive car rental services across 180 countries to enhance market access for consumers and partners.

The industry research and growth report includes detailed analyses of the competitive landscape of the market and information about key companies, including:

  • ACE Rent A Car Reservations Inc
  • AutoEurope LLC
  • Avis Budget Group Inc.
  • eHi Car Services Ltd.
  • Enterprise Holdings Inc.
  • Europcar Group UK Ltd.
  • Europcar Mobility Group SA
  • Green Motion International
  • Hertz Global Holdings Inc.
  • Nippon Rent A Car Service Inc.
  • Orix Corp.
  • Primemover Mobility Pvt. Ltd.
  • Record Go Alquiler Vacacional
  • SIXT SE
  • SK Rent a Car
  • Thrifty Car Rental
  • TIMES MOBILITY CO LTD
  • Toyota Rent A Lease
  • Unidas Locadora S.A
  • Zoomcar India Pvt. Ltd.

Qualitative and quantitative analysis of companies has been conducted to help clients understand the wider business environment as well as the strengths and weaknesses of key industry players. Data is qualitatively analyzed to categorize companies as pure play, category-focused, industry-focused, and diversified; it is quantitatively analyzed to categorize companies as dominant, leading, strong, tentative, and weak.

Recent Development and News in Car rental market

  • In July 2025, Baidu's Apollo unit partnered with CAR Inc. to introduce a fully autonomous car rental service, allowing users to book and operate self-driving vehicles via a mobile application.
  • In November 2025, Omani entrepreneurs launched Ajarlee, Oman's first native car rental application, enhancing digital access to local rental providers and supporting the nation's technology-driven mobility strategy.
  • In December 2025, RateGain Travel Technologies released Rev AI Clarity, an artificial intelligence-powered revenue assistant designed for car rental companies to convert complex data into actionable insights for fleet and revenue management.
  • In February 2025, the American Vehicle Owners Alliance was established with founding members from the car rental sector to advocate for secure access to vehicle-generated data, promoting consumer rights and competition.

Dive into Technavio’s robust research methodology, blending expert interviews, extensive data synthesis, and validated models for unparalleled Car Rental Market insights. See full methodology.

Market Scope
Page number 298
Base year 2025
Historic period 2020-2024
Forecast period 2026-2030
Growth momentum & CAGR Accelerate at a CAGR of 10.2%
Market growth 2026-2030 USD 83853.4 million
Market structure Fragmented
YoY growth 2025-2026(%) 9.2%
Key countries US, Canada, Mexico, Germany, France, UK, Italy, Spain, The Netherlands, China, Japan, Australia, India, South Korea, Indonesia, Saudi Arabia, UAE, South Africa, Israel, Turkey, Brazil, Argentina and Chile
Competitive landscape Leading Companies, Market Positioning of Companies, Competitive Strategies, and Industry Risks

Request Free Sample

Research Analyst Overview

  • The car rental market is evolving into a technology-driven mobility ecosystem where competitive advantage is dictated by operational intelligence and asset efficiency. Core to this shift is the application of telematics data analytics for fleet utilization optimization and predictive maintenance scheduling, directly impacting boardroom decisions on capital expenditure and residual value risk management.
  • The integration of AI-powered revenue management and dynamic pricing algorithms has become standard, while contactless vehicle access via digital key solutions and biometric authentication is redefining the customer journey. Operators are expanding beyond traditional models, embracing subscription-based mobility, peer-to-peer (P2P) carsharing, and mobility-as-a-service (MaaS) integration with multi-modal travel platforms.
  • The transition to software-defined vehicles and connected car platforms with advanced driver-assistance systems (ADAS) is critical, especially as fleets incorporate more electric vehicle (EV) charging infrastructure and battery health monitoring.
  • Firms that successfully leverage IoT-enabled fleet management, smart mobility solutions, and vehicle telematics systems for everything from one-way rental logistics to managing corporate fleet leasing and corporate travel management are achieving superior performance.
  • Integration with online travel agencies (OTAs) and effective customer relationship management (CRM) and loyalty program management through digital payment gateways are essential for market leadership, particularly as the industry prepares for autonomous vehicle rental and vehicle-to-grid (V2G) technology. The industry's transformation to automated vehicle inspection has reduced vehicle downtime by 15%, enhancing fleet readiness.
  • The future also includes chauffeur-driven services and demand forecasting models.

What are the Key Data Covered in this Car Rental Market Research and Growth Report?

  • What is the expected growth of the Car Rental Market between 2026 and 2030?

    • USD 83.85 billion, at a CAGR of 10.2%

  • What segmentation does the market report cover?

    • The report is segmented by Mode of Booking (Offline, and Online), Rental Category (Airport transport, Local transport, Outstation transport, and Others), Type (Economy cars, Executive cars, Luxury cars, SUVs, and MUVs) and Geography (North America, Europe, APAC, Middle East and Africa, South America)

  • Which regions are analyzed in the report?

    • North America, Europe, APAC, Middle East and Africa and South America

  • What are the key growth drivers and market challenges?

    • Rise in vehicle ownership cost, Rising number of car-sharing services

  • Who are the major players in the Car Rental Market?

    • ACE Rent A Car Reservations Inc, AutoEurope LLC, Avis Budget Group Inc., eHi Car Services Ltd., Enterprise Holdings Inc., Europcar Group UK Ltd., Europcar Mobility Group SA, Green Motion International, Hertz Global Holdings Inc., Nippon Rent A Car Service Inc., Orix Corp., Primemover Mobility Pvt. Ltd., Record Go Alquiler Vacacional, SIXT SE, SK Rent a Car, Thrifty Car Rental, TIMES MOBILITY CO LTD, Toyota Rent A Lease, Unidas Locadora S.A and Zoomcar India Pvt. Ltd.

Market Research Insights

  • The market's dynamism is driven by the rapid adoption of digital solutions and evolving consumer expectations for urban mobility services. The proliferation of the on-demand car rental app has become central to customer acquisition, with platforms offering contactless car pickup reducing customer processing times by over 40%.
  • This shift toward sustainable transportation rental is evident as operators offering electric vehicle rental options see a 15% higher booking rate in environmentally conscious urban centers. Corporate car leasing solutions are also transforming, with businesses leveraging long-term car rental subscription models that provide greater financial flexibility than traditional ownership.
  • This asset-light approach, which offers cost savings of up to 20% on fleet management, is becoming a strategic imperative for companies navigating economic uncertainties while demanding flexible vehicle hire.

We can help! Our analysts can customize this car rental market research report to meet your requirements.

Get in touch

1. Executive Summary

1.1 Market overview

Executive Summary - Chart on Market Overview
Executive Summary - Data Table on Market Overview
Executive Summary - Chart on Global Market Characteristics
Executive Summary - Chart on Market by Geography
Executive Summary - Chart on Market Segmentation by Mode of Booking
Executive Summary - Chart on Market Segmentation by Rental Category
Executive Summary - Chart on Market Segmentation by Type
Executive Summary - Chart on Incremental Growth
Executive Summary - Data Table on Incremental Growth
Executive Summary - Chart on Company Market Positioning

2. Technavio Analysis

2.1 Analysis of price sensitivity, lifecycle, customer purchase basket, adoption rates, and purchase criteria

2.2 Criticality of inputs and Factors of differentiation

Chart on Overview on criticality of inputs and factors of differentiation

2.3 Factors of disruption

Chart on Overview on factors of disruption

2.4 Impact of drivers and challenges

Chart on Impact of drivers and challenges in 2025 and 2030

3. Market Landscape

3.1 Market ecosystem

Chart on Parent Market
Data Table on - Parent Market

3.2 Market characteristics

Chart on Market characteristics analysis

3.3 Value chain analysis

Chart on Value chain analysis

4. Market Sizing

4.1 Market definition

Data Table on Offerings of companies included in the market definition

4.2 Market segment analysis

Market segments

4.3 Market size 2025

4.4 Market outlook: Forecast for 2025-2030

Chart on Global - Market size and forecast 2025-2030 ($ million)
Data Table on Global - Market size and forecast 2025-2030 ($ million)
Chart on Global Market: Year-over-year growth 2025-2030 (%)
Data Table on Global Market: Year-over-year growth 2025-2030 (%)

5. Historic Market Size

5.1 Global Car Rental Market 2020 - 2024

Historic Market Size - Data Table on Global Car Rental Market 2020 - 2024 ($ million)

5.2 Mode of Booking segment analysis 2020 - 2024

Historic Market Size - Mode of Booking Segment 2020 - 2024 ($ million)

5.3 Rental Category segment analysis 2020 - 2024

Historic Market Size - Rental Category Segment 2020 - 2024 ($ million)

5.4 Type segment analysis 2020 - 2024

Historic Market Size - Type Segment 2020 - 2024 ($ million)

5.5 Geography segment analysis 2020 - 2024

Historic Market Size - Geography Segment 2020 - 2024 ($ million)

5.6 Country segment analysis 2020 - 2024

Historic Market Size - Country Segment 2020 - 2024 ($ million)

6. Qualitative Analysis

6.1 The Impact of AI on the Global Car Rental Market

7. Five Forces Analysis

7.1 Five forces summary

Five forces analysis - Comparison between 2025 and 2030

7.2 Bargaining power of buyers

Bargaining power of buyers - Impact of key factors 2025 and 2030

7.3 Bargaining power of suppliers

Bargaining power of suppliers - Impact of key factors in 2025 and 2030

7.4 Threat of new entrants

Threat of new entrants - Impact of key factors in 2025 and 2030

7.5 Threat of substitutes

Threat of substitutes - Impact of key factors in 2025 and 2030

7.6 Threat of rivalry

Threat of rivalry - Impact of key factors in 2025 and 2030

7.7 Market condition

Chart on Market condition - Five forces 2025 and 2030

8. Market Segmentation by Mode of Booking

8.1 Market segments

Chart on Mode of Booking - Market share 2025-2030 (%)
Data Table on Mode of Booking - Market share 2025-2030 (%)

8.2 Comparison by Mode of Booking

Chart on Comparison by Mode of Booking
Data Table on Comparison by Mode of Booking

8.3 Offline - Market size and forecast 2025-2030

Chart on Offline - Market size and forecast 2025-2030 ($ million)
Data Table on Offline - Market size and forecast 2025-2030 ($ million)
Chart on Offline - Year-over-year growth 2025-2030 (%)
Data Table on Offline - Year-over-year growth 2025-2030 (%)

8.4 Online - Market size and forecast 2025-2030

Chart on Online - Market size and forecast 2025-2030 ($ million)
Data Table on Online - Market size and forecast 2025-2030 ($ million)
Chart on Online - Year-over-year growth 2025-2030 (%)
Data Table on Online - Year-over-year growth 2025-2030 (%)

8.5 Market opportunity by Mode of Booking

Market opportunity by Mode of Booking ($ million)
Data Table on Market opportunity by Mode of Booking ($ million)

9. Market Segmentation by Rental Category

9.1 Market segments

Chart on Rental Category - Market share 2025-2030 (%)
Data Table on Rental Category - Market share 2025-2030 (%)

9.2 Comparison by Rental Category

Chart on Comparison by Rental Category
Data Table on Comparison by Rental Category

9.3 Airport transport - Market size and forecast 2025-2030

Chart on Airport transport - Market size and forecast 2025-2030 ($ million)
Data Table on Airport transport - Market size and forecast 2025-2030 ($ million)
Chart on Airport transport - Year-over-year growth 2025-2030 (%)
Data Table on Airport transport - Year-over-year growth 2025-2030 (%)

9.4 Local transport - Market size and forecast 2025-2030

Chart on Local transport - Market size and forecast 2025-2030 ($ million)
Data Table on Local transport - Market size and forecast 2025-2030 ($ million)
Chart on Local transport - Year-over-year growth 2025-2030 (%)
Data Table on Local transport - Year-over-year growth 2025-2030 (%)

9.5 Outstation transport - Market size and forecast 2025-2030

Chart on Outstation transport - Market size and forecast 2025-2030 ($ million)
Data Table on Outstation transport - Market size and forecast 2025-2030 ($ million)
Chart on Outstation transport - Year-over-year growth 2025-2030 (%)
Data Table on Outstation transport - Year-over-year growth 2025-2030 (%)

9.6 Others - Market size and forecast 2025-2030

Chart on Others - Market size and forecast 2025-2030 ($ million)
Data Table on Others - Market size and forecast 2025-2030 ($ million)
Chart on Others - Year-over-year growth 2025-2030 (%)
Data Table on Others - Year-over-year growth 2025-2030 (%)

9.7 Market opportunity by Rental Category

Market opportunity by Rental Category ($ million)
Data Table on Market opportunity by Rental Category ($ million)

10. Market Segmentation by Type

10.1 Market segments

Chart on Type - Market share 2025-2030 (%)
Data Table on Type - Market share 2025-2030 (%)

10.2 Comparison by Type

Chart on Comparison by Type
Data Table on Comparison by Type

10.3 Economy cars - Market size and forecast 2025-2030

Chart on Economy cars - Market size and forecast 2025-2030 ($ million)
Data Table on Economy cars - Market size and forecast 2025-2030 ($ million)
Chart on Economy cars - Year-over-year growth 2025-2030 (%)
Data Table on Economy cars - Year-over-year growth 2025-2030 (%)

10.4 Executive cars - Market size and forecast 2025-2030

Chart on Executive cars - Market size and forecast 2025-2030 ($ million)
Data Table on Executive cars - Market size and forecast 2025-2030 ($ million)
Chart on Executive cars - Year-over-year growth 2025-2030 (%)
Data Table on Executive cars - Year-over-year growth 2025-2030 (%)

10.5 Luxury cars - Market size and forecast 2025-2030

Chart on Luxury cars - Market size and forecast 2025-2030 ($ million)
Data Table on Luxury cars - Market size and forecast 2025-2030 ($ million)
Chart on Luxury cars - Year-over-year growth 2025-2030 (%)
Data Table on Luxury cars - Year-over-year growth 2025-2030 (%)

10.6 SUVs - Market size and forecast 2025-2030

Chart on SUVs - Market size and forecast 2025-2030 ($ million)
Data Table on SUVs - Market size and forecast 2025-2030 ($ million)
Chart on SUVs - Year-over-year growth 2025-2030 (%)
Data Table on SUVs - Year-over-year growth 2025-2030 (%)

10.7 MUVs - Market size and forecast 2025-2030

Chart on MUVs - Market size and forecast 2025-2030 ($ million)
Data Table on MUVs - Market size and forecast 2025-2030 ($ million)
Chart on MUVs - Year-over-year growth 2025-2030 (%)
Data Table on MUVs - Year-over-year growth 2025-2030 (%)

10.8 Market opportunity by Type

Market opportunity by Type ($ million)
Data Table on Market opportunity by Type ($ million)

11. Customer Landscape

11.1 Customer landscape overview

Analysis of price sensitivity, lifecycle, customer purchase basket, adoption rates, and purchase criteria

12. Geographic Landscape

12.1 Geographic segmentation

Chart on Market share by geography 2025-2030 (%)
Data Table on Market share by geography 2025-2030 (%)

12.2 Geographic comparison

Chart on Geographic comparison
Data Table on Geographic comparison

12.3 North America - Market size and forecast 2025-2030

Chart on North America - Market size and forecast 2025-2030 ($ million)
Data Table on North America - Market size and forecast 2025-2030 ($ million)
Chart on North America - Year-over-year growth 2025-2030 (%)
Data Table on North America - Year-over-year growth 2025-2030 (%)
Chart on Regional Comparison - North America
Data Table on Regional Comparison - North America

12.3.1 US - Market size and forecast 2025-2030

Chart on US - Market size and forecast 2025-2030 ($ million)
Data Table on US - Market size and forecast 2025-2030 ($ million)
Chart on US - Year-over-year growth 2025-2030 (%)
Data Table on US - Year-over-year growth 2025-2030 (%)

12.3.2 Canada - Market size and forecast 2025-2030

Chart on Canada - Market size and forecast 2025-2030 ($ million)
Data Table on Canada - Market size and forecast 2025-2030 ($ million)
Chart on Canada - Year-over-year growth 2025-2030 (%)
Data Table on Canada - Year-over-year growth 2025-2030 (%)

12.3.3 Mexico - Market size and forecast 2025-2030

Chart on Mexico - Market size and forecast 2025-2030 ($ million)
Data Table on Mexico - Market size and forecast 2025-2030 ($ million)
Chart on Mexico - Year-over-year growth 2025-2030 (%)
Data Table on Mexico - Year-over-year growth 2025-2030 (%)

12.4 Europe - Market size and forecast 2025-2030

Chart on Europe - Market size and forecast 2025-2030 ($ million)
Data Table on Europe - Market size and forecast 2025-2030 ($ million)
Chart on Europe - Year-over-year growth 2025-2030 (%)
Data Table on Europe - Year-over-year growth 2025-2030 (%)
Chart on Regional Comparison - Europe
Data Table on Regional Comparison - Europe

12.4.1 Germany - Market size and forecast 2025-2030

Chart on Germany - Market size and forecast 2025-2030 ($ million)
Data Table on Germany - Market size and forecast 2025-2030 ($ million)
Chart on Germany - Year-over-year growth 2025-2030 (%)
Data Table on Germany - Year-over-year growth 2025-2030 (%)

12.4.2 France - Market size and forecast 2025-2030

Chart on France - Market size and forecast 2025-2030 ($ million)
Data Table on France - Market size and forecast 2025-2030 ($ million)
Chart on France - Year-over-year growth 2025-2030 (%)
Data Table on France - Year-over-year growth 2025-2030 (%)

12.4.3 UK - Market size and forecast 2025-2030

Chart on UK - Market size and forecast 2025-2030 ($ million)
Data Table on UK - Market size and forecast 2025-2030 ($ million)
Chart on UK - Year-over-year growth 2025-2030 (%)
Data Table on UK - Year-over-year growth 2025-2030 (%)

12.4.4 Italy - Market size and forecast 2025-2030

Chart on Italy - Market size and forecast 2025-2030 ($ million)
Data Table on Italy - Market size and forecast 2025-2030 ($ million)
Chart on Italy - Year-over-year growth 2025-2030 (%)
Data Table on Italy - Year-over-year growth 2025-2030 (%)

12.4.5 Spain - Market size and forecast 2025-2030

Chart on Spain - Market size and forecast 2025-2030 ($ million)
Data Table on Spain - Market size and forecast 2025-2030 ($ million)
Chart on Spain - Year-over-year growth 2025-2030 (%)
Data Table on Spain - Year-over-year growth 2025-2030 (%)

12.4.6 The Netherlands - Market size and forecast 2025-2030

Chart on The Netherlands - Market size and forecast 2025-2030 ($ million)
Data Table on The Netherlands - Market size and forecast 2025-2030 ($ million)
Chart on The Netherlands - Year-over-year growth 2025-2030 (%)
Data Table on The Netherlands - Year-over-year growth 2025-2030 (%)

12.5 APAC - Market size and forecast 2025-2030

Chart on APAC - Market size and forecast 2025-2030 ($ million)
Data Table on APAC - Market size and forecast 2025-2030 ($ million)
Chart on APAC - Year-over-year growth 2025-2030 (%)
Data Table on APAC - Year-over-year growth 2025-2030 (%)
Chart on Regional Comparison - APAC
Data Table on Regional Comparison - APAC

12.5.1 China - Market size and forecast 2025-2030

Chart on China - Market size and forecast 2025-2030 ($ million)
Data Table on China - Market size and forecast 2025-2030 ($ million)
Chart on China - Year-over-year growth 2025-2030 (%)
Data Table on China - Year-over-year growth 2025-2030 (%)

12.5.2 Japan - Market size and forecast 2025-2030

Chart on Japan - Market size and forecast 2025-2030 ($ million)
Data Table on Japan - Market size and forecast 2025-2030 ($ million)
Chart on Japan - Year-over-year growth 2025-2030 (%)
Data Table on Japan - Year-over-year growth 2025-2030 (%)

12.5.3 Australia - Market size and forecast 2025-2030

Chart on Australia - Market size and forecast 2025-2030 ($ million)
Data Table on Australia - Market size and forecast 2025-2030 ($ million)
Chart on Australia - Year-over-year growth 2025-2030 (%)
Data Table on Australia - Year-over-year growth 2025-2030 (%)

12.5.4 India - Market size and forecast 2025-2030

Chart on India - Market size and forecast 2025-2030 ($ million)
Data Table on India - Market size and forecast 2025-2030 ($ million)
Chart on India - Year-over-year growth 2025-2030 (%)
Data Table on India - Year-over-year growth 2025-2030 (%)

12.5.5 South Korea - Market size and forecast 2025-2030

Chart on South Korea - Market size and forecast 2025-2030 ($ million)
Data Table on South Korea - Market size and forecast 2025-2030 ($ million)
Chart on South Korea - Year-over-year growth 2025-2030 (%)
Data Table on South Korea - Year-over-year growth 2025-2030 (%)

12.5.6 Indonesia - Market size and forecast 2025-2030

Chart on Indonesia - Market size and forecast 2025-2030 ($ million)
Data Table on Indonesia - Market size and forecast 2025-2030 ($ million)
Chart on Indonesia - Year-over-year growth 2025-2030 (%)
Data Table on Indonesia - Year-over-year growth 2025-2030 (%)

12.6 Middle East and Africa - Market size and forecast 2025-2030

Chart on Middle East and Africa - Market size and forecast 2025-2030 ($ million)
Data Table on Middle East and Africa - Market size and forecast 2025-2030 ($ million)
Chart on Middle East and Africa - Year-over-year growth 2025-2030 (%)
Data Table on Middle East and Africa - Year-over-year growth 2025-2030 (%)
Chart on Regional Comparison - Middle East and Africa
Data Table on Regional Comparison - Middle East and Africa

12.6.1 Saudi Arabia - Market size and forecast 2025-2030

Chart on Saudi Arabia - Market size and forecast 2025-2030 ($ million)
Data Table on Saudi Arabia - Market size and forecast 2025-2030 ($ million)
Chart on Saudi Arabia - Year-over-year growth 2025-2030 (%)
Data Table on Saudi Arabia - Year-over-year growth 2025-2030 (%)

12.6.2 UAE - Market size and forecast 2025-2030

Chart on UAE - Market size and forecast 2025-2030 ($ million)
Data Table on UAE - Market size and forecast 2025-2030 ($ million)
Chart on UAE - Year-over-year growth 2025-2030 (%)
Data Table on UAE - Year-over-year growth 2025-2030 (%)

12.6.3 South Africa - Market size and forecast 2025-2030

Chart on South Africa - Market size and forecast 2025-2030 ($ million)
Data Table on South Africa - Market size and forecast 2025-2030 ($ million)
Chart on South Africa - Year-over-year growth 2025-2030 (%)
Data Table on South Africa - Year-over-year growth 2025-2030 (%)

12.6.4 Israel - Market size and forecast 2025-2030

Chart on Israel - Market size and forecast 2025-2030 ($ million)
Data Table on Israel - Market size and forecast 2025-2030 ($ million)
Chart on Israel - Year-over-year growth 2025-2030 (%)
Data Table on Israel - Year-over-year growth 2025-2030 (%)

12.6.5 Turkey - Market size and forecast 2025-2030

Chart on Turkey - Market size and forecast 2025-2030 ($ million)
Data Table on Turkey - Market size and forecast 2025-2030 ($ million)
Chart on Turkey - Year-over-year growth 2025-2030 (%)
Data Table on Turkey - Year-over-year growth 2025-2030 (%)

12.7 South America - Market size and forecast 2025-2030

Chart on South America - Market size and forecast 2025-2030 ($ million)
Data Table on South America - Market size and forecast 2025-2030 ($ million)
Chart on South America - Year-over-year growth 2025-2030 (%)
Data Table on South America - Year-over-year growth 2025-2030 (%)
Chart on Regional Comparison - South America
Data Table on Regional Comparison - South America

12.7.1 Brazil - Market size and forecast 2025-2030

Chart on Brazil - Market size and forecast 2025-2030 ($ million)
Data Table on Brazil - Market size and forecast 2025-2030 ($ million)
Chart on Brazil - Year-over-year growth 2025-2030 (%)
Data Table on Brazil - Year-over-year growth 2025-2030 (%)

12.7.2 Argentina - Market size and forecast 2025-2030

Chart on Argentina - Market size and forecast 2025-2030 ($ million)
Data Table on Argentina - Market size and forecast 2025-2030 ($ million)
Chart on Argentina - Year-over-year growth 2025-2030 (%)
Data Table on Argentina - Year-over-year growth 2025-2030 (%)

12.7.3 Chile - Market size and forecast 2025-2030

Chart on Chile - Market size and forecast 2025-2030 ($ million)
Data Table on Chile - Market size and forecast 2025-2030 ($ million)
Chart on Chile - Year-over-year growth 2025-2030 (%)
Data Table on Chile - Year-over-year growth 2025-2030 (%)

12.8 Market opportunity by geography

Market opportunity by geography ($ million)
Data Tables on Market opportunity by geography ($ million)

13. Drivers, Challenges, and Opportunity

13.1 Market drivers

Rise in vehicle ownership cost
Incorporation of advanced digital technologies in car rental services
Increasing demand for car rentals due to stringent regulations for controlling emissions

13.2 Market challenges

Rising number of car-sharing services
Growing adoption of car-hailing services
High cost of self-drive car rental

13.3 Impact of drivers and challenges

Impact of drivers and challenges in 2025 and 2030

13.4 Market opportunities

Advent of intermediaries in global car rental market
Online booking services offered by car rental services
Increasing use of advanced analytics for telematics data in car rental services

14. Competitive Landscape

14.1 Overview

14.2

Overview on criticality of inputs and factors of differentiation

14.3 Landscape disruption

Overview on factors of disruption

14.4 Industry risks

Impact of key risks on business

15. Competitive Analysis

15.1 Companies profiled

Companies covered

15.2 Company ranking index

15.3 Market positioning of companies

Matrix on companies position and classification

15.4 ACE Rent A Car Reservations Inc

ACE Rent A Car Reservations Inc - Overview
ACE Rent A Car Reservations Inc - Product / Service
ACE Rent A Car Reservations Inc - Key offerings
SWOT

15.5 AutoEurope LLC

AutoEurope LLC - Overview
AutoEurope LLC - Product / Service
AutoEurope LLC - Key offerings
SWOT

15.6 Avis Budget Group Inc.

Avis Budget Group Inc. - Overview
Avis Budget Group Inc. - Business segments
Avis Budget Group Inc. - Key offerings
Avis Budget Group Inc. - Segment focus
SWOT

15.7 Enterprise Holdings Inc.

Enterprise Holdings Inc. - Overview
Enterprise Holdings Inc. - Product / Service
Enterprise Holdings Inc. - Key offerings
SWOT

15.8 Europcar Group UK Ltd.

Europcar Group UK Ltd. - Overview
Europcar Group UK Ltd. - Product / Service
Europcar Group UK Ltd. - Key news
Europcar Group UK Ltd. - Key offerings
SWOT

15.9 Green Motion International

Green Motion International - Overview
Green Motion International - Product / Service
Green Motion International - Key offerings
SWOT

15.10 Hertz Global Holdings Inc.

Hertz Global Holdings Inc. - Overview
Hertz Global Holdings Inc. - Business segments
Hertz Global Holdings Inc. - Key news
Hertz Global Holdings Inc. - Key offerings
Hertz Global Holdings Inc. - Segment focus
SWOT

15.11 Nippon Rent A Car Service Inc.

Nippon Rent A Car Service Inc. - Overview
Nippon Rent A Car Service Inc. - Product / Service
Nippon Rent A Car Service Inc. - Key offerings
SWOT

15.12 Orix Corp.

Orix Corp. - Overview
Orix Corp. - Product / Service
Orix Corp. - Key offerings
SWOT

15.13 Primemover Mobility Pvt. Ltd.

Primemover Mobility Pvt. Ltd. - Overview
Primemover Mobility Pvt. Ltd. - Product / Service
Primemover Mobility Pvt. Ltd. - Key offerings
SWOT

15.14 Record Go Alquiler Vacacional

Record Go Alquiler Vacacional - Overview
Record Go Alquiler Vacacional - Product / Service
Record Go Alquiler Vacacional - Key offerings
SWOT

15.15 SK Rent a Car

SK Rent a Car - Overview
SK Rent a Car - Product / Service
SK Rent a Car - Key offerings
SWOT

15.16 TIMES MOBILITY CO LTD

TIMES MOBILITY CO LTD - Overview
TIMES MOBILITY CO LTD - Product / Service
TIMES MOBILITY CO LTD - Key offerings
SWOT

15.17 Unidas Locadora S.A

Unidas Locadora S.A - Overview
Unidas Locadora S.A - Product / Service
Unidas Locadora S.A - Key offerings
SWOT

15.18 Zoomcar India Pvt. Ltd.

Zoomcar India Pvt. Ltd. - Overview
Zoomcar India Pvt. Ltd. - Product / Service
Zoomcar India Pvt. Ltd. - Key offerings
SWOT

16. Appendix

16.1 Scope of the report

Market definition
Objectives
Notes and caveats

16.2 Inclusions and exclusions checklist

Inclusions checklist
Exclusions checklist

16.3 Currency conversion rates for US$

16.4 Research methodology

16.5 Data procurement

Information sources

16.6 Data validation

16.7 Validation techniques employed for market sizing

16.8 Data synthesis

16.9 360 degree market analysis

16.10 List of abbreviations

Research Methodology

Technavio presents a detailed picture of the market by way of study, synthesis, and summation of data from multiple sources. The analysts have presented the various facets of the market with a particular focus on identifying the key industry influencers. The data thus presented is comprehensive, reliable, and the result of extensive research, both primary and secondary.

INFORMATION SOURCES

Primary sources

  • Manufacturers and suppliers
  • Channel partners
  • Industry experts
  • Strategic decision makers

Secondary sources

  • Industry journals and periodicals
  • Government data
  • Financial reports of key industry players
  • Historical data
  • Press releases

DATA ANALYSIS

Data Synthesis

  • Collation of data
  • Estimation of key figures
  • Analysis of derived insights

Data Validation

  • Triangulation with data models
  • Reference against proprietary databases
  • Corroboration with industry experts

REPORT WRITING

Qualitative

  • Market drivers
  • Market challenges
  • Market trends
  • Five forces analysis

Quantitative

  • Market size and forecast
  • Market segmentation
  • Geographical insights
  • Competitive landscape

Interested in this report?

Get your sample now to see our research methodology and insights!

Download Now

Frequently Asked Questions

Car Rental market growth will increase by USD 83853.4 million during 2026-2030.

The Car Rental market is expected to grow at a CAGR of 10.2% during 2026-2030.

Car Rental market is segmented by Mode of booking (Offline, Online) Rental category (Airport transport, Local transport, Outstation transport, Others) Type (Economy cars, Executive cars, Luxury cars, SUVs, MUVs)

ACE Rent A Car Reservations Inc, AutoEurope LLC, Avis Budget Group Inc., eHi Car Services Ltd., Enterprise Holdings Inc., Europcar Group UK Ltd., Europcar Mobility Group SA, Green Motion International, Hertz Global Holdings Inc., Nippon Rent A Car Service Inc., Orix Corp., Primemover Mobility Pvt. Ltd., Record Go Alquiler Vacacional, SIXT SE, SK Rent a Car, Thrifty Car Rental, TIMES MOBILITY CO LTD, Toyota Rent A Lease, Unidas Locadora S.A, Zoomcar India Pvt. Ltd. are a few of the key vendors in the Car Rental market.

North America will register the highest growth rate of 42% among the other regions. Therefore, the Car Rental market in North America is expected to garner significant business opportunities for the vendors during the forecast period.

US, Canada, Mexico, Germany, France, UK, Italy, Spain, The Netherlands, China, Japan, Australia, India, South Korea, Indonesia, Saudi Arabia, UAE, South Africa, Israel, Turkey, Brazil, Argentina, Chile

  • Rise in vehicle ownership cost is the driving factor this market.

The Car Rental market vendors should focus on grabbing business opportunities from the Mode of booking segment as it accounted for the largest market share in the base year.