
Self Drive Market Size 2025-2029
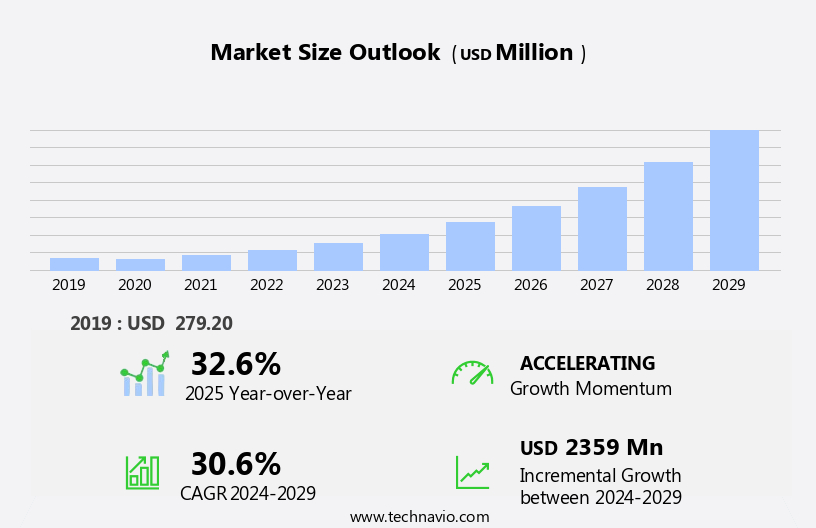
The self drive market size is forecast to increase by USD 2.36 billion, at a CAGR of 30.6% between 2024 and 2029.
- The market is experiencing significant growth due to several key trends. One notable trend is the increasing interest in self-driving vehicles, which offer travellers greater convenience and flexibility. Another trend is the integration of telematics technology in self-drive car rentals, enabling real-time vehicle tracking and monitoring. However, the high cost of self-driving car rentals remains a challenge for market growth. Despite this, the market is expected to continue expanding as technology advances and becomes more affordable. The use of telematics in self-drive car rentals offers numerous benefits, such as improved safety, reduced insurance costs, and enhanced customer experience.
- Car rental services cater to intercity and intracity travel, offering inexpensive alternatives to private automobiles for tourists and business travellers alike. However, the high initial investment required for implementing telematics technology and the high cost of self-driving vehicles are major obstacles for market growth. Overall, the self-drive car rental market is poised for growth, driven by the increasing popularity of self-driving vehicles and the integration of telematics technology.
What will be the Size of the Self Drive Market During the Forecast Period?
- The market represents a significant and dynamic sector within the global mobility industry. This market caters to both tourism and commuting needs, offering short-term and long-term rental options for various vehicle types, including hatchbacks, sedans, SUVs, MUVs, and standard, and luxury models. The market is organized and unorganized, with both online and offline channels serving customers' diverse preferences. Millennials, as a major demographic, are driving growth In the market due to their increasing demand for flexible, cost-effective, and convenient mobility solutions. The market's size is substantial, with millions of transactions occurring annually, especially at airports and tourist destinations.
- Mobility infrastructure plays a crucial role In the market's development, with Wi-Fi networks, entertainment systems, GPS systems, and insurance plans enhancing the rental experience. The market's direction is towards greater customization and integration of technology, enabling customers to easily compare prices, book vehicles, and manage their rentals online. The market's continued expansion is driven by the evolving needs of consumers, who seek efficient, flexible, and affordable mobility solutions.
How is this Self Drive Industry segmented and which is the largest segment?
The self drive industry research report provides comprehensive data (region-wise segment analysis), with forecasts and estimates in "USD billion" for the period 2025-2029, as well as historical data from 2019-2023 for the following segments.
- Vehicle Type
- Economic cars
- Luxury cars
- Mode Of Booking
- Offline
- Online
- Type
- Short-term rentals
- Long-term rentals
- Application
- Leisure and vacation travel
- Corporate and business use
- Airport rentals
- Intercity and intracity rentals
- Subscription and leasing services
- Geography
- North America
- Canada
- US
- Europe
- Germany
- UK
- France
- Italy
- Spain
- APAC
- China
- Japan
- South America
- Middle East and Africa
- North America
By Vehicle Type Insights
The economic cars segment is estimated to witness significant growth during the forecast period. Self-drive car rentals, particularly those offering economic cars, have gained significant traction in both the tourism and commuting sectors. Millennials, in particular, prefer this mobility option due to its convenience and affordability. Online and offline channels, including websites, mobile applications, and e-booking services, facilitate easy booking. New-age startups have disrupted the car rental sector with custom services, after-sale support, and complementary offerings such as Wi-Fi networks, entertainment systems, and GPS systems. The organized market dominates, but the unorganized sector also plays a role, especially in rural areas. Short-term and long-term rental options cater to various consumer needs. Tourists, service professionals, and corporate offices are significant consumers.
The tourism sector, with international, tourist, and foreign tourist arrivals, drives demand for car rentals at tourist destinations. National highways and road transportation infrastructure development further boost the market. Insurance options are crucial for consumers. Self-drive car rental services offer a range of ownership and lease contracts, allowing customers to choose based on their requirements. Companies provide a diverse car portfolio, including hatchbacks, sedans, SUVs, MUVs, luxury cars, and economy cars. Quick getaways and weekend trips are popular use cases. Tech-savvy consumers prefer booking channels like online portals and mobile applications for their convenience. Intercity and intracity travel, as well as airport transport, are common applications.
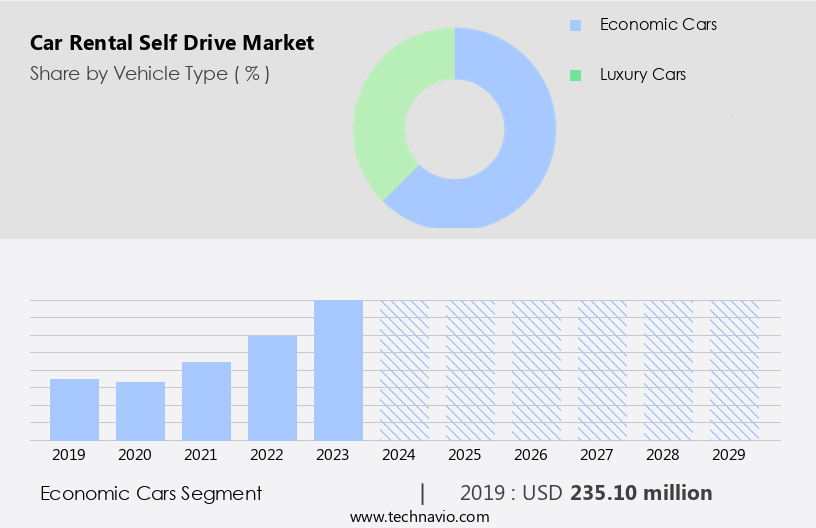
Get a glance at the market report of share of various segments Request Free Sample
The economic cars segment was valued at USD 235.10 million in 2019 and showed a gradual increase during the forecast period.
Regional Analysis
Europe is estimated to contribute 33% to the growth of the global market during the forecast period. Technavio's analysts have elaborately explained the regional trends and drivers that shape the market during the forecast period.
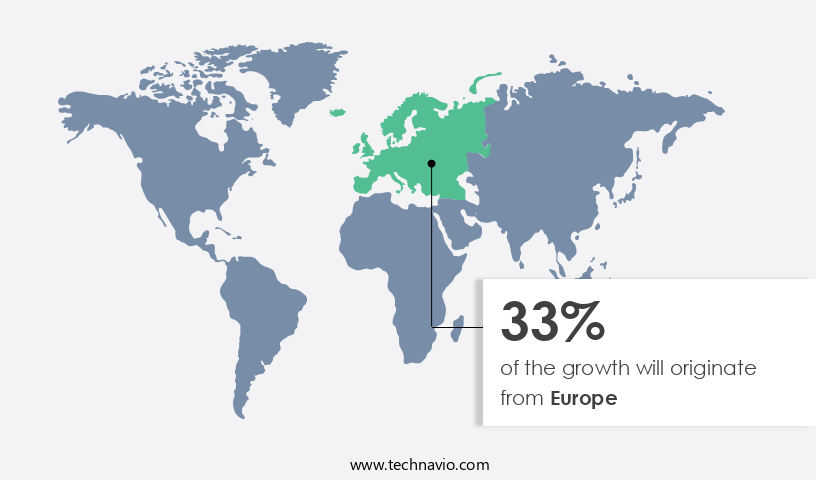
For more insights on the market size of various regions, Request Free Sample
The North American market holds a substantial share of the global industry, driven by the increasing demand for autonomous vehicles and a supportive regulatory environment. Consumers are increasingly drawn to the convenience and safety benefits of self-driving cars, particularly for long-distance travel, fueling market growth. The region's dominance is further bolstered by the presence of major market players and the rising urban and millennial populations. Tourism and commuting sectors, including international and tourist arrivals, also contribute significantly to the market's growth. Infrastructure development, such as national highways and mobility infrastructure, enhances accessibility and convenience, further boosting demand. Car rental services cater to various segments, including hatchbacks, sedans, SUVs, MUVs, and luxury vehicles, offering custom services, after-sale support, and complementary offerings like Wi-Fi networks, entertainment systems, and GPS systems. Insurance options, online and offline booking channels, and new-age startups add to the market's competitive landscape.
Market Dynamics
Our researchers analyzed the data with 2024 as the base year, along with the key drivers, trends, and challenges. A holistic analysis of drivers will help companies refine their marketing strategies to gain a competitive advantage.
What are the key market drivers leading to the rise In the adoption of Self Drive Industry?
- Growing interest in self-driving vehicles is the key driver of the market. The market, encompassing both online and offline channels, caters to the tourism and commuting needs of consumers through short-term and long-term rentals. This sector appeals to the millennial population, who prioritize personal mobility and value inexpensive travel options. The market consists of organized and unorganized players, offering a diverse car portfolio, including hatchbacks, sedans, SUVs, MUVs, standard and luxury vehicles. The tourism sector, fueled by international, tourist, and foreign tourist arrivals, significantly contributes to the demand for car rental services. Road transportation infrastructure and national highways facilitate the growth of this market. New-age startups and established players provide e-booking services through websites and mobile applications, offering custom services, after-sale services, complementary services, and insurance options.
- The urban population's increasing preference for tech-savvy booking channels, such as online portals, has led to a rise in demand for car rental services. The market caters to intercity and intracity travelers, providing daily packages, weekly packages, and lease contracts for personal usage, airport transport, local tourist destinations, quick getaways, and outstation travel. Car rental services cater to various segments, including corporate offices, service professionals, tourists, and private automobile owners. Wi-Fi networks, entertainment systems, GPS systems, and insurance plans are some of the complementary services offered to enhance the consumer experience. Car rental companies also provide airport transportation, economy cars, executive cars, and MUVs/SUVs for intercity and intra-city travel.
What are the market trends shaping the Self Drive Industry?
- The use of telematics in self-drive car rentals is the upcoming market trend. Self drive car rentals in the market are witnessing significant advancements with the integration of telematics technology. This innovation provides real-time data on vehicle location, speed, and condition, enabling rental companies to monitor mileage, fuel consumption, and identify potential issues. Telematics also ensures adherence to traffic laws and rental guidelines. The implementation of telematics has streamlined the rental process, offering automated check-in and check-out, and simplifying payment procedures. The car rental sector caters to both tourism and commuting needs, with short-term and long-term rentals. Millennials, a significant population segment, prefer personal mobility solutions, making car rentals an attractive option.
- The market consists of both organized and unorganized players, offering various fleet options such as Hatchbacks, Sedans, SUVs, MUVs, Standard, and Luxury cars. Car rental services cater to both intercity and intracity travelers, with demand predominantly on weekends. Tech-savvy consumers increasingly rely on online portals, mobile applications, and e-booking services for convenience. New-age startups are disrupting the market with custom services, after-sale services, complementary services, and insurance options. The tourism sector, with international, tourist, and foreign tourist arrivals, contributes significantly to the demand for car rentals. The mobility infrastructure, including national highways and airport transportation, also influences the market's growth.
What challenges does the Self Drive Industry face during its growth?
- The high cost of self-driving car rental is a key challenge affecting the industry growth. Self drive car rentals are a popular choice for tourism and commuting, with both short-term and long-term options available. The car rental sector caters to various consumer segments, including millennials and service professionals, in both urban and rural areas. Online platforms, such as websites and mobile applications, offer e-booking services for car rental, making the process more convenient for tech-savvy consumers. New-age startups have disrupted the market with custom services, after-sale services, and complementary services like Wi-Fi networks, entertainment systems, and GPS systems. The car rental portfolio includes a wide range of vehicles, from economy cars to luxury cars, SUVs, MUVs, Hatchbacks, Sedans, and more.
- The rates vary depending on the type of car, booking period, and location. In popular tourist destinations or during peak travel times, prices tend to be higher due to increased demand. Mandatory insurance is another significant cost factor. Insurance plans offer various options, including daily packages, weekly packages, and lease contracts. Car rental services are essential for intercity and intracity travel, airport transportation, and outstation trips. The mobility infrastructure and road transportation infrastructure play a crucial role in the car rental market's growth. With the increasing urban population and the need for personal mobility, car rentals are an inexpensive travel alternative for tourists and locals alike.
Exclusive Customer Landscape
The self drive market forecasting report includes the adoption lifecycle of the market, covering from the innovator's stage to the laggard's stage. It focuses on adoption rates in different regions based on penetration. Furthermore, the self drive market report also includes key purchase criteria and drivers of price sensitivity to help companies evaluate and develop their market growth analysis strategies.
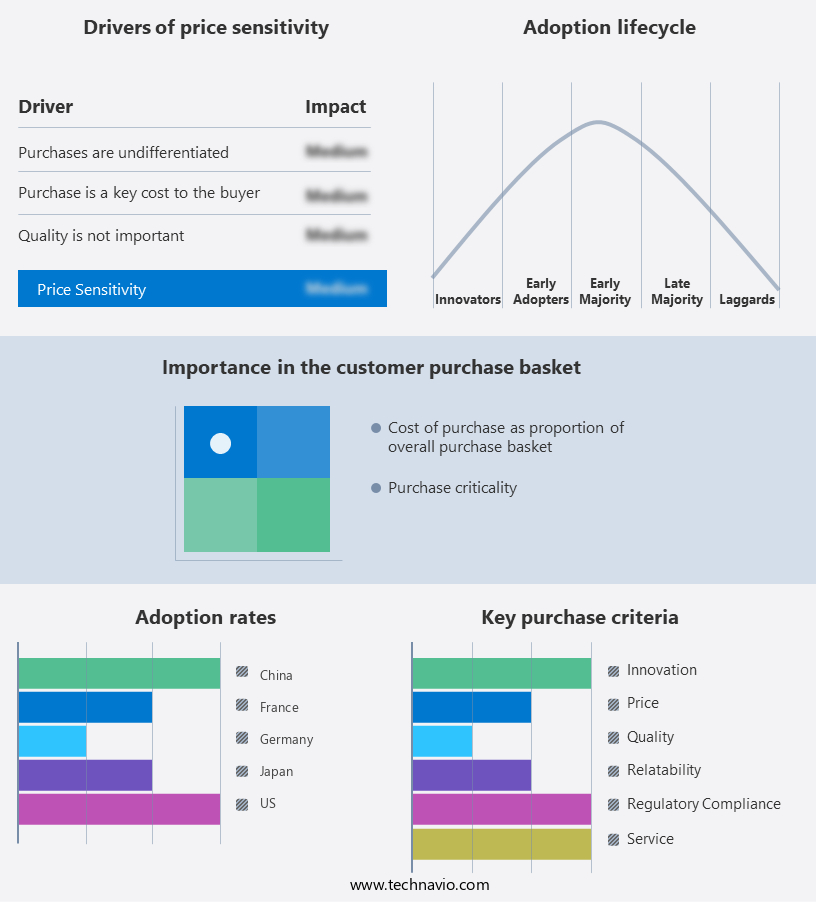
Customer Landscape
Key Companies & Market Insights
Companies are implementing various strategies, such as strategic alliances, self drive market forecast, partnerships, mergers and acquisitions, geographical expansion, and product/service launches, to enhance their presence In the industry.
Aspark Holidays Pvt. Ltd. - The company offers car rental services with car models such as Toyota Fortuner, Hyundai Creta, Honda City, Mahindra XUV500.
The industry research and growth report includes detailed analyses of the competitive landscape of the market and information about key companies, including:
- Aurora Innovation Inc.
- Autorent Car Rental LLC
- Avis Budget Group Inc.
- DriiveMe Ltd.
- Enterprise Holdings Inc.
- Hertz Global Holdings Inc.
- Localiza Rent a Car SA
- Primemover Mobility Technologies Pvt. Ltd.
- SIXT SE
- Volkswagen AG
- Waymo LLC
- Zoomcar India Pvt. Ltd.
Qualitative and quantitative analysis of companies has been conducted to help clients understand the wider business environment as well as the strengths and weaknesses of key industry players. Data is qualitatively analyzed to categorize companies as pure play, category-focused, industry-focused, and diversified; it is quantitatively analyzed to categorize companies as dominant, leading, strong, tentative, and weak.
Research Analyst Overview
The market caters to the tourism and commuting needs of consumers, offering both short-term and long-term solutions. This sector has gained significant traction due to the increasing millennial population and the evolving mobility infrastructure. The industry plays a pivotal role in facilitating personal mobility, particularly in urban areas. These services have become an integral part of the tourism sector, providing travelers with the convenience of exploring tourist destinations at their own pace. The influx of international arrivals and tourist arrivals has led to a rise in demand, particularly in popular tourist destinations.
Further, the market also caters to the transportation needs of the urban population, offering a cost-effective alternative to private automobiles. The availability of new-age startups and e-booking services has made them more accessible than ever before. The market can be segmented into organized and unorganized sectors. Organized players offer standardized services, including insurance options, custom services, after-sale services, and complementary services. They operate through websites, mobile applications, and corporate offices, providing consumers with a seamless booking experience. On the other hand, the unorganized sector operates through physical bookings and local tourist destinations. These players offer a more personalized service, catering to the specific needs of consumers.
Car rental services are not limited to inter-city travel. They also cater to intracity requirements, offering hatchbacks, sedans, SUVs, MUVs, economy cars, executive cars, and luxury cars for both short-term and long-term use. The sector is also expanding its offerings to include insurance plans, Wi-Fi networks, entertainment systems, GPS systems, and airport transport. These value-added services enhance the overall customer experience and differentiate players In the market. The industry is witnessing a shift towards tech-savvy booking channels, with online portals and mobile applications gaining popularity. This trend is particularly prominent among millennials, who prefer the convenience and ease of digital booking.
|
Market Scope |
|
|
Report Coverage |
Details |
|
Page number |
229 |
|
Base year |
2024 |
|
Historic period |
2019-2023 |
|
Forecast period |
2025-2029 |
|
Growth momentum & CAGR |
Accelerate at a CAGR of 30.6% |
|
Market Growth 2025-2029 |
USD 2.36 billion |
|
Market structure |
Concentrated |
|
YoY growth 2024-2025(%) |
32.6 |
|
Key countries |
US, Canada, Germany, France, UK, China, Australia, Italy, Spain, and Japan |
|
Competitive landscape |
Leading Companies, Market Positioning of Companies, Competitive Strategies, and Industry Risks |
What are the Key Data Covered in this Self Drive Market Research and Growth Report?
- CAGR of the self drive industry during the forecast period
- Detailed information on factors that will drive the market growth and forecasting between 2025 and 2029
- Precise estimation of the size of the market and its contribution of the industry in focus to the parent market
- Accurate predictions about upcoming growth and trends and changes in consumer behaviour
- Growth of the market across North America, Europe, APAC, South America, and Middle East and Africa
- Thorough analysis of the market's competitive landscape and detailed information about companies
- Comprehensive analysis of factors that will challenge the self drive market growth of industry companies
We can help! Our analysts can customize this self drive market research report to meet your requirements.
 RIA -
RIA - 
