
Carbon Capture And Storage (CCS) Market Size 2026-2030
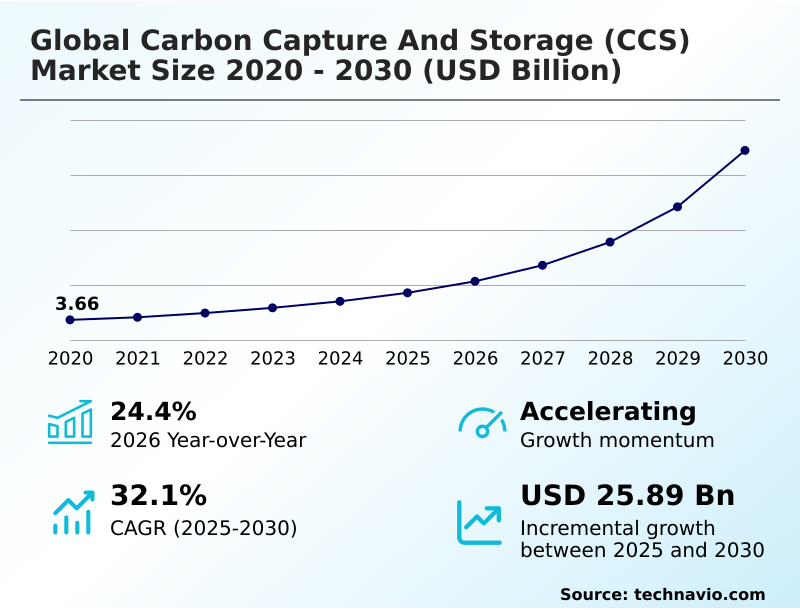
The carbon capture and storage (ccs) market size is valued to increase by USD 25.89 billion, at a CAGR of 32.1% from 2025 to 2030. Dependence on fossil fuels for generation of electricity will drive the carbon capture and storage (ccs) market.
Major Market Trends & Insights
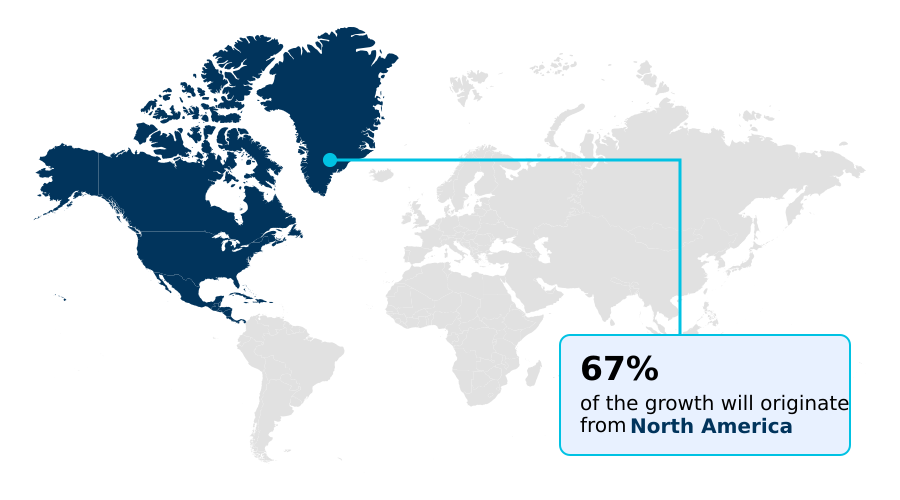
- North America dominated the market and accounted for a 67.1% growth during the forecast period.
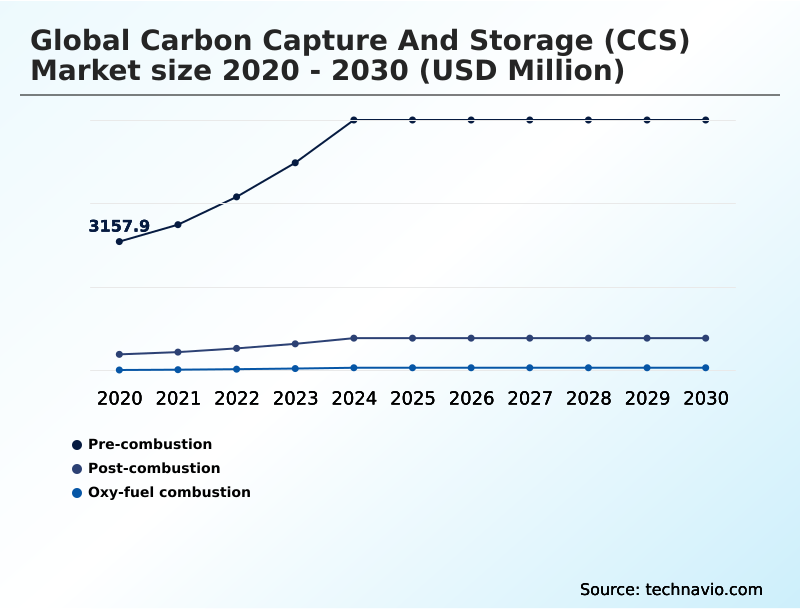
- By Technology - Pre-combustion segment was valued at USD 6.09 billion in 2024
- By Application - Enhanced oil recovery segment accounted for the largest market revenue share in 2024
Market Size & Forecast
- Market Opportunities: USD 30.81 billion
- Market Future Opportunities: USD 25.89 billion
- CAGR from 2025 to 2030 : 32.1%
Market Summary
- The carbon capture and storage (ccs) market represents a critical suite of technologies for mitigating industrial emissions. It is essential for sectors where decarbonization is challenging, such as cement, steel, and power generation. The market is propelled by stringent environmental regulations and the growing corporate commitment to net-zero industrial processes.
- A key driver is the need for hard-to-abate sectors to comply with evolving climate policies, including emission trading schemes and carbon taxes. For example, a cement manufacturer facing a rising carbon pricing mechanism must evaluate post-combustion capture as a strategic tool to maintain its license to operate and avoid financial penalties.
- This involves a complex assessment of the cost of carbon capture versus the risk of non-compliance. Market trends include the development of ccs hub and cluster models to share the high cost of co2 transport infrastructure and offshore co2 storage sites. Technological advancements are focused on reducing energy penalty and improving co2 capture efficiency.
- However, the industry faces challenges, including securing long-term financing, addressing public acceptance of ccs, and resolving the long-term storage liability associated with geological sequestration. These dynamics are shaping the path toward commercial-scale deployment.
What will be the Size of the Carbon Capture And Storage (CCS) Market during the forecast period?
Get Key Insights on Market Forecast (PDF) Get Free Sample
How is the Carbon Capture And Storage (CCS) Market Segmented?
The carbon capture and storage (ccs) industry research report provides comprehensive data (region-wise segment analysis), with forecasts and estimates in "USD million" for the period 2026-2030, as well as historical data from 2020-2024 for the following segments.
- Technology
- Pre-combustion
- Post-combustion
- Oxy-fuel combustion
- Application
- Enhanced oil recovery
- Geological storage
- Distribution channel
- Pipeline
- Ships
- End-user
- Power and oil and gas
- Manufacturing
- Geography
- North America
- US
- Canada
- Mexico
- APAC
- China
- Japan
- India
- Europe
- Germany
- UK
- France
- Middle East and Africa
- Saudi Arabia
- UAE
- South Africa
- South America
- Brazil
- Argentina
- Rest of World (ROW)
- North America
By Technology Insights
The pre-combustion segment is estimated to witness significant growth during the forecast period.
The pre-combustion segment is fundamental to the carbon capture and storage (ccs) market, focused on industrial processes that enable pre-combustion decarbonization. This technology is integral to low-carbon hydrogen production, a key component of the deep decarbonization pathway.
It involves converting fuel into a syngas where CO2 is separated before combustion, often using methods like cryogenic separation or chemical looping combustion.
This approach is crucial for new-build facilities, especially in industrial cluster decarbonization, as it allows for a higher co2 capture efficiency, often exceeding 90%.
The concentrated CO2 stream simplifies carbon capture utilization and subsequent pipeline transport for storage, making it an efficient method for industrial emissions reduction from a point source capture before it impacts the process of decarbonizing power generation.
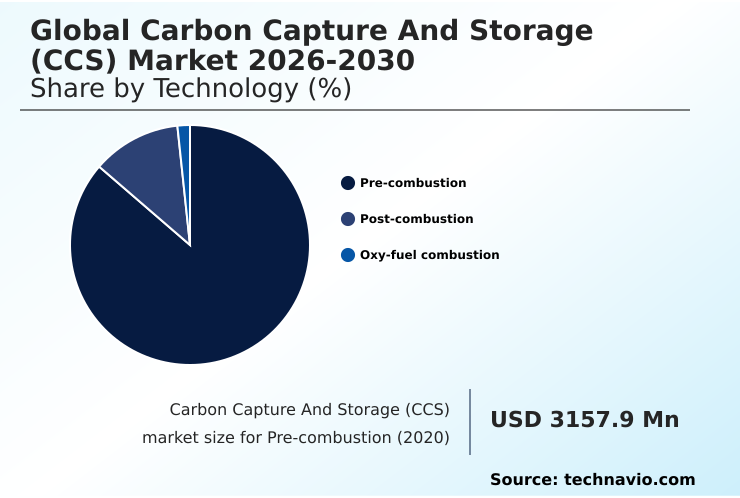
The Pre-combustion segment was valued at USD 6.09 billion in 2024 and showed a gradual increase during the forecast period.
Regional Analysis
North America is estimated to contribute 67.1% to the growth of the global market during the forecast period.Technavio’s analysts have elaborately explained the regional trends and drivers that shape the market during the forecast period.
See How Carbon Capture And Storage (CCS) Market Demand is Rising in North America Get Free Sample
North America leads the market, contributing over 67% of the incremental growth, driven by robust policy support and geological advantages for saline aquifer storage. This region has advanced co2 transport infrastructure, facilitating the decarbonization of heavy industry.
APAC is the fastest-growing region, with a focus on developing carbon management solutions and a complete co2 value chain to tackle rising industrial emissions.
Europe is pioneering cross-border co2 transport and storage networks, leveraging technologies like oxy-fuel combustion for its manufacturing sectors.
Across regions, there is a push to adopt advanced carbon abatement technology such as membrane-based separation and solid sorbent technology to lower the overall cost of carbon capture and improve industrial emissions reduction.
Continuous seismic monitoring of storage sites is becoming a global standard to ensure long-term safety.
Market Dynamics
Our researchers analyzed the data with 2025 as the base year, along with the key drivers, trends, and challenges. A holistic analysis of drivers will help companies refine their marketing strategies to gain a competitive advantage.
- Strategic planning in the carbon capture and storage (ccs) market requires a deep understanding of complex trade-offs. A primary consideration is the cost of carbon capture per ton, which directly influences project viability.
- This is closely linked to the debate over pre-combustion vs post-combustion ccs, as the efficiency of post-combustion capture systems must be weighed against the capital costs of new builds. The role of ccs in hydrogen economy is another critical factor, as it determines infrastructure priorities. For instance, the challenges of direct air capture technology are distinct from point-source capture.
- Decisions on siting are governed by the geological requirements for co2 storage sites and the public perception of carbon storage, which can be a significant hurdle. Furthermore, financing large scale ccs projects is complex, with the impact of 45q tax credit on ccs being a major variable in some regions.
- Technology selection is also granular, with choices between membrane technology for co2 separation and the solid sorbent capture process, or managing issues like amine solvent degradation in ccs. For industrial applications, specific solutions like ccs technology for cement plants or oxy-fuel combustion for power plants are being refined.
- The environmental risks of carbon sequestration necessitate stringent co2 pipeline safety standards and advanced monitoring techniques for stored co2. A modular carbon capture system design is proving to be over 20% more adaptable for smaller emitters than traditional large-scale installations. Ultimately, the long-term liability for co2 storage remains a key policy question, especially for ccs in developing economies.
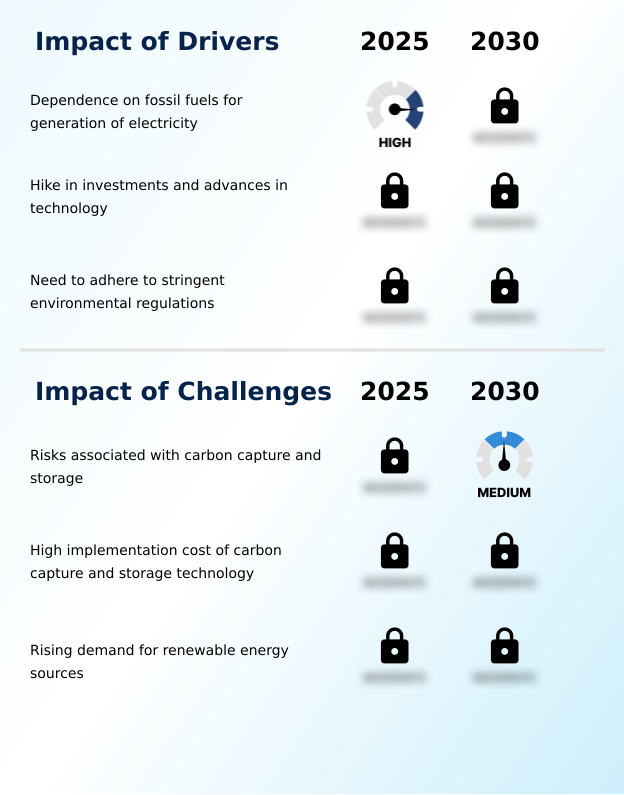
What are the key market drivers leading to the rise in the adoption of Carbon Capture And Storage (CCS) Industry?
- The market is primarily driven by the ongoing global dependence on fossil fuels for electricity generation, creating a critical need for emission mitigation technologies.
- Stringent environmental regulations are a significant driver, with mechanisms like a formal carbon pricing mechanism and emission trading schemes compelling action.
- Supportive policies, including the 45q tax credit in some regions, are critical for financing ccs projects and offsetting the high cost of carbon capture.
- This strong ccs regulatory framework incentivizes investment in proven technologies like amine scrubbing and the infrastructure for cross-border co2 transport. As a key climate mitigation tool for hard-to-abate sectors, CCS is essential for achieving net-zero industrial processes.
- Such policies directly support the development of infrastructure, including the drilling of a co2 injection well and ensuring long-term caprock integrity for permanent storage, making projects more financially viable.
What are the market trends shaping the Carbon Capture And Storage (CCS) Industry?
- The growing adoption of carbon capture and storage projects in developing regions is emerging as a significant market trend, driven by industrial expansion and decarbonization goals.
- A primary trend is the shift toward commercial-scale deployment of diverse capture methods. While retrofitting post-combustion capture systems remains common, interest in carbon negative technologies like direct air capture (dac) and beccs (bioenergy with ccs) is accelerating. This is enabling a carbon intensity reduction of over 90% in some pilot projects.
- The development of the ccs hub and cluster model, particularly for offshore co2 storage, improves economic viability by sharing infrastructure, which can lower upfront costs for individual emitters by up to 40%.
- These hubs provide full-chain ccs services, from capture to sequestration monitoring, which is also improving public acceptance of ccs and supporting efforts in decarbonizing cement production and decarbonizing power generation.
What challenges does the Carbon Capture And Storage (CCS) Industry face during its growth?
- A key challenge affecting industry growth involves the inherent risks associated with the long-term storage and operational safety of carbon capture systems.
- Significant challenges persist, particularly the high capital cost of infrastructure for ccs, including co2 compression facilities. The operational cost of solvent-based capture technologies creates a significant energy penalty, though innovations are reducing energy penalty by over 15% in newer systems. Technical risks surrounding geological sequestration and subsurface injection require thorough subsurface risk assessment to address concerns over long-term storage liability.
- While applications like enhanced oil recovery (eor) provide a revenue stream, the primary goal of permanent co2 removal remains a hurdle for many integrated ccs projects. These challenges also impact related ambitions, such as scaling blue hydrogen production, which depends on cost-effective capture, sometimes following processes like flue gas desulfurization.
Exclusive Technavio Analysis on Customer Landscape
The carbon capture and storage (ccs) market forecasting report includes the adoption lifecycle of the market, covering from the innovator’s stage to the laggard’s stage. It focuses on adoption rates in different regions based on penetration. Furthermore, the carbon capture and storage (ccs) market report also includes key purchase criteria and drivers of price sensitivity to help companies evaluate and develop their market growth analysis strategies.
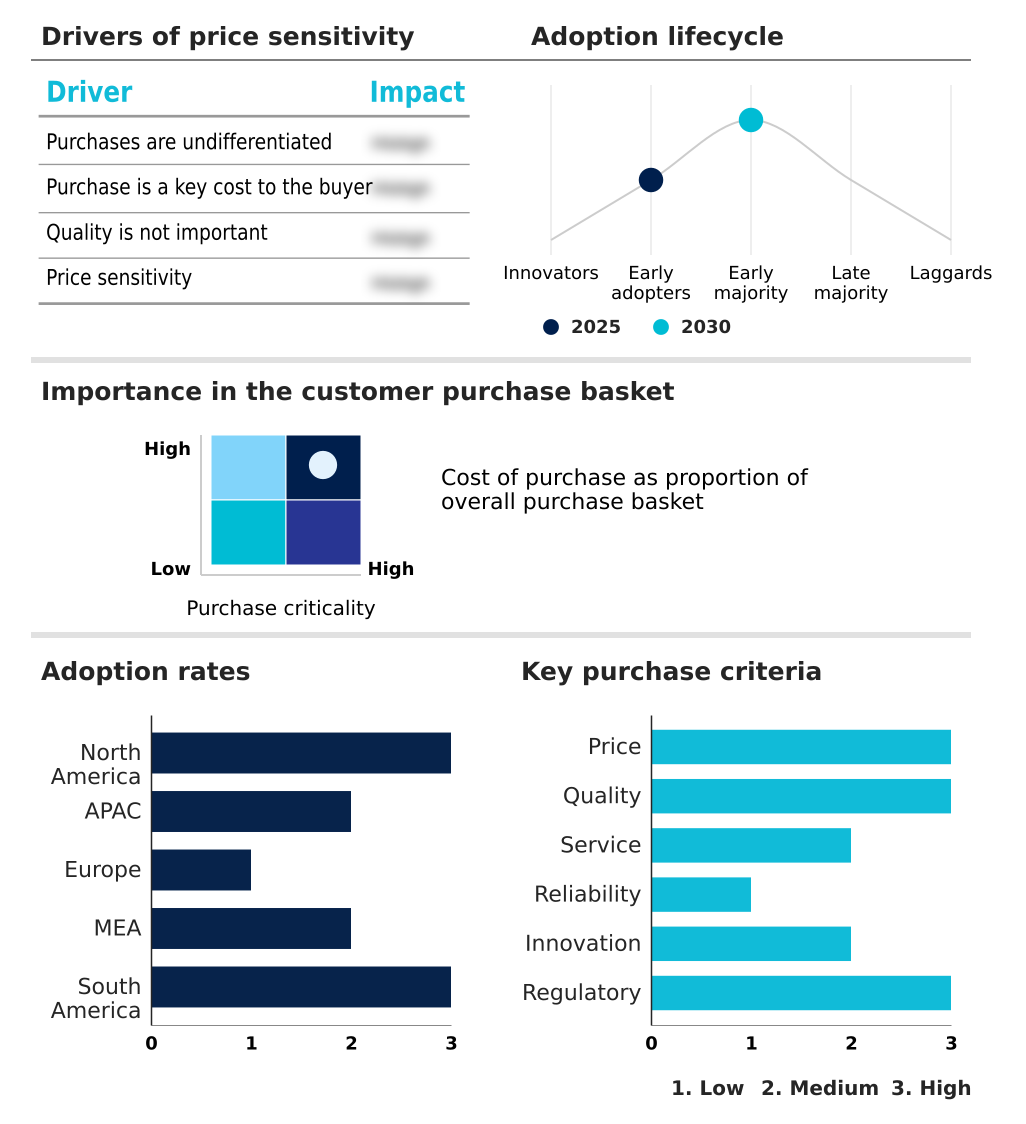
Customer Landscape of Carbon Capture And Storage (CCS) Industry
Competitive Landscape
Companies are implementing various strategies, such as strategic alliances, carbon capture and storage (ccs) market forecast, partnerships, mergers and acquisitions, geographical expansion, and product/service launches, to enhance their presence in the industry.
Air Liquide SA - Offers advanced carbon capture technologies, including cryogenic and purification systems, addressing industrial decarbonization needs for hard-to-abate sectors.
The industry research and growth report includes detailed analyses of the competitive landscape of the market and information about key companies, including:
- Air Liquide SA
- Air Products and Chem Inc.
- Babcock and Wilcox
- Baker Hughes Co.
- Carbfix
- Carbon Clean Solutions Ltd.
- Climeworks AG
- Exxon Mobil Corp.
- Fluor Corp.
- GE Vernova Inc.
- Honeywell International Inc.
- John Wood Group PLC
- Linde Plc
- MAN Energy Solutions SE
- Mitsubishi Heavy Industries
- Schlumberger Ltd.
- Shell plc
- Siemens AG
- Svante Technologies Inc.
- TotalEnergies SE
Qualitative and quantitative analysis of companies has been conducted to help clients understand the wider business environment as well as the strengths and weaknesses of key industry players. Data is qualitatively analyzed to categorize companies as pure play, category-focused, industry-focused, and diversified; it is quantitatively analyzed to categorize companies as dominant, leading, strong, tentative, and weak.
Recent Development and News in Carbon capture and storage (ccs) market
- In March 2025, The US Department of Energy allocated significant funding for the deployment of modular direct air capture (DAC) systems in Arizona, targeting industrial-scale carbon removal.
- In January 2025, Chevron, Engie, and GE Vernova formed a partnership to develop a 4 GW natural gas plant in the US that will integrate pre-combustion CCS technology to manage emissions.
- In January 2025, Green Plains initiated operations at its Nebraska CCS project, which uses a post-combustion capture approach to sequester approximately 1.2 million tons of CO2 annually from ethanol production.
- In January 2025, The United Arab Emirates established a national carbon capture policy, mandating gradual emission intensity reductions for all major industrial facilities, including petrochemicals and aluminum.
Dive into Technavio’s robust research methodology, blending expert interviews, extensive data synthesis, and validated models for unparalleled Carbon Capture And Storage (CCS) Market insights. See full methodology.
| Market Scope | |
|---|---|
| Page number | 314 |
| Base year | 2025 |
| Historic period | 2020-2024 |
| Forecast period | 2026-2030 |
| Growth momentum & CAGR | Accelerate at a CAGR of 32.1% |
| Market growth 2026-2030 | USD 25886.8 million |
| Market structure | Fragmented |
| YoY growth 2025-2026(%) | 24.4% |
| Key countries | US, Canada, Mexico, China, Japan, India, South Korea, Australia, Indonesia, Germany, UK, France, Italy, Spain, The Netherlands, Saudi Arabia, UAE, South Africa, Israel, Turkey, Brazil, Argentina and Chile |
| Competitive landscape | Leading Companies, Market Positioning of Companies, Competitive Strategies, and Industry Risks |
Research Analyst Overview
- The carbon capture and storage (ccs) market is advancing as a critical component for industrial cluster decarbonization and the decarbonization of power generation. Core technologies range from established post-combustion capture using amine scrubbing and solvent-based capture to innovative pre-combustion decarbonization and oxy-fuel combustion.
- The development of direct air capture (dac) and beccs (bioenergy with ccs) is pivotal for achieving negative emissions. Deployment relies on a ccs regulatory framework, including the 45q tax credit and a carbon pricing mechanism. Projects involve co2 compression for pipeline transport or cross-border co2 transport to storage sites.
- Permanent geological sequestration is achieved through subsurface injection into formations like saline aquifer storage, with caprock integrity verified by seismic monitoring and sequestration monitoring. While enhanced oil recovery (eor) offers revenue, the focus is shifting to dedicated storage. Technology is evolving with membrane-based separation, solid sorbent technology, cryogenic separation, and chemical looping combustion to improve efficiency.
- This is crucial for scaling low-carbon hydrogen production, specifically blue hydrogen production. Boardroom decisions are increasingly focused on integrating these solutions, with advanced co2 injection well technologies improving storage security by over 15%. This ecosystem includes flue gas desulfurization, point source capture, co2 mineralization, and building out co2 transport infrastructure and ccs hub and cluster models for offshore co2 storage.
What are the Key Data Covered in this Carbon Capture And Storage (CCS) Market Research and Growth Report?
-
What is the expected growth of the Carbon Capture And Storage (CCS) Market between 2026 and 2030?
-
USD 25.89 billion, at a CAGR of 32.1%
-
-
What segmentation does the market report cover?
-
The report is segmented by Technology (Pre-combustion, Post-combustion, and Oxy-fuel combustion), Application (Enhanced oil recovery, and Geological storage), Distribution Channel (Pipeline, and Ships), End-user (Power and oil and gas, and Manufacturing) and Geography (North America, APAC, Europe, Middle East and Africa, South America)
-
-
Which regions are analyzed in the report?
-
North America, APAC, Europe, Middle East and Africa and South America
-
-
What are the key growth drivers and market challenges?
-
Dependence on fossil fuels for generation of electricity, Risks associated with carbon capture and storage
-
-
Who are the major players in the Carbon Capture And Storage (CCS) Market?
-
Air Liquide SA, Air Products and Chem Inc., Babcock and Wilcox, Baker Hughes Co., Carbfix, Carbon Clean Solutions Ltd., Climeworks AG, Exxon Mobil Corp., Fluor Corp., GE Vernova Inc., Honeywell International Inc., John Wood Group PLC, Linde Plc, MAN Energy Solutions SE, Mitsubishi Heavy Industries, Schlumberger Ltd., Shell plc, Siemens AG, Svante Technologies Inc. and TotalEnergies SE
-
Market Research Insights
- The market dynamics are shaped by the urgent need for industrial emissions reduction and the pursuit of net-zero industrial processes. Effective carbon management solutions are now critical for the decarbonization of heavy industry, especially in hard-to-abate sectors. The development of integrated ccs projects and full-chain ccs services is accelerating, supported by emission trading schemes and other policies.
- A key focus is on reducing energy penalty associated with capture, with some firms reporting efficiency gains of 10-15%. While the high cost of carbon capture is a barrier, advancements in carbon abatement technology are improving project viability. The entire co2 value chain is expanding, but challenges related to long-term storage liability and achieving widespread public acceptance of ccs remain.
- These factors influence the pace of commercial-scale deployment across the globe.
We can help! Our analysts can customize this carbon capture and storage (ccs) market research report to meet your requirements.
 RIA -
RIA - 
