
Carbon Credit Market Size 2025-2029
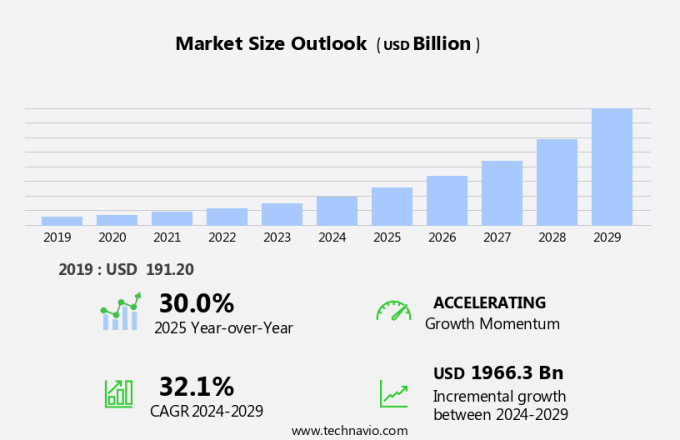
The carbon credit market size is forecast to increase by USD 1,966.3 billion at a CAGR of 32.1% between 2024 and 2029.
- The market is experiencing significant growth due to rising emissions in the Earth's atmosphere, which necessitates the need for businesses and individuals to offset their carbon footprint. Booming investment and partnership deals in this market are driving its expansion, with various organizations recognizing the importance of reducing their carbon emissions and contributing to environmental sustainability. However, the fluctuating prices of carbon credits pose a challenge for market participants, as they can impact the profitability of carbon offsetting projects.
- To stay competitive, market players must closely monitor carbon credit prices and adapt their strategies accordingly. In summary, the market is witnessing increasing demand due to growing environmental concerns and regulatory requirements, but its growth is influenced by the volatility of carbon credit prices.
What will the Carbon Credit Market Size during the forecast period?
- The market has gained significant traction in recent years as businesses and individuals seek to offset their carbon emissions and contribute to the global decarbonization effort. This market facilitates the buying and selling of carbon credits, which represent the right to emit a specific amount of greenhouse gases. The voluntary carbon market plays a crucial role in this context, enabling organizations to offset their carbon footprint beyond regulatory requirements. Net-zero greenhouse-gas emissions have become a key business objective, driving demand for carbon credits from various sources. Forestry projects are a significant contributor to the market. These projects involve the protection, restoration, or reforestation of forests, which act as carbon sinks, absorbing and storing carbon dioxide from the atmosphere.
- Carbon emission reduction projects, such as renewable energy and energy efficiency initiatives, also contribute to the market. Carbon storage projects, including those focused on geological storage, are another essential component. The market's dynamics are influenced by various factors, including regulatory policies, market prices, and technological advancements. As the world moves towards a low-carbon economy, the demand for carbon credits is expected to continue growing, making it an attractive investment opportunity for businesses and individuals alike.
How is this market segmented and which is the largest segment?
The market research report provides comprehensive data (region-wise segment analysis), with forecasts and estimates in "USD billion" for the period 2025-2029, as well as historical data from 2019-2023 for the following segments.
- End-user
- Power
- Energy
- Transportation
- Industrial
- Others
- Type
- Compliance
- Voluntary
- Geography
- Europe
- Germany
- UK
- France
- Italy
- Asia
- China
- North America
- Rest of World (ROW)
- Europe
By End-user Insights
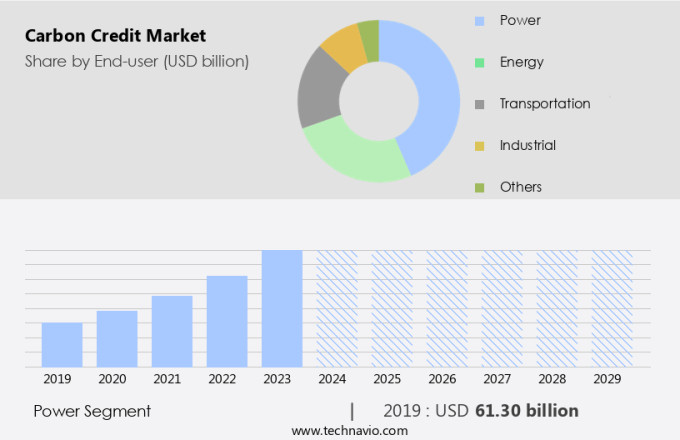
- The power segment is estimated to witness significant growth during the forecast period.
Carbon credits represent financial instruments that enable organizations to invest in emission reduction projects, contributing to the global effort to transition from fossil fuels to renewable energy sources. These initiatives, which focus on conservation, biodiversity, and livelihoods, provide a means to reduce greenhouse gas emissions and mitigate the effects of climate change.
Additionally, the energy sector, specifically power generation, can benefit significantly from this shift, as renewable energy sources offer a sustainable and non-depleting alternative to coal and natural gas. To achieve the international goal of limiting global temperature rise to 2°C or 1.5°C above pre-industrial levels, the reduction of greenhouse gas emissions is crucial. Carbon credits facilitate this transition by incentivizing investment in renewable energy projects and reducing the overall carbon footprint.
Get a glance at the market report of share of various segments Request Free Sample
The power segment was valued at USD 61.30 billion in 2019 and showed a gradual increase during the forecast period.
Regional Analysis
- Europe is estimated to contribute 84% to the growth of the global market during the forecast period.
Technavio's analysts have elaborately explained the regional trends and drivers that shape the market during the forecast period.

For more insights on the market share of various regions Request Free Sample
The European Union (EU) held a significant share of The market in 2023, with countries like the UK and Germany being major buyers. To achieve climate neutrality by 2050, the EU established the International Emissions Trading System (ETS) in 2005, which sets the cost of CO2 emissions and uses a trading system to foster a carbon-neutral industrial landscape. In February 2023, the EU ETS regulations were legislated, and carbon permits reached a record-high price of USD 107 per ton. In response, EU lawmakers introduced reforms, including fines for companies exceeding their CO2 emission limits. This market is essential for funding carbon reduction projects and offsetting carbon emissions naturally, contributing to the global effort towards mitigating climate change.
Market Dynamics
Our researchers analyzed the data with 2024 as the base year, along with the key drivers, trends, and challenges. A holistic analysis of drivers will help companies refine their marketing strategies to gain a competitive advantage.
What are the key market drivers leading to the rise in adoption of Carbon Credit Market?
Rising carbon emissions in earth atmosphere is the key driver of the market.
- The global carbon offset market plays a crucial role in funding projects that reduce or remove carbon emissions, contributing to the goal of net-zero greenhouse-gas emissions and decarbonization. This market encompasses both the voluntary and compliance sectors. In the voluntary carbon market, individuals and companies purchase carbon credits to offset their own emissions, providing financial support for projects that protect the atmosphere and promote climate protection. Forestry projects, such as reforestation and forest management, are common in this market. However, challenges like leakage of offsets, validity, and harvest can impact the quality of credits. Carbon credits generated from these projects can provide revenues for development projects, incentivizing economic stimuli and improving livelihood in local communities.
- Energy factors also influence the carbon market, with fluctuating prices and market challenges posed by economic recessions. The market is essential for carbon emission reduction initiatives, as leading companies increasingly set ambitious climate goals and seek bankable carbon initiatives. Forest conservation and biodiversity protection are significant areas of focus, as these projects not only reduce carbon emissions but also contribute to climate change mitigation and sustainable development. The carbon market is influenced by various economic and regulatory factors, including carbon taxes and carbon pricing. The market's dynamics are shaped by the location of emissions, the quality of credits, and the participants involved.
What are the market trends shaping the Carbon Credit Market?
Booming investment and partnership deals in carbon credit market is the upcoming trend in the market.
- The market is experiencing a notable expansion due to the growing demand for carbon emission reduction solutions in response to the global push towards net-zero greenhouse-gas emissions. This market growth is driven by corporations and governments seeking financial support for projects that mitigate carbon emissions, primarily in the voluntary sector. Forestry projects, such as reforestation and forest management, are among the leading initiatives attracting significant investments. These projects not only contribute to carbon storage and climate protection but also provide economic stimuli for local communities and biodiversity conservation. However, challenges persist, including the validity and location of emissions, leakage of offsets, and fluctuating prices.
- Despite these challenges, the market continues to gain traction as a critical tool for decarbonization and carbon neutralization. The market dynamics are influenced by various factors, including energy factors, economic recession, and carbon tax policies. As the demand for carbon credits increases, high-quality credits from bankable carbon initiatives will become increasingly valuable to participants.
What challenges does Carbon Credit Market face during the growth?
Fluctuating prices of carbon credits is a key challenge affecting the market growth.
- The market plays a crucial role in global carbon offsetting, enabling organizations and countries to achieve net-zero greenhouse-gas emissions and decarbonization. This market comprises voluntary and compliance sectors, with various projects such as forestry, energy, and industrial processes contributing to carbon emission reduction. Carbon credits are issued based on the amount of carbon storage or emission reduction achieved by these projects, which can then be bought and sold in the market. The location of emissions is a significant factor in the validity and quality of carbon credits. Forest management project, for instance, can provide carbon credits by preserving and managing forests, which absorb carbon dioxide from the atmosphere.
- Financial support from leading companies and development projects is essential for the success of carbon credits and climate protection. The prices of carbon credits can fluctuate due to various economic factors, including energy prices and economic recessions. Despite these challenges, the carbon market continues to provide economic stimuli for climate goals and bankable carbon initiatives, supporting conservation efforts and the livelihoods of local communities. Countries, including Canada, China, France, the US, and others, are implementing carbon taxes and carbon markets to limit carbon emissions and incentivize carbon reduction
Exclusive Customer Landscape
The market forecasting report includes the adoption lifecycle of the market, covering from the innovator's stage to the laggard's stage. It focuses on adoption rates in different regions based on penetration. Furthermore, the market report also includes key purchase criteria and drivers of price sensitivity to help companies evaluate and develop their market growth analysis strategies.
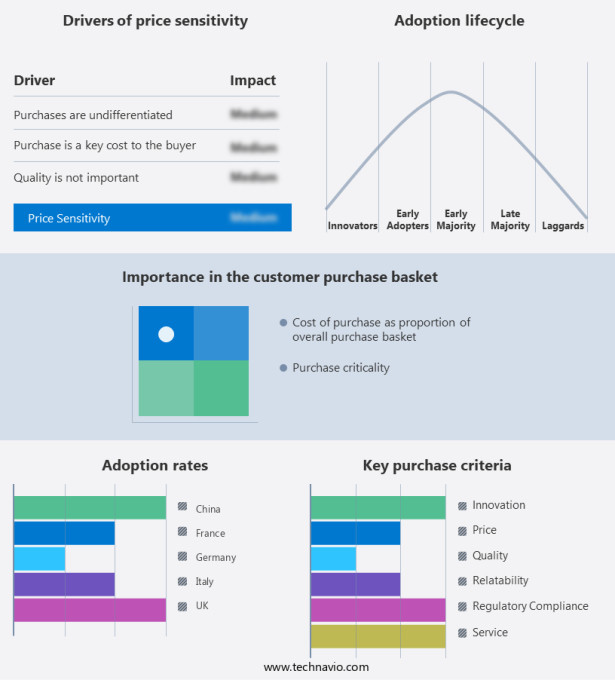
Customer Landscape
Key Companies & Market Insights
Companies are implementing various strategies, such as strategic alliances, market forecast, partnerships, mergers and acquisitions, geographical expansion, and product/service launches, to enhance their presence in the market.
3Degrees Group Inc: The company offers carbon credit projects such as Giriraj Bundled Wind Project, Meridian SF6 reduction project, and Family owned farm anaerobic digester project.
The market research and growth report includes detailed analyses of the competitive landscape of the market and information about key companies, including:
- AltaGas Ltd.
- Anew Climate LLC
- Carbon Credit Capital LLC
- CarbonBetter
- ClearSky Climate Solutions LLC
- Climate Bridge Ltd.
- Climate Impact Partners LLC
- ClimatePartner GmbH
- ClimeCo LLC
- EKI Energy Services Ltd.
- Finite Carbon Corp.
- Just Energy Advanced Solutions LLC
- Microsoft Corp.
- NativeEnergy
- natureOffice GmbH
- NRG Energy Inc.
- South Pole
- Sterling Planet
- Tasman Environmental Markets
Qualitative and quantitative analysis of companies has been conducted to help clients understand the wider business environment as well as the strengths and weaknesses of key market players. Data is qualitatively analyzed to categorize companies as pure play, category-focused, industry-focused, and diversified; it is quantitatively analyzed to categorize companies as dominant, leading, strong, tentative, and weak.
Research Analyst Overview
The market has emerged as a significant force in the global response to climate change. This market facilitates the buying and selling of carbon credits, allowing entities to offset their carbon emissions by funding projects that reduce, avoid, or remove greenhouse gas (GHG) emissions from the atmosphere. This market encompasses both the voluntary and compliance sectors, each with unique characteristics. Voluntary carbon markets enable organizations to purchase carbon credits to offset their carbon footprint, often as part of their commitment to net-zero greenhouse-gas emissions or decarbonization strategies. These markets provide essential funding for various projects, including forestry initiatives, renewable energy, and energy efficiency projects. Projects in the market can range from reforestation and afforestation to improved forest management and sustainable agriculture. Forestry projects play a crucial role in carbon sequestration and biodiversity conservation. However, concerns regarding leakage of offsets, validity, and the location of emissions have raised debates about the effectiveness and quality of these initiatives. Financial support from the market plays a vital role in the development and implementation of climate protection projects. Local communities often benefit from these projects, which can provide economic opportunities and contribute to sustainable livelihoods.
However, the market faces challenges, such as fluctuating prices, market volatility, and the need for high-quality credits to maintain credibility and trust. Carbon emission reduction projects can generate revenues for participants, creating economic incentives for decarbonization. These initiatives can also contribute to energy factors, such as increased energy efficiency and the promotion of renewable energy sources. However, economic recessions and carbon taxes can impact market demand and prices. Bankable carbon initiatives are essential to ensure the long-term success of the market. These projects must meet rigorous standards to ensure their validity and effectiveness in reducing GHG emissions. Quality assurance mechanisms and third-party verification are crucial to maintaining the integrity of the market and fostering trust among participants. The market offers opportunities for climate goals and sustainable development. However, it also faces challenges, such as market volatility, price fluctuations, and concerns regarding the validity and effectiveness of certain projects. Addressing these challenges will be essential to ensuring the continued growth and success of the market in the global decarbonization effort.
|
Market Scope |
|
|
Report Coverage |
Details |
|
Page number |
199 |
|
Base year |
2024 |
|
Historic period |
2019-2023 |
|
Forecast period |
2025-2029 |
|
Growth momentum & CAGR |
Accelerate at a CAGR of 32.1% |
|
Market growth 2025-2029 |
USD 1,966.3 billion |
|
Market structure |
Fragmented |
|
YoY growth 2024-2025(%) |
30.0 |
|
Key countries |
Germany, UK, Italy, France, and China |
|
Competitive landscape |
Leading Companies, Market Positioning of Companies, Competitive Strategies, and Industry Risks |
What are the Key Data Covered in this Market Research and Growth Report?
- CAGR of the market during the forecast period
- Detailed information on factors that will drive the market growth and forecasting between 2025 and 2029
- Precise estimation of the size of the market and its contribution of the market in focus to the parent market
- Accurate predictions about upcoming market growth and trends and changes in consumer behaviour
- Growth of the market across Europe, Asia, North America, and Rest of World (ROW)
- Thorough analysis of the market's competitive landscape and detailed information about companies
- Comprehensive analysis of factors that will challenge the growth of market companies
We can help! Our analysts can customize this market research report to meet your requirements. Get in touch