
Cardiovascular Therapeutics Market Size 2025-2029
The cardiovascular therapeutics market size is forecast to increase by USD 25.32 billion, at a CAGR of 4.6% between 2024 and 2029.
- The market is experiencing significant growth and transformation, driven by the increasing risk factors for cardiovascular diseases and the advent of novel technologies. The rising prevalence of obesity, sedentary lifestyles, and unhealthy diets are leading to a surge in cardiovascular conditions, creating a vast demand for effective therapeutic solutions. One of the most promising developments in the market is the advent of Novel Oral Anticoagulants (NOACs), which offer improved safety and efficacy compared to traditional anticoagulants. These next-generation drugs are revolutionizing the treatment of atrial fibrillation, deep vein thrombosis, and pulmonary embolism, providing better patient outcomes and reduced healthcare costs.
- Another trend shaping the market is the emergence of wearable defibrillators, which enable early detection and intervention of life-threatening cardiac arrhythmias. These portable devices offer significant advantages over conventional implantable defibrillators, including greater patient mobility and reduced invasiveness. However, challenges remain, such as ensuring user-friendliness, affordability, and effective integration with healthcare systems, which companies must address to capitalize on this market opportunity.
What will be the Size of the Cardiovascular Therapeutics Market during the forecast period?

Explore in-depth regional segment analysis with market size data - historical 2019-2023 and forecasts 2025-2029 - in the full report.
Request Free Sample
The market continues to evolve, driven by the persistent challenge of managing complex cardiovascular conditions and addressing the ever-growing burden of cardiovascular risk factors. Antianginal drugs, including beta blockers, play a crucial role in mitigating symptoms of angina. However, the focus is shifting towards a more holistic approach, integrating family history, lifestyle modifications, and personalized medicine. Cardiac risk factors, such as physical inactivity and smoking, remain significant contributors to the disease burden. Advanced technologies, like cardiac computed tomography and genetic testing, are transforming diagnosis and treatment, enabling earlier intervention and improved patient outcomes. The drug approval process is undergoing significant changes, with an increased emphasis on clinical trials and the use of biomarkers, such as natriuretic peptides and creatine kinase, to assess drug efficacy.
Cardiovascular devices, including cardiac glycosides and drug delivery systems, are also advancing, offering new treatment options and improving patient care. Aortic aneurysm repair and cardiac rehabilitation are gaining prominence, reflecting the importance of addressing the long-term management of cardiovascular conditions. Antihypertensive drugs, including calcium channel blockers and ACE inhibitors, continue to be a mainstay in treating hypertension, while lipid-lowering agents and antihypertensive drugs remain essential in managing dyslipidemia and hypertension, respectively. Patient education and lifestyle modifications, such as weight management and smoking cessation, are increasingly recognized as critical components of effective cardiovascular care. The role of healthcare policy in shaping the market landscape and ensuring access to these advanced treatments is a continuous area of focus.
In the ever-changing landscape of cardiovascular therapeutics, ongoing research and innovation are essential to address the evolving needs of patients and healthcare providers. The market dynamics are shaped by a complex interplay of scientific advancements, regulatory requirements, and healthcare policy. The integration of technology, personalized medicine, and patient-centered care is driving the development of new treatments and improving patient outcomes.
How is this Cardiovascular Therapeutics Industry segmented?
The cardiovascular therapeutics industry research report provides comprehensive data (region-wise segment analysis), with forecasts and estimates in "USD billion" for the period 2025-2029, as well as historical data from 2019-2023 for the following segments.
- Distribution Channel
- Hospital pharmacy
- Retail Pharmacy
- Online pharmacy
- Type
- Antithrombotic drugs
- Hypolipidemic drugs
- Others
- Route Of Administration
- Oral
- Injectable
- Transdermal
- Geography
- North America
- US
- Canada
- Europe
- France
- Germany
- Italy
- UK
- APAC
- China
- India
- Japan
- South Korea
- Rest of World (ROW)
- North America
By Distribution Channel Insights
The hospital pharmacy segment is estimated to witness significant growth during the forecast period.
Hospital pharmacies are a significant segment of the healthcare system, driving the expansion of the market. Pharmacies within hospitals procure, store, and dispense medications to patients, enabling cost savings through bulk purchases from manufacturers or wholesalers. Hospital pharmacists ensure accurate medication administration, enhancing patient outcomes and minimizing adverse events. Cardiovascular therapeutics encompass various categories, including heart failure medications, antihypertensive drugs, lipid-lowering agents, antiplatelet agents, and cardiac glycosides. Clinical trials, an essential aspect of cardiovascular research, are facilitated by hospital pharmacies. These trials contribute to the development of new therapeutics, such as natriuretic peptides, ACE inhibitors, and beta blockers.
Cardiac computed tomography, an essential diagnostic tool, is used to assess cardiovascular conditions. Cardiovascular devices, like pacemakers and defibrillators, are implemented in treatment plans. Smoking cessation and weight management programs, crucial lifestyle modifications, are often managed by hospital pharmacies. Genetic testing and personalized medicine are emerging trends in cardiovascular therapeutics, requiring close collaboration between hospital pharmacies and other healthcare professionals. Percutaneous coronary intervention, a minimally invasive procedure, is facilitated by drug delivery systems. Cardiovascular risk factors, such as physical inactivity and family history, are addressed through patient education and lifestyle modifications. Antiarrhythmic drugs, antianginal drugs, and antiplatelet agents are administered to manage various cardiovascular conditions.
Cardiac rehabilitation, a critical component of post-treatment care, is supported by hospital pharmacies. Aortic aneurysm repair and cardiac glycosides are other therapeutic areas that benefit from hospital pharmacy involvement. Healthcare policy plays a crucial role in shaping the market, with regulations impacting drug pricing, access, and distribution.
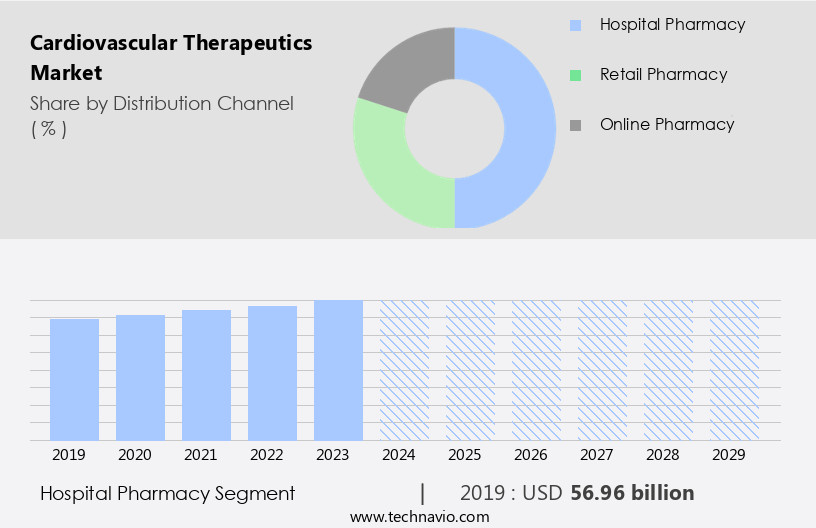
The Hospital pharmacy segment was valued at USD 56.96 billion in 2019 and showed a gradual increase during the forecast period.
Regional Analysis
Asia is estimated to contribute 38% to the growth of the global market during the forecast period. Technavio's analysts have elaborately explained the regional trends and drivers that shape the market during the forecast period.

The market encompasses various interventions and treatments for heart failure medications, cardiac computed tomography, clinical trials, creatine kinase, physical inactivity, cardiovascular devices, smoking cessation, antiplatelet agents, weight management, personalized medicine, antihypertensive drugs, calcium channel blockers, natriuretic peptides, genetic testing, cardiac biomarkers, percutaneous coronary intervention, drug approval process, lipid-lowering agents, ACE inhibitors, patient education, antiarrhythmic drugs, dietary changes, cardiac imaging, drug delivery systems, cardiovascular risk factors, antianginal drugs, beta blockers, family history, lifestyle modifications, aortic aneurysm repair, cardiac rehabilitation, cardiac glycosides, and healthcare policy. In Asia, the market's growth is influenced by the increasing prevalence of cardiovascular diseases, yet the region holds a smaller market share due to limited awareness, low purchasing power, and inadequate treatment options.
Challenges include the absence of a proper drug approval framework, weak healthcare infrastructure, and poor distribution networks. Despite these hurdles, advancements in technology, such as cardiac computed tomography and personalized medicine, offer promising opportunities for market expansion.
Market Dynamics
Our researchers analyzed the data with 2024 as the base year, along with the key drivers, trends, and challenges. A holistic analysis of drivers will help companies refine their marketing strategies to gain a competitive advantage.
What are the key market drivers leading to the rise in the adoption of Cardiovascular Therapeutics Industry?
- The primary cause for the growth of the market is the rising risk factors contributing to cardiovascular diseases.
- Cardiovascular disease is a complex condition with multiple risk factors, making it essential to understand the linkages between these factors and the disease's progression. Obesity is a significant risk factor for cardiovascular diseases, and its association is mediated by various abnormalities, including hypertension, diabetes, and lipoproteins. These conditions, in turn, are risk factors for cardiovascular diseases. Weight management is a crucial aspect of preventing and managing cardiovascular diseases. In this regard, personalized medicine, which involves tailoring treatment plans based on an individual's genetic makeup, is gaining popularity. For instance, genetic testing can help identify individuals at high risk for cardiovascular diseases, enabling early intervention with antihypertensive drugs, such as calcium channel blockers.
- Moreover, the role of natriuretic peptides and cardiac biomarkers in diagnosing and managing cardiovascular diseases is increasingly recognized. These markers can provide valuable information about the heart's function and the presence of damage, facilitating timely intervention through percutaneous coronary intervention. In conclusion, the market is driven by the growing prevalence of obesity and other risk factors, the increasing focus on personalized medicine, and the development of innovative diagnostic and therapeutic approaches, such as natriuretic peptides and cardiac biomarkers. Understanding these factors is crucial for developing effective strategies to prevent and manage cardiovascular diseases.
What are the market trends shaping the Cardiovascular Therapeutics Industry?
- The emergence of novel oral anticoagulants (NOACs) signifies a significant market trend in the healthcare industry. NOACs are replacing traditional anticoagulants with their advantages such as fewer drug interactions, easier dosing, and quicker onset of action.
- The market is witnessing significant growth due to the approval and introduction of novel oral anticoagulants (NOACs), which are increasingly replacing traditional anticoagulants like heparin and warfarin. NOACs offer several advantages, such as a rapid onset and offset of action, fewer drug interactions, and predictable pharmacokinetics. These benefits make it easier for patients to adhere to anticoagulant therapy post-discharge. Some notable NOACs include Pradaxa from Boehringer Ingelheim, Eliquis from BMS, and Xarelto from Janssen Pharmaceuticals. Moreover, the drug approval process for cardiovascular therapeutics continues to evolve, with an emphasis on patient education and safety. Lipid-lowering agents, such as statins, remain a cornerstone of cardiovascular disease management.
- ACE inhibitors and antiarrhythmic drugs are also essential components of cardiovascular therapeutics. Dietary changes and cardiac imaging play a crucial role in the prevention and management of cardiovascular diseases. Drug delivery systems, including extended-release formulations and injectable therapies, are also gaining importance in the market. As the focus on personalized medicine grows, these delivery systems will become increasingly essential for optimizing treatment outcomes. Patients and healthcare providers must work together to ensure proper adherence to treatment plans and maintain a holistic approach to cardiovascular health. This includes regular monitoring, lifestyle modifications, and ongoing education about the importance of medication and dietary changes.
- By collaborating and staying informed, we can improve patient outcomes and reduce the burden of cardiovascular diseases.
What challenges does the Cardiovascular Therapeutics Industry face during its growth?
- The emergence of wearable defibrillators poses a significant challenge to the industry's growth trajectory. These innovative medical devices, which enable users to administer lifesaving shocks to their hearts in the event of cardiac arrest, represent a major disruption to traditional defibrillator markets. As wearable defibrillators become increasingly accessible and affordable, they are poised to transform the landscape of cardiac care and potentially disrupt the revenue streams of established industry players.
- The market is experiencing significant advancements in the field of wearable cardiovascular defibrillators for managing cardiovascular symptoms. One notable example is the Vest Prevention of Early Sudden Death (VEST) trial, which tested the efficacy of the Zoll LifeVest wearable cardioverter defibrillator (WCD) in reducing sudden death in patients with a recent heart attack and a reduced ejection fraction of 35% or less. Although ejection fractions often improve in the months following a heart attack, these patients remain at an increased risk of sudden death during the initial three months. This trial marked the first randomized, multi-center investigation of a WCD's effectiveness in preventing sudden death.
- The market is driven by ongoing research and development initiatives aimed at improving patient outcomes and reducing the risk of cardiovascular events. Cardiovascular risk factors, such as family history, lifestyle modifications, and the presence of conditions like aortic aneurysms, continue to fuel the demand for advanced therapeutic solutions. Antianginal drugs, including beta blockers and cardiac glycosides, remain essential components of cardiovascular treatment. Cardiac rehabilitation programs and aortic aneurysm repair procedures are also critical aspects of the market.
Exclusive Customer Landscape
The cardiovascular therapeutics market forecasting report includes the adoption lifecycle of the market, covering from the innovator's stage to the laggard's stage. It focuses on adoption rates in different regions based on penetration. Furthermore, the cardiovascular therapeutics market report also includes key purchase criteria and drivers of price sensitivity to help companies evaluate and develop their market growth analysis strategies.

Customer Landscape
Key Companies & Market Insights
Companies are implementing various strategies, such as strategic alliances, cardiovascular therapeutics market forecast, partnerships, mergers and acquisitions, geographical expansion, and product/service launches, to enhance their presence in the industry.
Abbott Laboratories - The company specializes in cardiovascular therapeutics, providing advanced treatments for heart failure patients.
The industry research and growth report includes detailed analyses of the competitive landscape of the market and information about key companies, including:
- Abbott Laboratories
- Acutus Medical Inc.
- Amgen Inc.
- Astellas Pharma Inc.
- AstraZeneca Plc
- Aurobindo Pharma Ltd.
- Bayer AG
- Boehringer Ingelheim International GmbH
- Bristol Myers Squibb Co.
- Daiichi Sankyo Co. Ltd.
- Dr Reddys Laboratories Ltd.
- Eli Lilly and Co.
- F. Hoffmann La Roche Ltd.
- GlaxoSmithKline Plc
- Johnson and Johnson Services Inc.
- Merck and Co. Inc.
- Novartis AG
- Pfizer Inc.
- Sun Pharmaceutical Industries Ltd.
- Viatris Inc.
Qualitative and quantitative analysis of companies has been conducted to help clients understand the wider business environment as well as the strengths and weaknesses of key industry players. Data is qualitatively analyzed to categorize companies as pure play, category-focused, industry-focused, and diversified; it is quantitatively analyzed to categorize companies as dominant, leading, strong, tentative, and weak.
Recent Development and News in Cardiovascular Therapeutics Market
- In January 2024, Medtronic plc, a global leader in medical technology, solutions, and services, announced the U.S. Food and Drug Administration (FDA) approval of its new cardiovascular device, the Intrepid Dual Carotid Stent System. This innovative stent is designed to improve blood flow in the carotid artery and reduce the risk of stroke (Medtronic Press Release, 2024).
- In March 2024, Pfizer Inc. and Biohaven Pharma entered into a strategic collaboration to co-develop and commercialize Pfizer's investigational therapy, PF-06651600, for the prevention of recurrent ischemic strokes. This partnership combines Pfizer's expertise in large-scale development and commercialization with Biohaven's focus on neurology (Pfizer Press Release, 2024).
- In May 2024, Abbott Laboratories completed the acquisition of St. Jude Medical, a leading medical device company specializing in cardiovascular and neuromodulation technologies. This acquisition strengthened Abbott's position in the cardiovascular market and expanded its portfolio of devices (Abbott Press Release, 2024).
- In April 2025, the European Commission granted marketing authorization for Amgen's Repatha (evolocumab) injection, a monoclonal antibody designed to reduce LDL cholesterol levels in adults with cardiovascular disease or high risk for it. This approval marks a significant expansion of Repatha's availability in Europe (Amgen Press Release, 2025).
Research Analyst Overview
- The market is experiencing significant advancements in various areas, including drug efficacy and safety. Pharmacodynamic and pharmacokinetic studies are pivotal in evaluating new treatments, ensuring optimal cardiovascular outcomes. Remote patient monitoring enables continuous surveillance of cardiac patients, improving clinical outcomes and reducing readmission rates. Cardiac surgery innovations continue to evolve, with emerging markets adopting advanced technologies. Health economics plays a crucial role in determining the cost-effectiveness of new therapies, such as regenerative medicine and stem cell therapy. Artificial intelligence and machine learning are revolutionizing cardiovascular prognosis and risk assessment, while big data analytics facilitates personalized treatment plans.
- Health disparities persist as a challenge, necessitating public health initiatives to address cardiovascular disease prevention. Precision medicine and gene editing offer promising solutions, tailoring treatments to individual patients based on genetic makeup. Cardiovascular epidemiology and drug safety studies are essential in minimizing adverse drug events and drug interactions. In the realm of global health, ongoing research in cardiovascular outcomes and cost-effectiveness analysis informs policy decisions and resource allocation. The integration of technology and data analytics in cardiovascular care is transforming patient care and improving overall health outcomes.
Dive into Technavio's robust research methodology, blending expert interviews, extensive data synthesis, and validated models for unparalleled Cardiovascular Therapeutics Market insights. See full methodology.
|
Market Scope |
|
|
Report Coverage |
Details |
|
Page number |
219 |
|
Base year |
2024 |
|
Historic period |
2019-2023 |
|
Forecast period |
2025-2029 |
|
Growth momentum & CAGR |
Accelerate at a CAGR of 4.6% |
|
Market growth 2025-2029 |
USD 25.32 billion |
|
Market structure |
Fragmented |
|
YoY growth 2024-2025(%) |
4.3 |
|
Key countries |
US, China, Japan, India, South Korea, Canada, UK, Germany, France, and Italy |
|
Competitive landscape |
Leading Companies, Market Positioning of Companies, Competitive Strategies, and Industry Risks |
What are the Key Data Covered in this Cardiovascular Therapeutics Market Research and Growth Report?
- CAGR of the Cardiovascular Therapeutics industry during the forecast period
- Detailed information on factors that will drive the growth and forecasting between 2025 and 2029
- Precise estimation of the size of the market and its contribution of the industry in focus to the parent market
- Accurate predictions about upcoming growth and trends and changes in consumer behaviour
- Growth of the market across Asia, North America, Europe, and Rest of World (ROW)
- Thorough analysis of the market's competitive landscape and detailed information about companies
- Comprehensive analysis of factors that will challenge the cardiovascular therapeutics market growth of industry companies
We can help! Our analysts can customize this cardiovascular therapeutics market research report to meet your requirements.