Carp Market Size 2024-2028
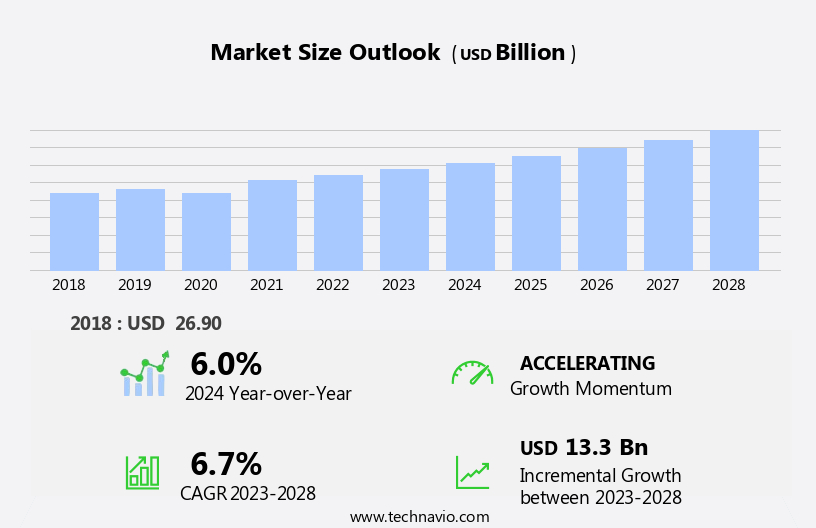
The carp market size is forecast to increase by USD 13.3 billion at a CAGR of 6.7% between 2023 and 2028.
- The market is experiencing significant growth due to several key factors. Consumers are increasingly recognizing the nutritional value of carp, which is rich in protein and essential minerals. Traditional eating habits continue to favor carp as a food choice, particularly in Asian countries. Moreover, there is a growing demand for value-added carp products, such as smoked and prepared carp, which offer convenience and diverse culinary applications. Additionally, carp farming practices are becoming more environmentally friendly, aligning with consumer preferences for sustainable food sources. Moreover, it aligns with ethical eating habits and the demand for sustainable seafood. These trends are driving the growth of the market and making it an attractive option for seafood consumers. This farming method ensures the production of healthy fish, free from antibiotics and other harmful chemicals. The report provides a comprehensive analysis of these factors and more, offering valuable insights for businesses looking to capitalize on the opportunities in the market.
What will be the Size of the Market During the Forecast Period?
- The common carp (Cyprinus carpio) is a widely cultivated fish species in the global aquaculture industry. This fish is recognized for its nutritional value, making it an essential component of sustainable food production. Carp farming plays a vital role in addressing food security concerns, particularly in regions where protein deficiency is prevalent. Aquaculture technology has significantly advanced, leading to the implementation of innovative practices in carp farming. These advancements include improved fish farming techniques, sustainable breeding programs, and the development of healthy feeding strategies. Grass carp food, for instance, is a popular choice for carp farmers due to its nutritional benefits and minimal environmental impact.
- Sustainable aquaculture practices are increasingly gaining importance in the carp farming industry. This approach ensures the preservation of fish species diversity and the protection of the environment. Carp farming businesses have seen steady growth due to the increasing global food demand for low-fat protein sources. Processed carp products, such as smoked carp, are gaining popularity in various cuisines worldwide. Carp consumption is on the rise, with an increasing number of carp recipes being shared online. Organic carp farming is another trend in the carp farming industry. Carp farming sustainability is a critical concern, with farmers focusing on maintaining optimal water temperatures and minimizing the environmental impact of their operations.
How is this market segmented and which is the largest segment?
The market research report provides comprehensive data (region-wise segment analysis), with forecasts and estimates in "USD billion" for the period 2024-2028, as well as historical data from 2018-2022 for the following segments.
- Product
- Grass carp
- Silver carp
- Common carp
- Bighead carp
- Others
- Geography
- APAC
- China
- North America
- Canada
- US
- Europe
- Germany
- South America
- Middle East and Africa
- APAC
By Product Insights
- The grass carp segment is estimated to witness significant growth during the forecast period.
Grass carp, a large herbivorous freshwater fish species native to Eastern Asia, is gaining significant attention in the global market due to its high nutritional value and economic importance. The grass carp segment is projected to experience steady growth during the forecast period, driven by increasing investments in aquaculture in developing countries like China and India. Grass carp are an affordable and easily cultivated fish species, making them a popular choice for farmers. Moreover, they primarily feed on aquatic plants, making them an eco-friendly option for controlling unwanted weed growth in irrigation canals and other freshwater bodies. The consumption of grass carp is on the rise due to growing consumer awareness regarding heart health and cardiovascular diseases. Lean protein sources like grass carp are increasingly preferred over red meat and other high-fat animal products.
Furthermore, grass carp is known to have anti-inflammatory properties, making it an excellent choice for individuals suffering from muscle inflammation and premature skin aging. Government organizations and business entities are collaborating to promote the cultivation and consumption of grass carp. This partnership is expected to boost the market's growth and create new opportunities for businesses involved in the value chain. As a result, the business-to-consumer market for grass carp is poised for significant growth in the coming years. In conclusion, the grass market is expected to witness steady growth due to rising investments in aquaculture, increasing consumer awareness regarding health concerns, and the fish's eco-friendly and nutritional benefits.
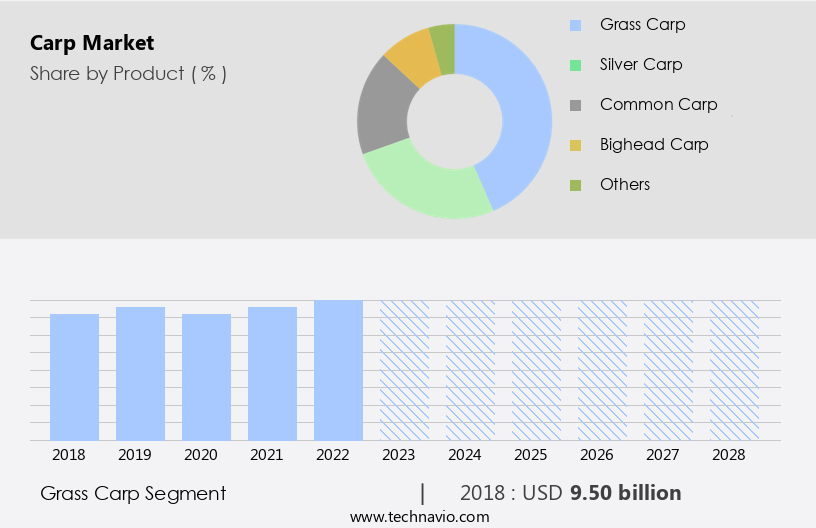
Get a glance at the market report of share of various segments Request Free Sample
The grass carp segment was valued at USD 9.50 billion in 2018 and showed a gradual increase during the forecast period.
Regional Analysis
- APAC is estimated to contribute 57% to the growth of the global market during the forecast period.
Technavio's analysts have elaborately explained the regional trends and drivers that shape the market during the forecast period.

For more insights on the market share of various regions Request Free Sample
In the Market, APAC emerged as the leading revenue contributor in 2023. This region is projected to maintain a consistent growth trajectory throughout the forecast period. The population expansion and rising demand for cost-effective protein sources, including carp, are primary drivers fueling the fish and seafood industry in APAC. However, environmental concerns, water pollution, and fish contamination risks pose significant challenges to market expansion. China holds the position as the world's largest carp producer and consumer, followed by India, Bangladesh, Myanmar, Indonesia, and Vietnam. Middle-income consumers in these countries prioritize healthy food options, making fish a popular choice due to its affordability.
Market Dynamics
Our researchers analyzed the data with 2023 as the base year, along with the key drivers, trends, and challenges. A holistic analysis of drivers will help companies refine their marketing strategies to gain a competitive advantage.
What are the key market drivers leading to the rise in adoption of Carp Market?
Growing awareness about health benefits of carp is the key driver of the market.
- The market experiences significant growth due to the increasing recognition of its health benefits. Consumers, particularly in developing countries like India, Bangladesh, Vietnam, and Indonesia, are becoming increasingly aware of carp as a protein-rich food source. Government initiatives, such as campaigns and events, contribute to this awareness. For instance, Poland's Mister Carp Campaign aims to promote carp consumption through events like Polish Cuisine Festivals, national competitions for schoolchildren, and new TV commercials.
- These efforts highlight the tradition of serving sustainably farmed carp during Christmas Eve. Carp's high-calorie and protein content make it an excellent addition to protein-rich diets, making it a popular choice for muscle building and maintaining a healthy lifestyle. Carp aquaculture is a sustainable and eco-friendly method of producing this protein-rich, high-calorie food, making it an attractive option for both consumers and businesses.
What are the market trends shaping the Carp Market?
Growth prospects in e-commerce is the upcoming trend in the market.
- In today's digital age, consumers' shopping habits have shifted towards online platforms, providing businesses with an opportunity to expand their reach and increase profitability. Seafood companies are no exception to this trend, with Ocean Executive establishing a B2B marketplace that connects various stakeholders in the supply chain, from fishermen and fish farmers to processors, wholesalers, distributors, and foodservice companies. This e-commerce platform offers an open bilateral bid/offer exchange and private auction system, enabling seamless transactions and cost savings for all parties involved. Carp, a nutritious and sustainable fish option, is a significant product category in this marketplace. Grass carp, in particular, is renowned for its high protein content and is a staple in traditional eating habits in many cultures.
- Value-added carp products, such as smoked carp, are also gaining popularity due to their unique flavors and health benefits. Environmentally friendly carp farming practices are essential to maintaining the sustainability of the industry. Ocean Executive's platform supports these practices by enabling direct communication between farmers and buyers, ensuring fair prices and reducing the carbon footprint of the supply chain. As consumers become more conscious of their food choices and the environmental impact of their purchases, the demand for sustainably farmed carp is expected to grow. In conclusion, Ocean Executive's B2B marketplace offers a valuable solution for seafood companies looking to adapt to the digital marketplace while maintaining the integrity of traditional practices and promoting sustainable farming methods.
What challenges does Carp Market face during the growth?
Growing demand for substitutes like tuna, salmon, and other seafoods is a key challenge affecting the market growth.
- The global market faces competition from alternative nutritious fish options, such as tilapia, tuna, and salmon. These substitute fish provide similar health benefits, including omega-3 fatty acids, lean protein, and essential vitamins and minerals. Consumers' increasing health consciousness and the rise of chronic diseases have led to a growing preference for these fish. Urbanization and rising incomes have also contributed to a shift in fish food consumption towards these alternatives.
- Carp, although a rich source of nutrients, is often perceived as an invasive species and has several bones, making it less desirable for some consumers. Tuna, in particular, is a popular choice due to its high nutritional value, which is crucial for maintaining a healthy heart and brain, especially for pregnant women and the working population. Hence, the above factors will impede the growth of the market during the forecast period
Exclusive Customer Landscape
The market forecasting report includes the adoption lifecycle of the market, covering from the innovator's stage to the laggard's stage. It focuses on adoption rates in different regions based on penetration. Furthermore, the market report also includes key purchase criteria and drivers of price sensitivity to help companies evaluate and develop their market growth analysis strategies.
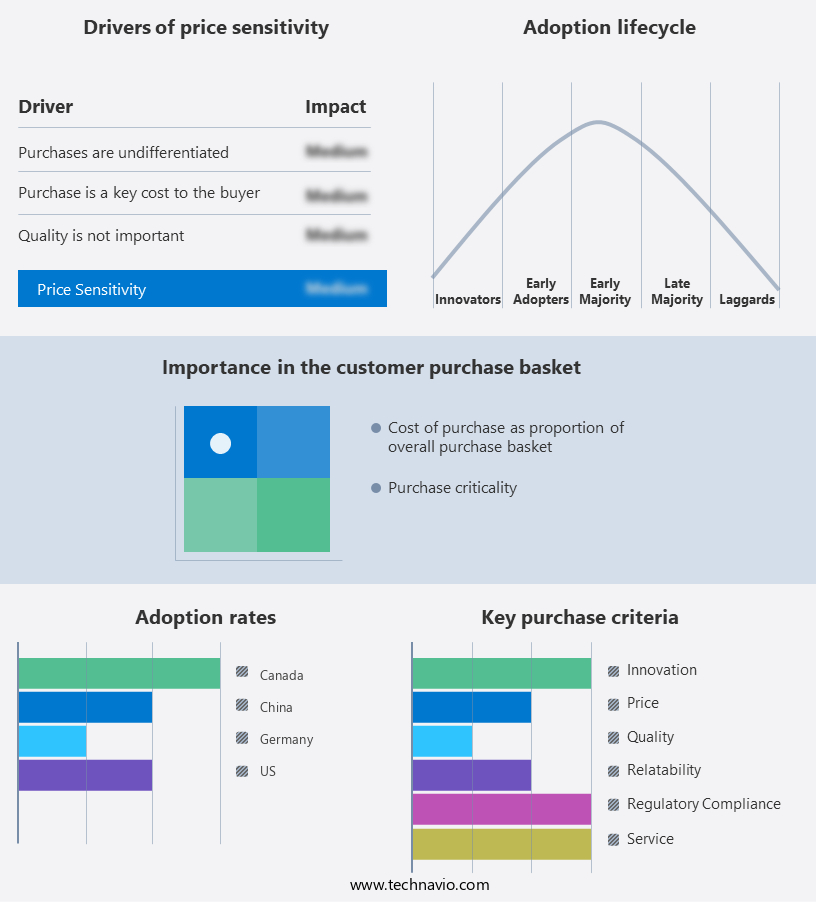
Customer Landscape
Key Companies & Market Insights
Companies are implementing various strategies, such as strategic alliances, market forecast, partnerships, mergers and acquisitions, geographical expansion, and product/service launches, to enhance their presence in the market. The market research and growth report includes detailed analyses of the competitive landscape of the market and information about key companies, including:
- Baiyang Investment Group Inc.
- Dahu Aquaculture Co. Ltd.
- Homey Group International Inc.
- Lana Springs Fish Farm
- OWEN AND WILLIAMS
- Quintons Orchard Fish Farm
- Shandong Oriental Ocean Technology Co. Ltd.
- VS Fisheries
- Zhanjiang Guolian Aquatic Products Co. Ltd.
- Zoneco Group Co. Ltd.
Qualitative and quantitative analysis of companies has been conducted to help clients understand the wider business environment as well as the strengths and weaknesses of key market players. Data is qualitatively analyzed to categorize companies as pure play, category-focused, industry-focused, and diversified; it is quantitatively analyzed to categorize companies as dominant, leading, strong, tentative, and weak.
Research Analyst Overview
Carp, a popular edible fish species within the Cyprinidae family, has gained significant attention due to its nutritional value and sustainability in aquaculture. This fish is a rich source of proteins, essential minerals, and omega-3 fatty acids, making it an ideal choice for individuals following protein-rich diets or seeking healthier food options. With the rising awareness of health consciousness and the increasing prevalence of chronic diseases, carp has become a preferred protein source for many. Aquaculture, a sustainable method of farming, plays a crucial role in meeting the growing demand for carp. The diversity of carp species, including grass carp, black carp, bighead carp, crucian carp, catla carp, and common carp, offers various options for consumers.
Further, carp farming practices have evolved, focusing on environmentally friendly methods and certification to ensure food safety and consumer confidence. The urbanization trend and rising incomes have led to a wave in carp consumption, with business-to-consumer platforms and e-commerce contributing to its accessibility. Carp is prepared in various ways, such as smoked, marinated, or prepared as value-added products, catering to diverse consumer preferences. The health advantages of carp, including bone health, heart health, and muscle building, have made it a staple food choice for many populations. Temperatures and aquaculture methods are continually being optimized to improve carp farming efficiency and productivity.
Additionally, the carp market is growing rapidly, driven by advancements in aquaculture technology and sustainable fish farming practices. Carp farming innovations focus on improving fish nutrition and health benefits, such as boosting immunity, enhancing fish and skin health, and promoting cardiovascular health. Carp breeding and farming business investments are increasing as consumers seek ethical seafood and healthy eating habits. Carp sustainability is a key focus, with aquaculture development aiming to reduce environmental effects and promote sustainable seafood. Fish farming techniques, including carp farming ethics, are evolving to ensure responsible production. Processed food and fish oil supplements derived from carp are gaining popularity for their benefits to muscle, bone, brain, and vision health. Fish traceability and online sales also contribute to growing consumer trust and demand for quality carp products.
|
Market Scope |
|
|
Report Coverage |
Details |
|
Page number |
176 |
|
Base year |
2023 |
|
Historic period |
2018-2022 |
|
Forecast period |
2024-2028 |
|
Growth momentum & CAGR |
Accelerate at a CAGR of 6.7% |
|
Market Growth 2024-2028 |
USD 13.3 billion |
|
Market structure |
Concentrated |
|
YoY growth 2023-2024(%) |
6.0 |
|
Key countries |
US, Canada, China, and Germany |
|
Competitive landscape |
Leading Companies, Market Positioning of Companies, Competitive Strategies, and Industry Risks |
What are the Key Data Covered in this Market Research and Growth Report?
- CAGR of the market during the forecast period
- Detailed information on factors that will drive the market growth and forecasting between 2024 and 2028
- Precise estimation of the size of the market and its contribution of the market in focus to the parent market
- Accurate predictions about upcoming market growth and trends and changes in consumer behaviour
- Growth of the market across APAC, North America, Europe, South America, and Middle East and Africa
- Thorough analysis of the market's competitive landscape and detailed information about companies
- Comprehensive analysis of factors that will challenge the growth of market companies
We can help! Our analysts can customize this market research report to meet your requirements. Get in touch
 RIA -
RIA - 
