Cell Sorting Market Analysis North America, Europe, Asia, Rest of World (ROW) - US, China, Germany, UK, Japan - Size and Forecast 2024-2028

Cell Sorting Market Analysis North America, Europe, Asia, Rest of World (ROW) - US, China, Germany, UK, Japan - Size and Forecast 2024-2028

Published: Jul 2024 162 Pages SKU: IRTNTR75875

Market Overview at a Glance

$142.9 Mn
Market Opportunity
8.09%
CAGR
7.32
YoY growth 2023-2024(%)

Cell Sorting Market Size 2024-2028 

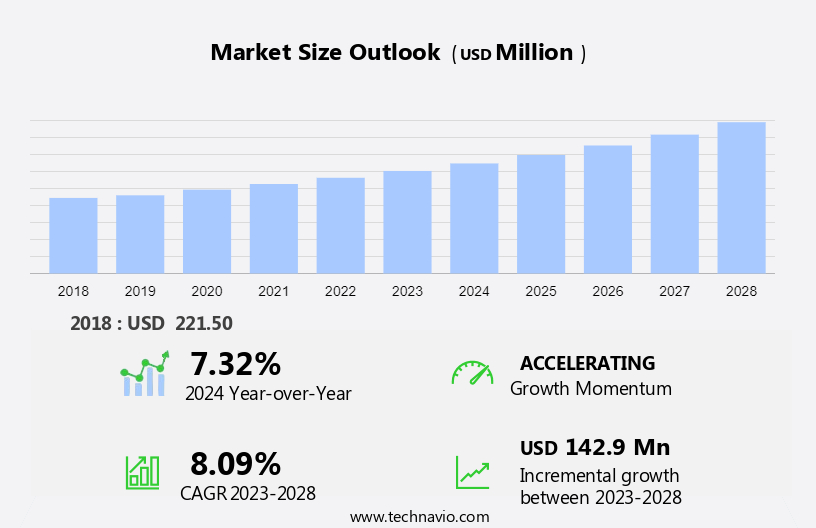
The cell sorting market size is forecast to increase by USD 142.9 billion at a CAGR of 8.09% between 2023 and 2028. The market is experiencing significant growth due to the increasing prevalence of chronic diseases, such as diabetes, and the subsequent demand for targeted therapies. Microfluidic technology, a key enabler of cell sorting, is gaining traction in healthcare and pharma industries for its ability to separate cells with high precision. This technology is particularly valuable in research applications, including genetic engineering and forensics. However, the market faces challenges, including the lack of adequately trained laboratory professionals and the high cost of equipment. In emerging economies, healthcare expenditure is on the rise, making the adoption of advanced cell sorting techniques increasingly attractive.

Cell Sorting Market Size

 Request Free Sample

The market is witnessing significant research activities in the areas of cancer, HIV, Alzheimer's disease, and other chronic diseases. These conditions necessitate the need for novel therapeutics and better understanding of cells, leading to increased interest in cell sorting technologies. Funding and investments have been pouring into this sector due to its potential to revolutionize the pharmaceutical and biotechnology industries. According to recent reports, The market is expected to grow steadily, driven by advancements in cell sorting technologies and their applications in various industries.

The market holds immense potential in the pharmaceutical and biotechnology industries, particularly in the development of new therapeutics for chronic diseases such as diabetes. With the increasing incidences of these diseases, the demand for better diagnostic tools and targeted treatments is on the rise. Cell sorting technologies offer a promising solution to these challenges, making them a significant area of interest for researchers and investors alike. In conclusion, the market is poised for growth due to its applications in various research areas and industries. With continued research and investments, we can expect significant advancements in cell sorting technologies, leading to new discoveries and innovations in the field of pharmaceuticals and biotechnology.

Market Segmentation

The market research report provides comprehensive data (region-wise segment analysis), with forecasts and estimates in "USD million" for the period 2024-2028, as well as historical data from 2018-2022 for the following segments.
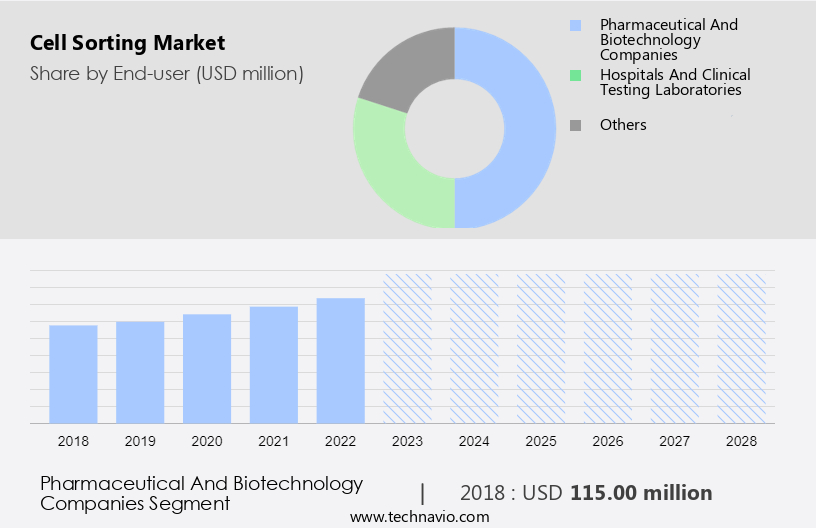
  • End-user
    • Pharmaceutical and biotechnology companies
    • Hospitals and clinical testing laboratories
    • Others
  • Technology
    • Fluorescence-based droplet cell sorting
    • Magnetic-activated cell sorting
    • Micro-electromechanical systems
  • Geography
    • North America
      • US
    • Europe
      • Germany
      • UK
    • Asia
      • China
      • Japan
    • Rest of World (ROW)

By End-user Insights

The pharmaceutical and biotechnology companies segment is estimated to witness significant growth during the forecast period. In the realm of pharmaceutical and biotechnology research, cell-based investigations hold significant importance for drug discovery, disease comprehension, and personalized medicine. The isolation of specific cell populations is essential for these studies, ensuring the precision and authenticity of the cells employed in experiments or therapies. This becomes particularly vital when dealing with infrequent cell populations or subgroups possessing distinctive traits. Two leading companies, Becton Dickinson and Danaher, dominate the international market. These corporations offer cell sorting apparatuses that cater specifically to the pharmaceutical and biotechnology sectors. Becton Dickinson provides the BD FACSAria cell sorter, a widely adopted instrument in research institutions, pharmaceutical companies, and biotechnology firms.

Investments and funding in the pharmaceutical and biotechnology sectors continue to grow, fueling research activities in various disease areas. The market is poised to benefit from this trend, as the demand for advanced cell sorting technologies increases. Companies like Becton Dickinson and Danaher are well-positioned to capitalize on this growth, given their expertise in providing cell sorting instruments to the pharmaceutical and biotechnology sectors. In conclusion, cell sorting is a critical technology in the pharmaceutical and biotechnology industry, enabling the isolation of specific cell populations for research and therapy applications. The increasing incidences of diseases like HIV, cancer, and Alzheimer's disease necessitate the development of advanced cell sorting technologies, driving investments and funding in this market.

Cell Sorting Market Size

Get a glance at the market share of various segments Request Free Sample

The pharmaceutical and biotechnology companies segment accounted for USD 115.00 million in 2018 and showed a gradual increase during the forecast period.

Regional Insights

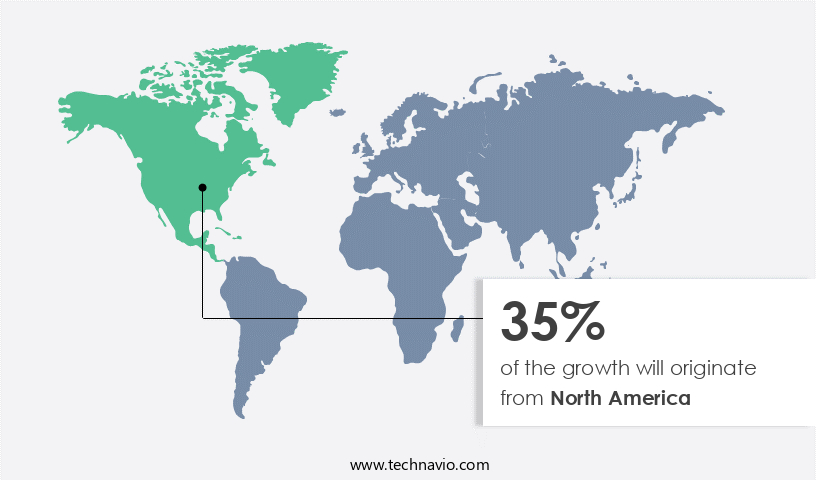
North America is estimated to contribute 35% to the growth of the global market during the forecast period. Technavio's analysts have elaborately explained the regional trends and drivers that shape the market during the forecast period.

Cell Sorting Market Share by Geography

For more insights on the market share of various regions Request Free Sample

In North America, the market is experiencing significant growth in the United States, Canada, and Mexico. This expansion is attributed to increased government funding for cell-based research in these countries. The US, in particular, is an attractive investment destination due to financial support from organizations like the National Institutes of Health (NIH) and the Biomedical Advanced Research and Development Authority (BARDA). These entities provide funding to small businesses and companies focusing on the development of innovative therapeutics based on cells. Cell sorting technologies play a crucial role in this field, enabling researchers to isolate cells of interest based on variations in cell size, surface protein expression, and morphology. These advancements are essential for the progression of regenerative medicine research, particularly in the treatment of chronic diseases.

Our researchers analyzed the data with 2023 as the base year, along with the key drivers, trends, and challenges. A holistic analysis of drivers will help companies refine their marketing strategies to gain a competitive advantage.

Market Driver

The increasing prevalence of chronic diseases is the key driver of the market. In the United States, the demand for cell sorting technology is escalating due to the rising prevalence of chronic diseases, such as diabetes and cancer. According to the Centers for Disease Control and Prevention (CDC), approximately 38.4 million Americans had diabetes in 2024, representing 11.6% of the population. Chronic diseases, including cancer, cardiovascular diseases (CVDs), autoimmune disorders, and infectious diseases, pose substantial challenges to healthcare systems. Cell sorting is an essential tool for medical researchers and scientists to separate distinct cells from a complex mixture, offering valuable insights into disease mechanisms, identifying biomarkers, and creating targeted therapies. Biotechnology and BioPharmaceutical industries are increasingly utilizing cell sorting techniques, such as single cell sorting, magnetic cell sorting, IsoRaft arrays, and DEParrays, to advance research and development in the field.

Flow cytometry is another widely used cell sorting technology that facilitates the analysis and separation of cells based on their physical and chemical properties. These advanced cell sorting technologies are pivotal in understanding the intricacies of various diseases and developing effective treatments. Cell sorting technology plays a critical role in the discovery and development of innovative treatments for chronic diseases, providing researchers with the ability to isolate and study specific cells, enabling a deeper understanding of disease mechanisms and the identification of potential biomarkers and therapeutic targets. This knowledge is crucial for creating targeted therapies and personalized medicine, ultimately improving patient outcomes and reducing healthcare costs.

Market Trends

The growing adoption of genetic engineering in forensic research is the upcoming trend in the market. In the realm of biology laboratories, the significance of cell sorting has grown substantially due to its role in cell isolation and molecular biological techniques. This technology is instrumental in various fields, including proteomics, where the analysis of single tumor cells is crucial. Cell Sorting Reagents and Cell Sorting Services are essential components of this technology, facilitating precise separation of cells based on specific characteristics. The increasing demand for advanced molecular biological analysis in research and diagnostic applications has driven the use of cell sorting. This technology allows for the identification and isolation of specific cell populations, enabling in-depth analysis of their biological functions.

In the US, as of April 2024, the homicide rate was 7.5 per 100,000 inhabitants. The increasing homicide rates have led to a ripple in investments in forensic research, emphasizing the importance of advanced technologies like cell sorting in this field. In conclusion, cell sorting technology plays a pivotal role in various applications, including molecular biological research and forensic investigations. Its ability to isolate specific cell populations based on distinct characteristics makes it an indispensable tool for scientists and investigators alike. With the growing demand for advanced molecular biological analysis, the future of cell sorting looks promising.

Market Challenge

The lack of trained laboratory professionals is a key challenge affecting the market growth. Cell sorting, a crucial technique in life sciences research and diagnostics, relies heavily on the accurate analysis of experimental results. The correlation of these results with the underlying hypothesis is equally significant. However, the adoption of cell sorting techniques, particularly in emerging economies, is hindered due to a lack of adequately trained laboratory personnel. In developing regions such as Asia, Africa, and South America, there is a scarcity of professionals with expertise in the latest microfluidic technologies and laboratory equipment. Furthermore, even in laboratories equipped with advanced diagnostic devices, the lack of adequate training for personnel can hinder optimal results.

This skill gap poses a challenge to the widespread adoption of cell sorting techniques, especially in the context of chronic diseases such as diabetes and the development of targeted therapies. Pharmaceutical companies and healthcare expenditure in these regions can significantly benefit from investing in training programs to bridge this gap and enhance the effectiveness of cell sorting applications.

Exclusive Customer Landscape

The market forecasting report includes the adoption lifecycle of the market, covering from the innovator's stage to the laggard's stage. It focuses on adoption rates in different regions based on penetration. Furthermore, the report also includes key purchase criteria and drivers of price sensitivity to help companies evaluate and develop their market growth analysis strategies.
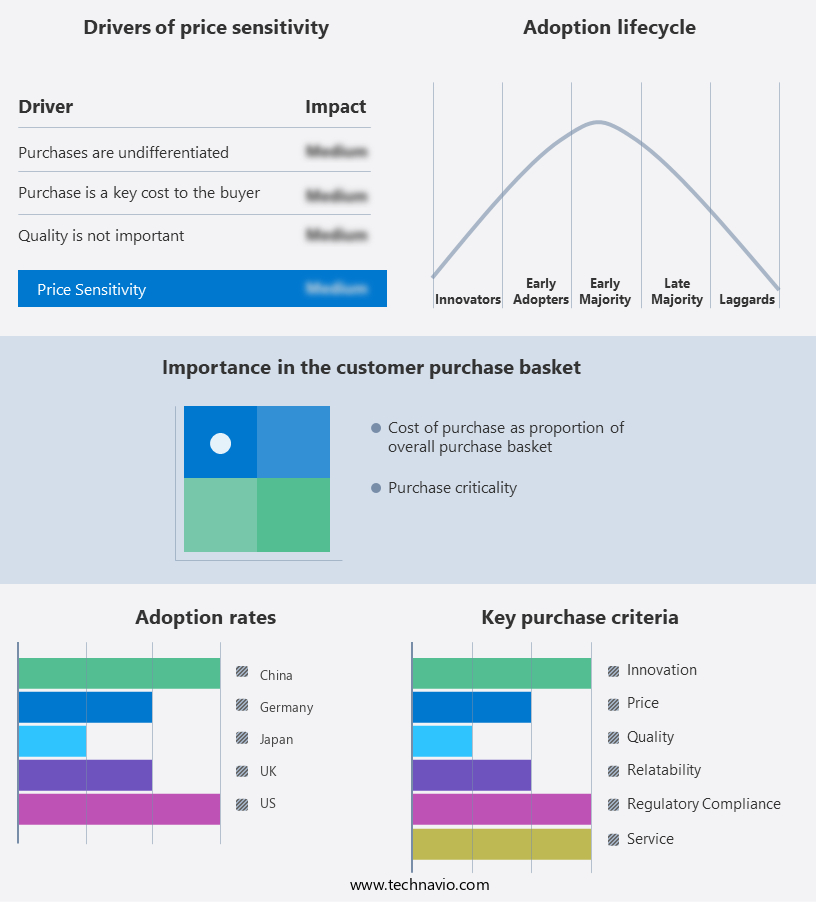
Cell Sorting Market Share by Geography

 Customer Landscape

Key Companies & Market Insights

Companies are implementing various strategies, such as strategic alliances, partnerships, mergers and acquisitions, geographical expansion, and product/service launches, to enhance their presence in the market.

Becton Dickinson and Co. - The company offers the facsdiscover S 8 cell sorter, which is designed to obtain insights on cell populations and characteristics that can be visually confirmed in real-time.

The market research and growth report includes detailed analyses of the competitive landscape of the market and information about key companies, including:

  • Bio Rad Laboratories Inc.
  • Bulldog-Bio Inc.
  • Cell Microsystems Inc.
  • Cytonome ST LLC
  • Danaher Corp.
  • Guandong Benice Intelligent Equipment Co.Ltd.
  • Miltenyi Biotec B.V. and Co. KG
  • Molecular Device LLC
  • Namocell Inc.
  • NanoCellect Biomedical Inc.
  • On-Chip Biotechnologies Co. Ltd.
  • Semco Infratech Pvt. Ltd.
  • Sony Group Corp.
  • STEMCELL Technologies Inc.
  • Terumo Corp.
  • Thermo Fisher Scientific Inc.
  • Union Biometrica Inc.
  • Xiamen Tmax Battery Equipments Ltd.
  • Xiamen WinAck Battery Technology Co.

Qualitative and quantitative analysis of companies has been conducted to help clients understand the wider business environment as well as the strengths and weaknesses of key market players. Data is qualitatively analyzed to categorize companies as pure play, category-focused, industry-focused, and diversified; it is quantitatively analyzed to categorize companies as dominant, leading, strong, tentative, and weak.

Research Analyst Overview

The market is witnessing significant growth due to the increasing research activities in the pharmaceutical and biotechnology sector, particularly in the areas of cancer, HIV, Alzheimer's disease, and other chronic diseases. Funding and investments in these areas have been strong, driving the demand for advanced cell sorting instruments and reagents and consumables. Cell sorting technologies, including microfluidics, magnetic cell sorting, isofluidic arrays, and deparrays, are of great interest in stem cell research, clinical applications, and healthcare institutions such as medical schools, hospitals testing laboratories, and research institutions. These technologies enable the isolation and characterization of cells based on variations in cell size, surface protein expression, morphology, and other parameters. Budgetary constraints and the need for skilled personnel can limit the adoption of cell sorting technologies in some laboratories.

However, product development and innovation, such as droplet cell sorting and single cell sorting, continue to drive market growth. Biotechnology and biopharmaceutical companies are also investing in cell sorting technologies for the development of novel therapeutics and targeted therapies. The market is expected to grow significantly due to the increasing healthcare expenditure in emerging economies and the rising incidences of cancer and other chronic diseases. Flow cytometry, a widely used cell sorting technology, is also gaining popularity in immunology research, drug discovery, and molecular biological techniques. Proteomics and single tumor cell analysis are other emerging areas of interest in the market.

Market Scope

Report Coverage

Details

Page number

162

Base year

2023

Historic period

2018-2022

Forecast period

2024-2028

Growth momentum & CAGR

Accelerate at a CAGR of 8.09%

Market Growth 2024-2028

USD 142.9 million

Market structure

Fragmented

YoY growth 2023-2024(%)

7.32

Regional analysis

North America, Europe, Asia, and Rest of World (ROW)

Performing market contribution

North America at 35%

Key countries

US, China, Germany, UK, and Japan

Competitive landscape

Leading Companies, Market Positioning of Companies, Competitive Strategies, and Industry Risks

Key companies profiled

Becton Dickinson and Co., Bio Rad Laboratories Inc., Bulldog-Bio Inc., Cell Microsystems Inc., Cytonome ST LLC, Danaher Corp., Guandong Benice Intelligent Equipment Co.Ltd., Miltenyi Biotec B.V. and Co. KG, Molecular Device LLC, Namocell Inc., NanoCellect Biomedical Inc., On-Chip Biotechnologies Co. Ltd., Semco Infratech Pvt. Ltd., Sony Group Corp., STEMCELL Technologies Inc., Terumo Corp., Thermo Fisher Scientific Inc., Union Biometrica Inc., Xiamen Tmax Battery Equipments Ltd., and Xiamen WinAck Battery Technology Co.

Market dynamics

Parent market analysis, market growth inducers and obstacles, market forecast, fast-growing and slow-growing segment analysis, COVID-19 impact and recovery analysis and future consumer dynamics, market condition analysis for the forecast period

Customization purview

If our market report has not included the data that you are looking for, you can reach out to our analysts and get segments customized.

Request Free Sample

What are the Key Data Covered in this Market Research and Growth Report?

  • CAGR of the market during the forecast period
  • Detailed information on factors that will drive the market growth and forecasting between 2024 and 2028
  • Precise estimation of the size of the market  and its contribution of the market in focus to the parent market
  • Accurate predictions about upcoming market growth and trends and changes in consumer behaviour
  • Growth of the market across North America, Europe, Asia, and Rest of World (ROW)
  • Thorough analysis of the market's competitive landscape and detailed information about companies
  • Comprehensive analysis of factors that will challenge the growth of market companies

We can help! Our analysts can customize this market research report to meet your requirements. Get in touch

1 Executive Summary

  • 1.1 Market overview
    • Executive Summary - Chart on Market Overview
    • Executive Summary - Data Table on Market Overview
    • Executive Summary - Chart on Global Market Characteristics
    • Executive Summary - Chart on Market by Geography
    • Executive Summary - Chart on Market Segmentation by End-user
    • Executive Summary - Chart on Market Segmentation by Technology
    • Executive Summary - Chart on Incremental Growth
    • Executive Summary - Data Table on Incremental Growth
    • Executive Summary - Chart on Company Market Positioning

2 Market Landscape

  • 2.1 Market ecosystem
    • Parent Market
    • Data Table on - Parent Market
  • 2.2 Market characteristics
    • Market characteristics analysis
  • 2.3 Value chain analysis
    • Value Chain Analysis

3 Market Sizing

  • 3.1 Market definition
    • Offerings of companies included in the market definition
  • 3.2 Market segment analysis
    • Market segments
  • 3.3 Market size 2023
    • 3.4 Market outlook: Forecast for 2023-2028
      • Chart on Global - Market size and forecast 2023-2028 ($ million)
      • Data Table on Global - Market size and forecast 2023-2028 ($ million)
      • Chart on Global Market: Year-over-year growth 2023-2028 (%)
      • Data Table on Global Market: Year-over-year growth 2023-2028 (%)

    4 Historic Market Size

    • 4.1 Global Cell Sorting Market 2018 - 2022
      • Historic Market Size - Data Table on Global Cell Sorting Market 2018 - 2022 ($ million)
    • 4.2 End-user segment analysis 2018 - 2022
      • Historic Market Size - End-user Segment 2018 - 2022 ($ million)
    • 4.3 Technology segment analysis 2018 - 2022
      • Historic Market Size - Technology Segment 2018 - 2022 ($ million)
    • 4.4 Geography segment analysis 2018 - 2022
      • Historic Market Size - Geography Segment 2018 - 2022 ($ million)
    • 4.5 Country segment analysis 2018 - 2022
      • Historic Market Size - Country Segment 2018 - 2022 ($ million)

    5 Five Forces Analysis

    • 5.1 Five forces summary
      • Five forces analysis - Comparison between 2023 and 2028
    • 5.2 Bargaining power of buyers
      • Bargaining power of buyers - Impact of key factors 2023 and 2028
    • 5.3 Bargaining power of suppliers
      • Bargaining power of suppliers - Impact of key factors in 2023 and 2028
    • 5.4 Threat of new entrants
      • Threat of new entrants - Impact of key factors in 2023 and 2028
    • 5.5 Threat of substitutes
      • Threat of substitutes - Impact of key factors in 2023 and 2028
    • 5.6 Threat of rivalry
      • Threat of rivalry - Impact of key factors in 2023 and 2028
    • 5.7 Market condition
      • Chart on Market condition - Five forces 2023 and 2028

    6 Market Segmentation by End-user

    • 6.1 Market segments
      • Chart on End-user - Market share 2023-2028 (%)
      • Data Table on End-user - Market share 2023-2028 (%)
    • 6.2 Comparison by End-user
      • Chart on Comparison by End-user
      • Data Table on Comparison by End-user
    • 6.3 Pharmaceutical and biotechnology companies - Market size and forecast 2023-2028
      • Chart on Pharmaceutical and biotechnology companies - Market size and forecast 2023-2028 ($ million)
      • Data Table on Pharmaceutical and biotechnology companies - Market size and forecast 2023-2028 ($ million)
      • Chart on Pharmaceutical and biotechnology companies - Year-over-year growth 2023-2028 (%)
      • Data Table on Pharmaceutical and biotechnology companies - Year-over-year growth 2023-2028 (%)
    • 6.4 Hospitals and clinical testing laboratories - Market size and forecast 2023-2028
      • Chart on Hospitals and clinical testing laboratories - Market size and forecast 2023-2028 ($ million)
      • Data Table on Hospitals and clinical testing laboratories - Market size and forecast 2023-2028 ($ million)
      • Chart on Hospitals and clinical testing laboratories - Year-over-year growth 2023-2028 (%)
      • Data Table on Hospitals and clinical testing laboratories - Year-over-year growth 2023-2028 (%)
    • 6.5 Others - Market size and forecast 2023-2028
      • Chart on Others - Market size and forecast 2023-2028 ($ million)
      • Data Table on Others - Market size and forecast 2023-2028 ($ million)
      • Chart on Others - Year-over-year growth 2023-2028 (%)
      • Data Table on Others - Year-over-year growth 2023-2028 (%)
    • 6.6 Market opportunity by End-user
      • Market opportunity by End-user ($ million)
      • Data Table on Market opportunity by End-user ($ million)

    7 Market Segmentation by Technology

    • 7.1 Market segments
      • Chart on Technology - Market share 2023-2028 (%)
      • Data Table on Technology - Market share 2023-2028 (%)
    • 7.2 Comparison by Technology
      • Chart on Comparison by Technology
      • Data Table on Comparison by Technology
    • 7.3 Fluorescence-based droplet cell sorting - Market size and forecast 2023-2028
      • Chart on Fluorescence-based droplet cell sorting - Market size and forecast 2023-2028 ($ million)
      • Data Table on Fluorescence-based droplet cell sorting - Market size and forecast 2023-2028 ($ million)
      • Chart on Fluorescence-based droplet cell sorting - Year-over-year growth 2023-2028 (%)
      • Data Table on Fluorescence-based droplet cell sorting - Year-over-year growth 2023-2028 (%)
    • 7.4 Magnetic-activated cell sorting - Market size and forecast 2023-2028
      • Chart on Magnetic-activated cell sorting - Market size and forecast 2023-2028 ($ million)
      • Data Table on Magnetic-activated cell sorting - Market size and forecast 2023-2028 ($ million)
      • Chart on Magnetic-activated cell sorting - Year-over-year growth 2023-2028 (%)
      • Data Table on Magnetic-activated cell sorting - Year-over-year growth 2023-2028 (%)
    • 7.5 Micro-electromechanical systems - Market size and forecast 2023-2028
      • Chart on Micro-electromechanical systems - Market size and forecast 2023-2028 ($ million)
      • Data Table on Micro-electromechanical systems - Market size and forecast 2023-2028 ($ million)
      • Chart on Micro-electromechanical systems - Year-over-year growth 2023-2028 (%)
      • Data Table on Micro-electromechanical systems - Year-over-year growth 2023-2028 (%)
    • 7.6 Market opportunity by Technology
      • Market opportunity by Technology ($ million)
      • Data Table on Market opportunity by Technology ($ million)

    8 Customer Landscape

    • 8.1 Customer landscape overview
      • Analysis of price sensitivity, lifecycle, customer purchase basket, adoption rates, and purchase criteria

    9 Geographic Landscape

    • 9.1 Geographic segmentation
      • Chart on Market share by geography 2023-2028 (%)
      • Data Table on Market share by geography 2023-2028 (%)
    • 9.2 Geographic comparison
      • Chart on Geographic comparison
      • Data Table on Geographic comparison
    • 9.3 North America - Market size and forecast 2023-2028
      • Chart on North America - Market size and forecast 2023-2028 ($ million)
      • Data Table on North America - Market size and forecast 2023-2028 ($ million)
      • Chart on North America - Year-over-year growth 2023-2028 (%)
      • Data Table on North America - Year-over-year growth 2023-2028 (%)
    • 9.4 Europe - Market size and forecast 2023-2028
      • Chart on Europe - Market size and forecast 2023-2028 ($ million)
      • Data Table on Europe - Market size and forecast 2023-2028 ($ million)
      • Chart on Europe - Year-over-year growth 2023-2028 (%)
      • Data Table on Europe - Year-over-year growth 2023-2028 (%)
    • 9.5 Asia - Market size and forecast 2023-2028
      • Chart on Asia - Market size and forecast 2023-2028 ($ million)
      • Data Table on Asia - Market size and forecast 2023-2028 ($ million)
      • Chart on Asia - Year-over-year growth 2023-2028 (%)
      • Data Table on Asia - Year-over-year growth 2023-2028 (%)
    • 9.6 Rest of World (ROW) - Market size and forecast 2023-2028
      • Chart on Rest of World (ROW) - Market size and forecast 2023-2028 ($ million)
      • Data Table on Rest of World (ROW) - Market size and forecast 2023-2028 ($ million)
      • Chart on Rest of World (ROW) - Year-over-year growth 2023-2028 (%)
      • Data Table on Rest of World (ROW) - Year-over-year growth 2023-2028 (%)
    • 9.7 US - Market size and forecast 2023-2028
      • Chart on US - Market size and forecast 2023-2028 ($ million)
      • Data Table on US - Market size and forecast 2023-2028 ($ million)
      • Chart on US - Year-over-year growth 2023-2028 (%)
      • Data Table on US - Year-over-year growth 2023-2028 (%)
    • 9.8 China - Market size and forecast 2023-2028
      • Chart on China - Market size and forecast 2023-2028 ($ million)
      • Data Table on China - Market size and forecast 2023-2028 ($ million)
      • Chart on China - Year-over-year growth 2023-2028 (%)
      • Data Table on China - Year-over-year growth 2023-2028 (%)
    • 9.9 Germany - Market size and forecast 2023-2028
      • Chart on Germany - Market size and forecast 2023-2028 ($ million)
      • Data Table on Germany - Market size and forecast 2023-2028 ($ million)
      • Chart on Germany - Year-over-year growth 2023-2028 (%)
      • Data Table on Germany - Year-over-year growth 2023-2028 (%)
    • 9.10 UK - Market size and forecast 2023-2028
      • Chart on UK - Market size and forecast 2023-2028 ($ million)
      • Data Table on UK - Market size and forecast 2023-2028 ($ million)
      • Chart on UK - Year-over-year growth 2023-2028 (%)
      • Data Table on UK - Year-over-year growth 2023-2028 (%)
    • 9.11 Japan - Market size and forecast 2023-2028
      • Chart on Japan - Market size and forecast 2023-2028 ($ million)
      • Data Table on Japan - Market size and forecast 2023-2028 ($ million)
      • Chart on Japan - Year-over-year growth 2023-2028 (%)
      • Data Table on Japan - Year-over-year growth 2023-2028 (%)
    • 9.12 Market opportunity by geography
      • Market opportunity by geography ($ million)
      • Data Tables on Market opportunity by geography ($ million)

    10 Drivers, Challenges, and Opportunity/Restraints

    • 10.1 Market drivers
      • 10.2 Market challenges
        • 10.3 Impact of drivers and challenges
          • Impact of drivers and challenges in 2023 and 2028
        • 10.4 Market opportunities/restraints

          11 Competitive Landscape

          • 11.1 Overview
            • 11.2 Competitive Landscape
              • Overview on criticality of inputs and factors of differentiation
            • 11.3 Landscape disruption
              • Overview on factors of disruption
            • 11.4 Industry risks
              • Impact of key risks on business

            12 Competitive Analysis

            • 12.1 Companies profiled
              • Companies covered
            • 12.2 Market positioning of companies
              • Matrix on companies position and classification
            • 12.3 Becton Dickinson and Co.
              • Becton Dickinson and Co. - Overview
              • Becton Dickinson and Co. - Business segments
              • Becton Dickinson and Co. - Key news
              • Becton Dickinson and Co. - Key offerings
              • Becton Dickinson and Co. - Segment focus
            • 12.4 Bio Rad Laboratories Inc.
              • Bio Rad Laboratories Inc. - Overview
              • Bio Rad Laboratories Inc. - Business segments
              • Bio Rad Laboratories Inc. - Key news
              • Bio Rad Laboratories Inc. - Key offerings
              • Bio Rad Laboratories Inc. - Segment focus
            • 12.5 Bulldog-Bio Inc.
              • Bulldog-Bio Inc. - Overview
              • Bulldog-Bio Inc. - Product / Service
              • Bulldog-Bio Inc. - Key offerings
            • 12.6 Cell Microsystems Inc.
              • Cell Microsystems Inc. - Overview
              • Cell Microsystems Inc. - Product / Service
              • Cell Microsystems Inc. - Key offerings
            • 12.7 Cytonome ST LLC
              • Cytonome ST LLC - Overview
              • Cytonome ST LLC - Product / Service
              • Cytonome ST LLC - Key offerings
            • 12.8 Danaher Corp.
              • Danaher Corp. - Overview
              • Danaher Corp. - Business segments
              • Danaher Corp. - Key news
              • Danaher Corp. - Key offerings
              • Danaher Corp. - Segment focus
            • 12.9 Miltenyi Biotec B.V. and Co. KG
              • Miltenyi Biotec B.V. and Co. KG - Overview
              • Miltenyi Biotec B.V. and Co. KG - Product / Service
              • Miltenyi Biotec B.V. and Co. KG - Key news
              • Miltenyi Biotec B.V. and Co. KG - Key offerings
            • 12.10 Namocell Inc.
              • Namocell Inc. - Overview
              • Namocell Inc. - Product / Service
              • Namocell Inc. - Key offerings
            • 12.11 NanoCellect Biomedical Inc.
              • NanoCellect Biomedical Inc. - Overview
              • NanoCellect Biomedical Inc. - Product / Service
              • NanoCellect Biomedical Inc. - Key offerings
            • 12.12 On-Chip Biotechnologies Co. Ltd.
              • On-Chip Biotechnologies Co. Ltd. - Overview
              • On-Chip Biotechnologies Co. Ltd. - Product / Service
              • On-Chip Biotechnologies Co. Ltd. - Key offerings
            • 12.13 Sony Group Corp.
              • Sony Group Corp. - Overview
              • Sony Group Corp. - Business segments
              • Sony Group Corp. - Key news
              • Sony Group Corp. - Key offerings
              • Sony Group Corp. - Segment focus
            • 12.14 STEMCELL Technologies Inc.
              • STEMCELL Technologies Inc. - Overview
              • STEMCELL Technologies Inc. - Product / Service
              • STEMCELL Technologies Inc. - Key offerings
            • 12.15 Terumo Corp.
              • Terumo Corp. - Overview
              • Terumo Corp. - Business segments
              • Terumo Corp. - Key news
              • Terumo Corp. - Key offerings
              • Terumo Corp. - Segment focus
            • 12.16 Thermo Fisher Scientific Inc.
              • Thermo Fisher Scientific Inc. - Overview
              • Thermo Fisher Scientific Inc. - Business segments
              • Thermo Fisher Scientific Inc. - Key news
              • Thermo Fisher Scientific Inc. - Key offerings
              • Thermo Fisher Scientific Inc. - Segment focus
            • 12.17 Union Biometrica Inc.
              • Union Biometrica Inc. - Overview
              • Union Biometrica Inc. - Product / Service
              • Union Biometrica Inc. - Key offerings

            13 Appendix

            • 13.1 Scope of the report
              • 13.2 Inclusions and exclusions checklist
                • Inclusions checklist
                • Exclusions checklist
              • 13.3 Currency conversion rates for US$
                • Currency conversion rates for US$
              • 13.4 Research methodology
                • Research methodology
              • 13.5 Data procurement
                • Information sources
              • 13.6 Data validation
                • Data validation
              • 13.7 Validation techniques employed for market sizing
                • Validation techniques employed for market sizing
              • 13.8 Data synthesis
                • Data synthesis
              • 13.9 360 degree market analysis
                • 360 degree market analysis
              • 13.10 List of abbreviations
                • List of abbreviations

              Research Methodology

              Technavio presents a detailed picture of the market by way of study, synthesis, and summation of data from multiple sources. The analysts have presented the various facets of the market with a particular focus on identifying the key industry influencers. The data thus presented is comprehensive, reliable, and the result of extensive research, both primary and secondary.

              INFORMATION SOURCES

              Primary sources

              • Manufacturers and suppliers
              • Channel partners
              • Industry experts
              • Strategic decision makers

              Secondary sources

              • Industry journals and periodicals
              • Government data
              • Financial reports of key industry players
              • Historical data
              • Press releases

              DATA ANALYSIS

              Data Synthesis

              • Collation of data
              • Estimation of key figures
              • Analysis of derived insights

              Data Validation

              • Triangulation with data models
              • Reference against proprietary databases
              • Corroboration with industry experts

              REPORT WRITING

              Qualitative

              • Market drivers
              • Market challenges
              • Market trends
              • Five forces analysis

              Quantitative

              • Market size and forecast
              • Market segmentation
              • Geographical insights
              • Competitive landscape

              Interested in this report?

              Get your sample now to see our research methodology and insights!

              Download Now

              Frequently Asked Questions

              Cell Sorting market growth will increase by $ 142.9 mn during 2024-2028.

              The Cell Sorting market is expected to grow at a CAGR of 8.09% during 2024-2028.

              Cell Sorting market is segmented by End-user( Pharmaceutical and biotechnology companies, Hospitals and clinical testing laboratories, Others) Technology( Fluorescence-based droplet cell sorting, Magnetic-activated cell sorting, Micro-electromechanical systems)

              Becton Dickinson and Co., Bio Rad Laboratories Inc., Bulldog-Bio Inc., Cell Microsystems Inc., Cytonome ST LLC, Danaher Corp., Guandong Benice Intelligent Equipment Co.Ltd., Miltenyi Biotec B.V. and Co. KG, Molecular Device LLC, Namocell Inc., NanoCellect Biomedical Inc., On-Chip Biotechnologies Co. Ltd., Semco Infratech Pvt. Ltd., Sony Group Corp., STEMCELL Technologies Inc., Terumo Corp., Thermo Fisher Scientific Inc., Union Biometrica Inc., Xiamen Tmax Battery Equipments Ltd., Xiamen WinAck Battery Technology Co. are a few of the key vendors in the Cell Sorting market.

              North America will register the highest growth rate of 35% among the other regions. Therefore, the Cell Sorting market in North America is expected to garner significant business opportunities for the vendors during the forecast period.

              US, China, Germany, UK, Japan

              • Increasing prevalence of chronic diseasesThe growing prevalence of chronic diseases is the driving factor this market.
              • such as diabetes and cancer is the driving factor this market.
              • has increased the need for cell-based therapies. For instance is the driving factor this market.
              • as per latest data of CDC by 2024 is the driving factor this market.
              • about 38.4 million people had diabetes is the driving factor this market.
              • making 11.6% of the US population. Chronic diseases is the driving factor this market.
              • such as cancer is the driving factor this market.
              • cardiovascular diseases (CVDs) is the driving factor this market.
              • autoimmune disorders is the driving factor this market.
              • and infectious diseases is the driving factor this market.
              • pose significant challenges to healthcare systems worldwide. Cell sorting technology plays a crucial role in understanding and finding innovative treatments for these conditions.Cell sorting enables medical researchers and scientists to isolate specific cells from a heterogeneous population of cells is the driving factor this market.
              • providing deeper insights into disease mechanisms is the driving factor this market.
              • identifying biomarkers is the driving factor this market.
              • and developing targeted therapies. For example is the driving factor this market.
              • in cancer research is the driving factor this market.
              • cell sorting helps identify and isolate rare cancer stem cells that play a critical role in tumor growth and resistance to therapy. Understanding these interactions can lead to the development of more effective treatments and personalized medicine approaches.The increasing prevalence of chronic conditions also drives the need for precision medicine is the driving factor this market.
              • which focuses on tailoring treatments to individual patients based on their unique biological characteristics. Cell sorting enables the isolation of specific cell populations is the driving factor this market.
              • which can be characterized and analyzed further to identify biomarkers or develop personalized therapeutic strategies. Furthermore is the driving factor this market.
              • as the burden of chronic diseases escalates globally is the driving factor this market.
              • the demand for cell-based therapies is the driving factor this market.
              • such as stem cell therapy and immunotherapy is the driving factor this market.
              • is rising. Cell sorting technology enables the isolation and enrichment of specific cell types for use in these therapies is the driving factor this market.
              • ensuring the safety and efficacy of the final cell-based products. Thus is the driving factor this market.
              • the growing prevalence of chronic conditions will increase the demand for cell-based therapies is the driving factor this market.
              • which will boost the growth of the global cell sorting market during the forecast period. is the driving factor this market.

              The Cell Sorting market vendors should focus on grabbing business opportunities from the Pharmaceutical and biotechnology companies segment as it accounted for the largest market share in the base year.