
Cell Therapy Technologies Market Size 2024-2028
The cell therapy technologies market size is forecast to increase by USD 5.92 billion, at a CAGR of 19.7% between 2023 and 2028.
- The market is witnessing significant growth, driven by increased investment in this field. Mergers and acquisitions have become a common strategy for companies seeking to expand their presence and capabilities in cell therapy. However, this market also faces substantial challenges. High costs associated with cell therapy technologies pose a significant obstacle, limiting the accessibility and affordability of these advanced treatments for many patients. Despite these challenges, the potential of cell therapy is immense, with its ability to offer personalized, effective solutions for various diseases and conditions. The therapeutic benefits of cell therapy, including the potential for personalized medicine and improved clinical safety, efficacy, and genetic engineering, are attracting substantial interest from both industry and regulatory bodies.
- Companies that can navigate these challenges and find ways to reduce costs while maintaining quality and efficacy will be well-positioned to capitalize on the growing demand for cell therapy technologies. Strategic partnerships, collaborations, and innovations in manufacturing processes and technology could help address the cost issue and make these treatments more accessible to a broader patient population.
What will be the Size of the Cell Therapy Technologies Market during the forecast period?

Explore in-depth regional segment analysis with market size data - historical 2018-2022 and forecasts 2024-2028 - in the full report.
Request Free Sample
The market continues to evolve, driven by advancements in various sectors including cell viability assays, cell differentiation, tissue engineering, viral transduction, apoptosis assays, and cell purification methods. These technologies are integral to the development of immunomodulatory cells, such as CAR T-cells, and stem cell therapy. The ongoing unfolding of market activities is marked by the exploration of non-viral delivery methods and the integration of gene editing technology, like the CRISPR-Cas9 system, into cellular senescence research. Clinical trial design and cell line development are also key areas of focus, with the use of cell culture media and cytotoxicity assays ensuring regulatory compliance and maintaining good manufacturing practice.
Bioreactor technology and cell expansion protocols facilitate large-scale production, while cell isolation techniques and flow cytometry analysis enable precise cell characterization. The integration of drug delivery systems and gene therapy vectors further expands the potential applications of cell therapy technologies in personalized medicine and regenerative medicine.
How is this Cell Therapy Technologies Industry segmented?
The cell therapy technologies industry research report provides comprehensive data (region-wise segment analysis), with forecasts and estimates in "USD million" for the period 2024-2028, as well as historical data from 2018-2022 for the following segments.
- Technology
- Somatic cell technologies
- Gene modification techniques
- Genome editing technologies
- Others
- End-user
- Biopharmaceuticals and biotechnology companies
- CROs and CMOs
- Research institute and cell banks
- Geography
- North America
- US
- Europe
- Germany
- UK
- APAC
- China
- Japan
- Rest of World (ROW)
- North America
By Technology Insights
The somatic cell technologies segment is estimated to witness significant growth during the forecast period.
The market encompasses various segments, with somatic cell technologies holding a substantial position. This category utilizes cells derived from the human body, which undergo purification, propagation, and differentiation into specific therapeutic cell products. These unmodified cells are then administered to patients for treatment. Technological intricacies exist in the purification, propagation, and differentiation processes. However, the innovation factor in this segment is relatively low due to the established nature of many somatic cell therapies, such as CAR T-cell therapy, stem cell therapy, and immunomodulatory cell therapies. These treatments have been in practice for an extended period, employing techniques like cell viability assays, proliferation assays, and cytotoxicity assays.
Advancements in gene editing technology, such as the CRISPR-Cas9 system, have led to the emergence of gene therapy vectors and targeted cell therapies. These innovative approaches involve genetic modifications to cells, enabling them to deliver therapeutic genes or selectively target diseased cells. Additionally, non-viral delivery methods and tissue engineering techniques have gained traction, offering alternatives to viral transduction. Regenerative medicine, including cellular senescence and cell signaling pathways, is another evolving area in cell therapy technologies. Bioreactor technology and cell expansion protocols facilitate the mass production of cells for clinical applications. Cell isolation techniques, such as flow cytometry analysis, ensure the purity and quality of cell populations.
Regulatory compliance and good manufacturing practices are crucial aspects of the market. Drug delivery systems and personalized medicine are also gaining significance, with cell banking methods and clinical trial design playing essential roles in their implementation. Overall, the market is characterized by continuous innovation and advancements in various areas, including cell culture media, apoptosis assays, and cell purification methods.
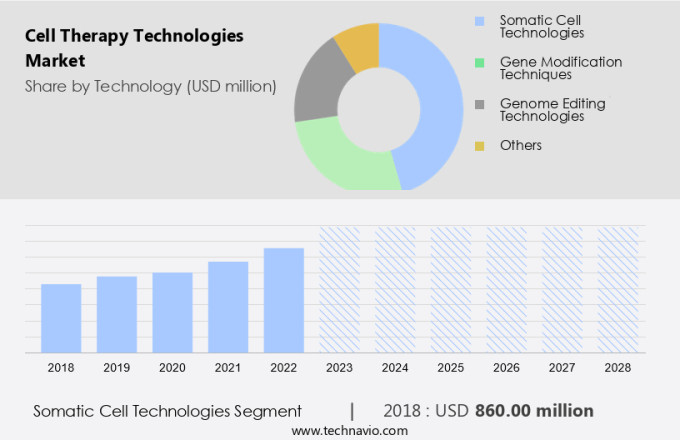
The Somatic cell technologies segment was valued at USD 860.00 billion in 2018 and showed a gradual increase during the forecast period.
Regional Analysis
North America is estimated to contribute 39% to the growth of the global market during the forecast period. Technavio's analysts have elaborately explained the regional trends and drivers that shape the market during the forecast period.

The market in North America is experiencing significant growth, fueled by groundbreaking research, development, and commercialization of innovative therapies. Key areas of focus include CAR T-cell therapy, gene editing technology, stem cell therapy, and regenerative medicine. Notably, RxCell's recent patent (US patent 11,946,069) for its induced pluripotent stem cells (iPSCs)-based cell therapy approach adds to the region's momentum. This patent grants RxCell exclusive rights to utilize iPSC-derived cells for treating various diseases, offering the potential to generate multiple cellular therapy products from a single source of iPSCs. Gene editing technology, such as CRISPR-Cas9, is revolutionizing cell therapy by enabling precise modifications to DNA sequences, leading to improved cellular senescence and differentiation.
Proliferation assays, cytotoxicity assays, and cell viability assays are essential tools for monitoring cell health and ensuring efficacy during the development and manufacturing process. Good manufacturing practices (GMP) and regulatory compliance are critical for ensuring the safety and efficacy of cell therapies. Drug delivery systems and bioreactor technology are also advancing, enabling more efficient cell expansion protocols and targeted cell therapy approaches. In conclusion, the market in North America is thriving, with a focus on personalized medicine, cell banking methods, and clinical trial design to bring innovative therapies to market.
Market Dynamics
Our researchers analyzed the data with 2023 as the base year, along with the key drivers, trends, and challenges. A holistic analysis of drivers will help companies refine their marketing strategies to gain a competitive advantage.
What are the key market drivers leading to the rise in the adoption of Cell Therapy Technologies Industry?
- A significant contributor to the market's growth is the heightened investment in cell therapy technologies.
- The market is witnessing substantial investment and innovation, propelling advancements in areas such as cellular immunotherapy, gene editing technology, and stem cell therapy. Notably, CAR T-cell therapy and immunomodulatory cells are at the forefront of this progress. For instance, Fujifilm's recent USD200 million investment in its subsidiaries, Fujifilm Cellular Dynamics and Fujifilm Diosynth Biotechnologies, is aimed at enhancing manufacturing capabilities and expanding therapeutic offerings. This investment will contribute to the development of human induced pluripotent stem cells (iPSCs) and their derivatives, as well as contract manufacturing of biologics and other therapies.
- Proliferation assays and non-viral delivery methods are also gaining traction, enabling the production of high-quality cells for therapeutic applications. The focus on overcoming cellular senescence is another significant area of research, as it holds the potential to improve the efficacy and safety of cell therapies. Overall, these developments underscore the market's potential for significant growth and innovation.
What are the market trends shaping the Cell Therapy Technologies Industry?
- Mergers and acquisitions have emerged as a significant market trend. This business strategy involves the combining of two or more companies to enhance their competitive position and achieve strategic goals.
- The market has experienced notable merger and acquisition activity, signaling a strategic consolidation among industry players to enhance technological capabilities and broaden market reach. Recent transactions underscore the sector's dynamic nature, with companies making strategic moves to strengthen their positions. For instance, in February 2024, the University of Texas MD Anderson Cancer Center acquired Bellicum Pharmaceuticals' CaspaCIDe switch and GoCAR platforms in the US. This acquisition enables MD Anderson to integrate these advanced technologies into its cell therapy programs, expanding its therapeutic offerings and research capabilities. Likewise, in June 2022, Galapagos NV, a Belgian biotech firm, entered the cell therapy sector by acquiring CellPoint and AboundBio.
- This strategic move expands Galapagos' portfolio with cell differentiation, cell purification methods, viral transduction, and gene therapy vectors, as well as apoptosis assays and cell viability assays. These acquisitions underscore the industry's continuous evolution and the commitment of key players to deliver innovative solutions in tissue engineering, targeted cell therapy, and gene therapy.
What challenges does the Cell Therapy Technologies Industry face during its growth?
- The escalating costs associated with cell therapy technologies pose a significant challenge and hinder the growth of the industry.
- The market is marked by intricate manufacturing processes and personalized treatments, leading to substantial costs that hinder market expansion. The complexity of producing cell therapies necessitates the use of specialized equipment and stringent quality control measures to ensure safety and efficacy. These processes are labor-intensive and incorporate advanced technologies, significantly increasing production expenses. Moreover, the personalized nature of these therapies adds to the cost, as each treatment is customized for individual patients. Clinical trial design and cell line development are crucial aspects of cell therapy production, requiring extensive resources and expertise. Cell culture media and cytotoxicity assays are essential components of the manufacturing process, further contributing to the overall costs.
- Cell banking methods, cell signaling pathways, and bioreactor technology are also integral to the production of cell therapies, adding to the complexity and cost. Despite these challenges, the potential benefits of cell therapies in personalized medicine make them a promising area of research and development.
Exclusive Customer Landscape
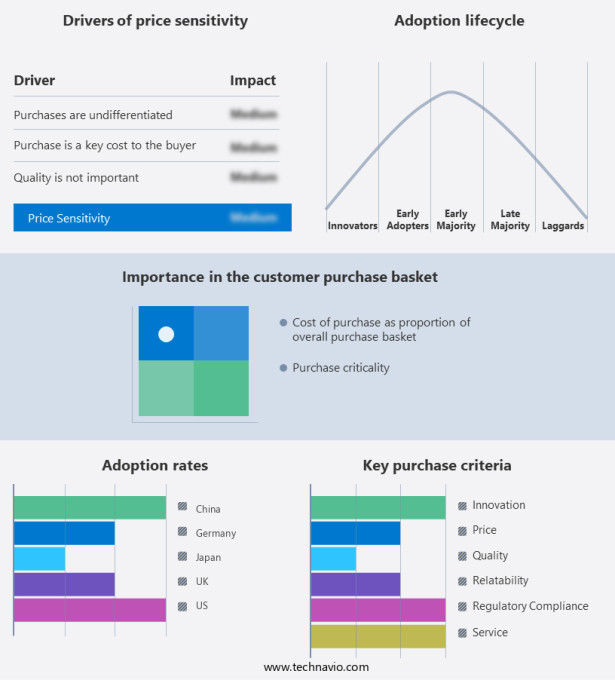
The cell therapy technologies market forecasting report includes the adoption lifecycle of the market, covering from the innovator's stage to the laggard's stage. It focuses on adoption rates in different regions based on penetration. Furthermore, the cell therapy technologies market report also includes key purchase criteria and drivers of price sensitivity to help companies evaluate and develop their market growth analysis strategies.
Customer Landscape
Key Companies & Market Insights
Companies are implementing various strategies, such as strategic alliances, cell therapy technologies market forecast, partnerships, mergers and acquisitions, geographical expansion, and product/service launches, to enhance their presence in the industry.
Avantor Inc. - This company specializes in providing cell therapy chemicals and reagents for various research applications, including biopharmaceutical, small molecule, fundamental, applied, and environmental testing.
The industry research and growth report includes detailed analyses of the competitive landscape of the market and information about key companies, including:
- Avantor Inc.
- Becton Dickinson and Co.
- Bio Techne Corp.
- Corning Inc.
- Danaher Corp.
- Fresenius Kabi AG
- FUJIFILM Irvine Scientific Inc.
- Korber Medipak Systems GmbH
- Lonza Group Ltd.
- Merck KGaA
- Miltenyi Biotec B.V. and Co. KG
- Revvity Inc.
- Sartorius AG
- STEMCELL Technologies Inc.
- TERUMO BCT, INC
- Thermo Fisher Scientific Inc.
Qualitative and quantitative analysis of companies has been conducted to help clients understand the wider business environment as well as the strengths and weaknesses of key industry players. Data is qualitatively analyzed to categorize companies as pure play, category-focused, industry-focused, and diversified; it is quantitatively analyzed to categorize companies as dominant, leading, strong, tentative, and weak.
Recent Development and News in Cell Therapy Technologies Market
- In January 2024, Merck KGaA, a leading pharma and life sciences company, announced the launch of its new allogeneic cell therapy, MELANIA, for the treatment of metastatic cutaneous melanoma. This marks a significant step forward in the cell therapy market, as allogeneic therapies offer the potential for off-the-shelf treatments, reducing the need for personalized manufacturing (Merck KGaA press release, 2024).
- In March 2024, Gilead Sciences and Kite Pharma, a Gilead company, entered into a strategic collaboration to develop and commercialize next-generation cell therapies. This partnership combines Gilead's expertise in oncology with Kite's cell therapy technology, aiming to expand their respective portfolios and strengthen their presence in the cell therapy market (Gilead Sciences press release, 2024).
- In May 2024, Moderna Therapeutics, a biotech pioneer in messenger RNA technology, raised USD1.8 billion in a public offering. The proceeds will be used to support the development and commercialization of their cell therapy pipeline, including mRNA-based therapies for solid tumors (Moderna Therapeutics press release, 2024).
- In February 2025, the European Medicines Agency granted a conditional marketing authorization to Novartis for CAR-T cell therapy, Kymriah, for the treatment of relapsed or refractory B-cell precursor acute lymphoblastic leukemia. This approval marks the first CAR-T cell therapy to receive marketing authorization in Europe, expanding the market reach for this innovative therapy (Novartis press release, 2025).
Research Analyst Overview
- The market is experiencing significant advancements in areas such as cell cycle regulation and process optimization. For instance, researchers are exploring new methods to enhance the efficiency of mesenchymal stem cell (MSC) production, a key player in regenerative medicine. Biomarker discovery is another critical area of focus, as identifying specific markers can improve cell quality control and therapeutic efficacy. Adverse event monitoring and bioprocessing validation are essential for ensuring safety and consistency in cell therapy manufacturing. In vitro studies and in vivo models are utilized extensively for preclinical development, with clinical translation requiring rigorous regulatory approvals.
- Cost effectiveness and scalability challenges are ongoing concerns, as the market shifts towards the use of immune cell subsets, combination therapies, and oncolytic viruses. Cell-based assays and longitudinal monitoring play a crucial role in treatment response evaluation, while ethical considerations and drug interaction studies are essential for addressing potential risks. Patient stratification is another key trend, as personalized medicine gains traction in the cell therapy landscape. By addressing these challenges and trends, the cell therapy market is poised for continued growth and innovation.
Dive into Technavio's robust research methodology, blending expert interviews, extensive data synthesis, and validated models for unparalleled Cell Therapy Technologies Market insights. See full methodology.
|
Market Scope |
|
|
Report Coverage |
Details |
|
Page number |
209 |
|
Base year |
2023 |
|
Historic period |
2018-2022 |
|
Forecast period |
2024-2028 |
|
Growth momentum & CAGR |
Accelerate at a CAGR of 19.7% |
|
Market growth 2024-2028 |
USD 5920.4 million |
|
Market structure |
Concentrated |
|
YoY growth 2023-2024(%) |
17.2 |
|
Key countries |
US, China, Germany, UK, and Japan |
|
Competitive landscape |
Leading Companies, Market Positioning of Companies, Competitive Strategies, and Industry Risks |
What are the Key Data Covered in this Cell Therapy Technologies Market Research and Growth Report?
- CAGR of the Cell Therapy Technologies industry during the forecast period
- Detailed information on factors that will drive the growth and forecasting between 2024 and 2028
- Precise estimation of the size of the market and its contribution of the industry in focus to the parent market
- Accurate predictions about upcoming growth and trends and changes in consumer behaviour
- Growth of the market across North America, Europe, Asia, and Rest of World (ROW)
- Thorough analysis of the market's competitive landscape and detailed information about companies
- Comprehensive analysis of factors that will challenge the cell therapy technologies market growth of industry companies
We can help! Our analysts can customize this cell therapy technologies market research report to meet your requirements.