Central Fill Pharmacy Automation Market Analysis North America, Europe, APAC, South America, Middle East and Africa - US, Germany, UK, France, China - Size and Forecast 2024-2028

Central Fill Pharmacy Automation Market Analysis North America, Europe, APAC, South America, Middle East and Africa - US, Germany, UK, France, China - Size and Forecast 2024-2028

Published: Jul 2024 156 Pages SKU: IRTNTR74964

Market Overview at a Glance

$623.6 Mn
Market Opportunity
13.63%
CAGR
11.72
YoY growth 2023-2024(%)

Central Fill Pharmacy Automation Market Size 2024-2028

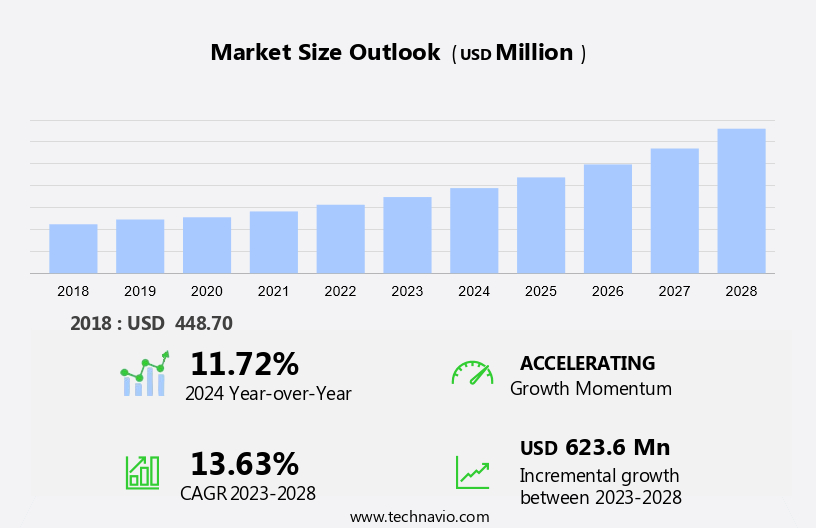
The central fill pharmacy automation market size is forecast to increase by USD 623.6 million at a CAGR of 13.63% between 2023 and 2028.

  • The market In the healthcare sector is witnessing significant growth due to several key factors. The increasing adoption of automation solutions in healthcare is a major trend driving market growth. Automation solutions, such as robotics and automation systems, are increasingly being used for packaging and storing pharmaceutical products in central fill pharmacies. This not only improves efficiency but also reduces the risk of medication errors. Another factor fueling market growth is the outsourcing of pharmacy services to central fill facilities. These systems enable pharmacies to streamline their operations, reduce costs, and improve patient safety. Moreover, stringent government regulations for approval of pharmacy automation systems ensure the highest standards of safety and quality in medication dispensing.
  • Home healthcare is another growing area for central fill pharmacy automation. With the increasing trend of home healthcare, there is a growing need for automated solutions to manage medication storage and dispensing. These systems provide an efficient and cost-effective solution for home healthcare providers to manage their medication inventory and ensure timely and accurate medication delivery to patients. Pharmaceutical equipment and professional services providers play a crucial role In the implementation and maintenance of these systems.

What will be the Size of the Central Fill Pharmacy Automation Market During the Forecast Period?

Central Fill Pharmacy Automation Market Size

 Request Free Sample

  • The market encompasses the production and implementation of automated systems for medication preparation and prescription filling in healthcare facilities. This market is driven by several factors, including the growing patient pool and the increasing demand for patient safety and accuracy in pharmacy workflows. Automated tabletop systems and tension packaging solutions enable hospitals and pharmacies to streamline their operations and improve patient outcomes. The prevalence of chronic diseases and the centralization of prescription management have further fueled market growth. Pharmacists and skilled professionals are increasingly relying on automated dispensing systems to meet the rising pharmaceutical spending and comply with regulatory requirements.
  • The market is characterized by a focus on electronic prescriptions and legally binding orders, as well as the integration of pharmacy management systems. Despite the benefits, challenges such as compliance with healthcare infrastructure and potential anti-dumping duties remain. Overall, the market is poised for continued expansion as healthcare organizations seek to enhance patient safety, improve medication accuracy, and optimize pharmacy workflows.

How is this Central Fill Pharmacy Automation Industry segmented and which is the largest segment?

The industry research report provides comprehensive data (region-wise segment analysis), with forecasts and estimates in "USD million" for the period 2024-2028, as well as historical data from 2018-2022 for the following segments.

  • Application
    • Inpatient pharmacy
    • Outpatient pharmacy
    • Retail pharmacy
  • Type
    • Equipment
    • Services
  • Geography
    • North America
      • US
    • Europe
      • Germany
      • UK
      • France
    • APAC
      • China
    • South America
    • Middle East and Africa

By Application Insights

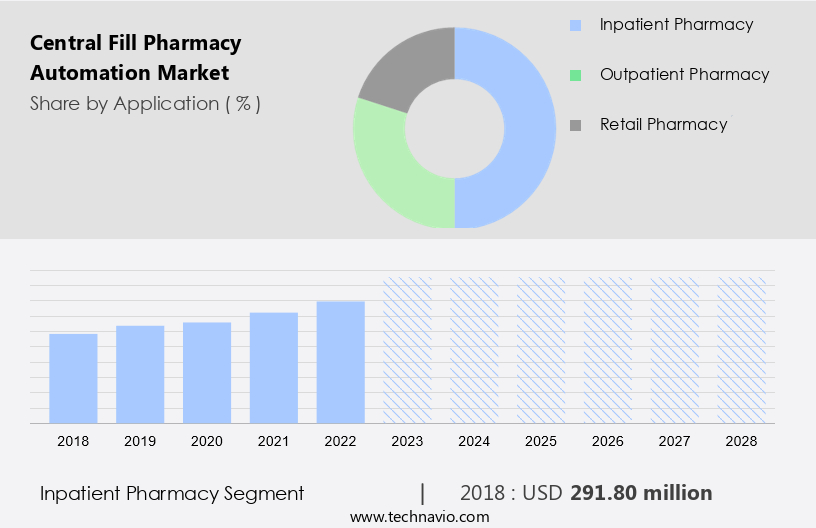
  • The inpatient pharmacy segment is estimated to witness significant growth during the forecast period. The market is experiencing significant growth due to the increasing patient pool and the rising prevalence of chronic diseases requiring specialized medication. Pharmacists play a crucial role in inpatient care, improving patient outcomes through medication management, patient interviews, and counseling. Central fill pharmacy automation enhances pharmacist productivity and patient safety by reducing medication errors and streamlining pharmacy workflows. Technological advancements, such as automated dispensing and tension packaging, are essential to this market's growth.
  • Hospitals and specialty pharmacies are major adopters of central fill pharmacy automation, particularly for compounding, controlled substance handling, and specialty drug dispensing. The market's attractiveness is further boosted by the increasing healthcare spending, healthcare infrastructure development, and compliance regulations. Initial investments in automation equipment and skilled professionals are necessary for successful implementation. The market is expected to continue growing, driven by the increasing burden on pharmacies and the need for accurate prescription filling and centralized prescription management.

Central Fill Pharmacy Automation Market Size

Get a glance at the market report of share of various segments Request Free Sample

The Inpatient pharmacy segment was valued at USD 291.80 million in 2018 and showed a gradual increase during the forecast period.

Regional Analysis

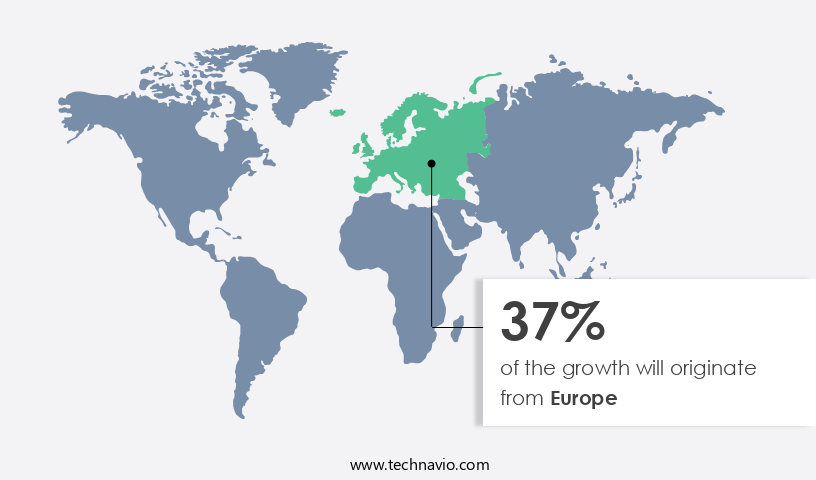
  • Europe is estimated to contribute 37% to the growth of the global market during the forecast period. Technavio's analysts have elaborately explained the regional trends and drivers that shape the market during the forecast period. Central fill pharmacy automation is a critical trend In the pharmaceutical industry, particularly in North America, which accounts for the largest market share. The US dominates this region due to its advanced healthcare infrastructure, comprising numerous hospitals and retail pharmacies. Central fill pharmacy automation is increasingly adopted to minimize medication errors, manage high prescription volumes, and cater to the needs of geriatric and obese patients.

Central Fill Pharmacy Automation Market Share by Geography

For more insights on the market size of various regions, Request Free Sample

The growing prevalence of chronic diseases, such as diabetes and cardiovascular conditions, necessitates the use of specialized medication and compounding, further driving demand for central fill pharmacy automation. Automated tabletop systems, prescription filling, and tension packaging are essential components of this market. Pharmacists benefit from improved accuracy, streamlined workflows, and enhanced patient outcomes. Centralized prescription systems and automated dispensing are key features that contribute to the market's growth. Market players offer automated packaging and pharmaceutical equipment to meet the evolving needs of multispecialty hospitals, specialty medicine, and specialty drugs. The market is expected to continue growing due to increasing healthcare spending, pharmacy management, and the need for skilled professionals. Initial investments in automation technology can be substantial, but the long-term benefits in terms of compliance, process modeling, and market attractiveness make it a strategic position for pharmacies.

Market Dynamics

Our researchers analyzed the data with 2023 as the base year, along with the key drivers, trends, and challenges. A holistic analysis of drivers will help companies refine their marketing strategies to gain a competitive advantage.

What are the key market drivers leading to the rise In the adoption of Central Fill Pharmacy Automation Industry?

  • The rise in medication errors is the key driver of the market. Central fill pharmacy automation is a crucial solution for addressing the challenges posed by the increasing patient pool, particularly those requiring multiple medications. According to the Centers for Disease Control and Prevention (CDC), over half of Americans take multiple prescriptions daily, increasing the risk of medication errors. These errors can lead to significant health complications, resulting in emergency hospital visits and increased healthcare spending. Annually, hospitals incur an average cost of USD 60,000-USD 65,000 due to medication errors, amounting to a total expenditure of USD 3-6 billion. Central fill pharmacy automation, including automated tabletop systems and dispensing cabinets, plays a vital role in improving patient safety and staff productivity.
  • Automated medication handling, such as tension packaging and compounding, is essential for managing complex patient profiles, especially for geriatric and obese patients. Technological development in pharmacy automation, including automated dispensing and packaging, has significantly reduced the prevalence of medication errors. Central fill pharmacy automation also supports the dispensing of controlled substances, specialty drugs, and compounding, ensuring regulatory compliance and accurate filling. This pharmacy model is increasingly attractive for multispecialty hospitals and specialty pharmacies due to its ability to improve pharmacy workflow, patient outcomes, and survival and quality of care for patients with chronic diseases. Initial investments in pharmacy automation may be high, but the long-term benefits, including increased process modeling, market attractiveness, and strategic positioning, far outweigh the costs.

What are the market trends shaping the Central Fill Pharmacy Automation Industry?

  • Increasing adoption of automation in healthcare is the upcoming market trend. Central fill pharmacy automation is a significant trend In the healthcare sector, driven by the increasing adoption of technology to enhance patient safety and pharmacist productivity. Automated tabletop systems and medication dispensing solutions are transforming prescription filling processes, particularly in hospitals and multispecialty healthcare facilities. Automation reduces the burden on pharmacies by minimizing medication errors, improving accuracy of filling, and streamlining pharmacy workflows. Patient safety is a primary concern, especially for geriatric and obese patients, making automation an essential investment for healthcare providers. Automated dispensing systems also support the handling of controlled substances, specialty drugs, and compounding, which are prevalent in specialty pharmacies and outsourcing pharmacies.
  • Technological development in automated packaging and pharmaceutical equipment further enhances the capabilities of central fill pharmacy automation. This shift towards automation contributes to data-driven insights, optimizing pharmacy performance and improving patient outcomes. Automation also supports compliance with regulations and initial investments in automation can lead to long-term savings and strategic positioning In the market.

What challenges does the Central Fill Pharmacy Automation Industry face during its growth?

  • Stringent government regulations for approval of pharmacy automation systems is a key challenge affecting the industry growth. Central fill pharmacy automation refers to the use of automated tabletop systems for prescription filling in a centralized location, serving a large patient pool. Pharmacists at hospitals and other healthcare facilities employ these systems to enhance patient safety and staff productivity. Automation solution providers offer automated dispensing cabinets and tension packaging solutions to streamline medication handling. The prevalence of chronic diseases and the increasing population necessitate the adoption of pharmacy automation. Central fill pharmacy systems enable the handling of controlled substances and specialty drug dispensing with greater accuracy, reducing medication errors. The automation of pharmacy workflow leads to improved patient outcomes and centralized prescription management.
  • Specialty medicine and specialty pharmacies are significant contributors to pharmaceutical spending. Automated packaging and pharmaceutical equipment are essential components of these pharmacy models, ensuring compliance with regulations and enhancing process modeling. Initial investments in pharmacy automation can be substantial but yield long-term benefits, including increased efficiency, skilled professionals, and market attractiveness. The technological development of pharmacy automation systems caters to the needs of geriatric and obese patients, addressing the burden on pharmacies. The automation of compounding and outsourcing pharmacies further expands the application areas of pharmacy automation. Despite the initial investments, the benefits of pharmacy automation, such as accuracy of filling, patient safety, and pharmacy management, make it a strategic positioning for healthcare infrastructure and pharmaceutical spending.

Exclusive Customer Landscape

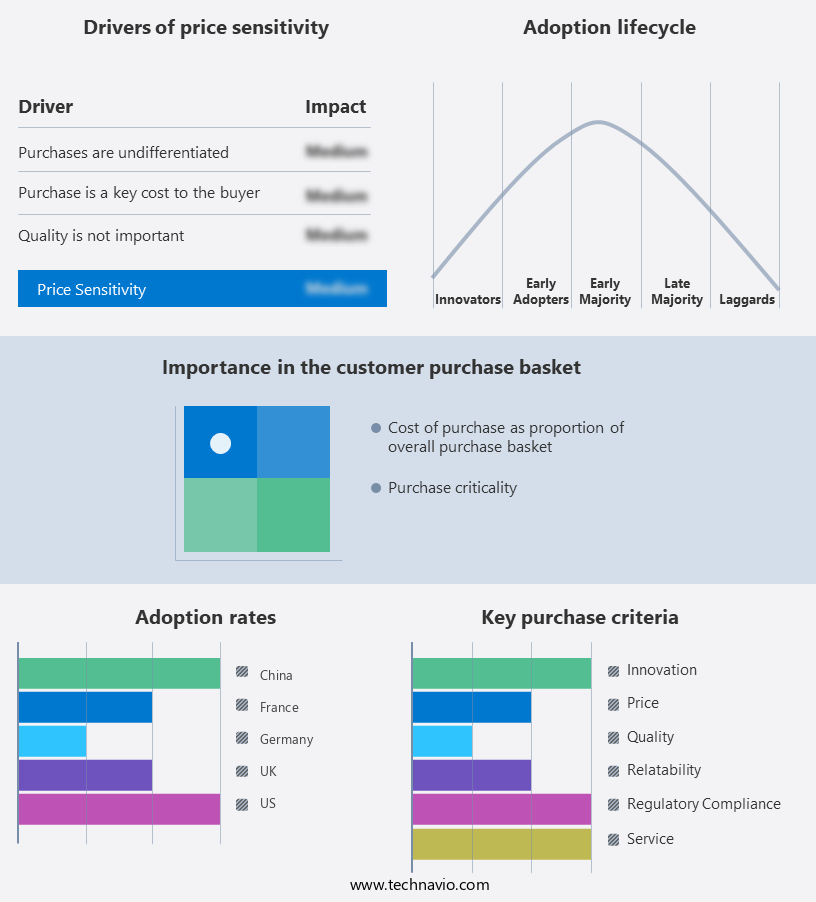
The market forecasting report includes the adoption lifecycle of the market, covering from the innovator's stage to the laggard's stage. It focuses on adoption rates in different regions based on penetration. Furthermore, the market report also includes key purchase criteria and drivers of price sensitivity to help companies evaluate and develop their market growth analysis strategies.

Central Fill Pharmacy Automation Market Share by Geography

 Customer Landscape

Key Companies & Market Insights

Companies are implementing various strategies, such as strategic alliances, market forecast, partnerships, mergers and acquisitions, geographical expansion, and product/service launches, to enhance their presence In the industry.

The industry research and growth report includes detailed analyses of the competitive landscape of the market and information about key companies, including:

  • Agilent Technologies Inc.
  • ARxIUM Inc.
  • Becton Dickinson and Co.
  • Capsa Healthcare LLC
  • Cornerstone Automation Systems LLC
  • FORMULATRIX Inc.
  • Gebr. Willach GmbH
  • Innovation Associates
  • KUKA AG
  • LABEL ELETTRONICA S.R.L.
  • McKesson Corp.
  • Noritsu America Corp.
  • Omnicell Inc.
  • Oracle Corp.
  • Quality Manufacturing Systems Inc.
  • Rxsafe LLC
  • ScriptPro LLC
  • Sensum d.o.o.
  • Tension Corp.
  • Yuyama USA Inc.

Qualitative and quantitative analysis of companies has been conducted to help clients understand the wider business environment as well as the strengths and weaknesses of key industry players. Data is qualitatively analyzed to categorize companies as pure play, category-focused, industry-focused, and diversified; it is quantitatively analyzed to categorize companies as dominant, leading, strong, tentative, and weak.

Research Analyst Overview

Central fill pharmacy automation refers to the implementation of technology and automated systems in pharmacies to streamline prescription filling processes. This approach allows for the centralized preparation and dispensing of medications, reducing manual labor and increasing efficiency. The growing patient pool and the prevalence of chronic diseases have placed significant tension on pharmacies, leading to a heightened focus on automation. The market is expanding as healthcare services increasingly adopt automated solutions to streamline medication dispensing, particularly for specialty pharmaceuticals that require precise handling and distribution. Pharmacists play a crucial role in this landscape, as they are responsible for ensuring patient safety and optimal medication outcomes. Central fill pharmacy automation offers several benefits, including improved patient safety, enhanced staff productivity, and increased accuracy of filling.

Moreover, the pharmaceutical industry has witnessed substantial technological development in recent years, with automation becoming a key trend. Central fill pharmacy automation encompasses various aspects, including automated dispensing, controlled substance management, and compounding. This automation not only benefits retail pharmacies but also outsources pharmacies and specialty pharmacies. The increasing burden on pharmacies due to the prevalence of chronic diseases and the rising healthcare spending has necessitated the adoption of central fill pharmacy automation. Specialty drugs and specialty medicine, which are often used to treat complex conditions, require specialized handling and packaging. Automated packaging solutions have emerged as a viable option to address these needs.

Furthermore, the pharmaceutical industry is subject to various regulations and compliance requirements, which can be challenging for pharmacies. Central fill pharmacy automation can help pharmacies navigate these complexities, ensuring legally binding processes and reducing the risk of medication errors. The market is characterized by its attractiveness to multispecialty hospitals and healthcare infrastructure, which often deal with a large volume of prescriptions. The use of electronic prescriptions and the centralized prescription filling process can lead to significant improvements in pharmacy workflow and patient outcomes. The pharmaceutical spending and healthcare infrastructure continue to evolve, with a growing emphasis on specialty medicine and generic medicines.

Market Scope

Report Coverage

Details

Page number

156

Base year

2023

Historic period

2018-2022

Forecast period

2024-2028

Growth momentum & CAGR

Accelerate at a CAGR of 13.63%

Market growth 2024-2028

USD 623.6 million

Market structure

Fragmented

YoY growth 2023-2024(%)

11.72

Key countries

US, Germany, UK, France, and China

Competitive landscape

Leading Companies, Market Positioning of Companies, Competitive Strategies, and Industry Risks

Request Free Sample

What are the Key Data Covered in this Market Research and Growth Report?

  • CAGR of the industry during the forecast period
  • Detailed information on factors that will drive the market growth and forecasting between 2024 and 2028
  • Precise estimation of the size of the market and its contribution of the industry in focus to the parent market
  • Accurate predictions about upcoming growth and trends and changes in consumer behaviour
  • Growth of the market across North America, Europe, APAC, South America, and Middle East and Africa
  • Thorough analysis of the market's competitive landscape and detailed information about companies
  • Comprehensive analysis of factors that will challenge the market growth of industry companies

We can help! Our analysts can customize this market research report to meet your requirements.

Get in touch

1 Executive Summary

  • 1.1 Market overview
    • Executive Summary - Chart on Market Overview
    • Executive Summary - Data Table on Market Overview
    • Executive Summary - Chart on Global Market Characteristics
    • Executive Summary - Chart on Market by Geography
    • Executive Summary - Chart on Market Segmentation by Application
    • Executive Summary - Chart on Market Segmentation by Type
    • Executive Summary - Chart on Incremental Growth
    • Executive Summary - Data Table on Incremental Growth
    • Executive Summary - Chart on Company Market Positioning

2 Market Landscape

  • 2.1 Market ecosystem
    • Parent Market
    • Data Table on - Parent Market
  • 2.2 Market characteristics
    • Market characteristics analysis
  • 2.3 Value chain analysis
    • Value Chain Analysis

3 Market Sizing

  • 3.1 Market definition
    • Offerings of companies included in the market definition
  • 3.2 Market segment analysis
    • Market segments
  • 3.3 Market size 2023
    • 3.4 Market outlook: Forecast for 2023-2028
      • Chart on Global - Market size and forecast 2023-2028 ($ million)
      • Data Table on Global - Market size and forecast 2023-2028 ($ million)
      • Chart on Global Market: Year-over-year growth 2023-2028 (%)
      • Data Table on Global Market: Year-over-year growth 2023-2028 (%)

    4 Historic Market Size

    • 4.1 Global Central Fill Pharmacy Automation Market 2018 - 2022
      • Historic Market Size - Data Table on Global Central Fill Pharmacy Automation Market 2018 - 2022 ($ million)
    • 4.2 Application segment analysis 2018 - 2022
      • Historic Market Size - Application Segment 2018 - 2022 ($ million)
    • 4.3 Type segment analysis 2018 - 2022
      • Historic Market Size - Type Segment 2018 - 2022 ($ million)
    • 4.4 Geography segment analysis 2018 - 2022
      • Historic Market Size - Geography Segment 2018 - 2022 ($ million)
    • 4.5 Country segment analysis 2018 - 2022
      • Historic Market Size - Country Segment 2018 - 2022 ($ million)

    5 Five Forces Analysis

    • 5.1 Five forces summary
      • Five forces analysis - Comparison between 2023 and 2028
    • 5.2 Bargaining power of buyers
      • Bargaining power of buyers - Impact of key factors 2023 and 2028
    • 5.3 Bargaining power of suppliers
      • Bargaining power of suppliers - Impact of key factors in 2023 and 2028
    • 5.4 Threat of new entrants
      • Threat of new entrants - Impact of key factors in 2023 and 2028
    • 5.5 Threat of substitutes
      • Threat of substitutes - Impact of key factors in 2023 and 2028
    • 5.6 Threat of rivalry
      • Threat of rivalry - Impact of key factors in 2023 and 2028
    • 5.7 Market condition
      • Chart on Market condition - Five forces 2023 and 2028

    6 Market Segmentation by Application

    • 6.1 Market segments
      • Chart on Application - Market share 2023-2028 (%)
      • Data Table on Application - Market share 2023-2028 (%)
    • 6.2 Comparison by Application
      • Chart on Comparison by Application
      • Data Table on Comparison by Application
    • 6.3 Inpatient pharmacy - Market size and forecast 2023-2028
      • Chart on Inpatient pharmacy - Market size and forecast 2023-2028 ($ million)
      • Data Table on Inpatient pharmacy - Market size and forecast 2023-2028 ($ million)
      • Chart on Inpatient pharmacy - Year-over-year growth 2023-2028 (%)
      • Data Table on Inpatient pharmacy - Year-over-year growth 2023-2028 (%)
    • 6.4 Outpatient pharmacy - Market size and forecast 2023-2028
      • Chart on Outpatient pharmacy - Market size and forecast 2023-2028 ($ million)
      • Data Table on Outpatient pharmacy - Market size and forecast 2023-2028 ($ million)
      • Chart on Outpatient pharmacy - Year-over-year growth 2023-2028 (%)
      • Data Table on Outpatient pharmacy - Year-over-year growth 2023-2028 (%)
    • 6.5 Retail pharmacy - Market size and forecast 2023-2028
      • Chart on Retail pharmacy - Market size and forecast 2023-2028 ($ million)
      • Data Table on Retail pharmacy - Market size and forecast 2023-2028 ($ million)
      • Chart on Retail pharmacy - Year-over-year growth 2023-2028 (%)
      • Data Table on Retail pharmacy - Year-over-year growth 2023-2028 (%)
    • 6.6 Market opportunity by Application
      • Market opportunity by Application ($ million)
      • Data Table on Market opportunity by Application ($ million)

    7 Market Segmentation by Type

    • 7.1 Market segments
      • Chart on Type - Market share 2023-2028 (%)
      • Data Table on Type - Market share 2023-2028 (%)
    • 7.2 Comparison by Type
      • Chart on Comparison by Type
      • Data Table on Comparison by Type
    • 7.3 Equipment - Market size and forecast 2023-2028
      • Chart on Equipment - Market size and forecast 2023-2028 ($ million)
      • Data Table on Equipment - Market size and forecast 2023-2028 ($ million)
      • Chart on Equipment - Year-over-year growth 2023-2028 (%)
      • Data Table on Equipment - Year-over-year growth 2023-2028 (%)
    • 7.4 Services - Market size and forecast 2023-2028
      • Chart on Services - Market size and forecast 2023-2028 ($ million)
      • Data Table on Services - Market size and forecast 2023-2028 ($ million)
      • Chart on Services - Year-over-year growth 2023-2028 (%)
      • Data Table on Services - Year-over-year growth 2023-2028 (%)
    • 7.5 Market opportunity by Type
      • Market opportunity by Type ($ million)
      • Data Table on Market opportunity by Type ($ million)

    8 Customer Landscape

    • 8.1 Customer landscape overview
      • Analysis of price sensitivity, lifecycle, customer purchase basket, adoption rates, and purchase criteria

    9 Geographic Landscape

    • 9.1 Geographic segmentation
      • Chart on Market share by geography 2023-2028 (%)
      • Data Table on Market share by geography 2023-2028 (%)
    • 9.2 Geographic comparison
      • Chart on Geographic comparison
      • Data Table on Geographic comparison
    • 9.3 North America - Market size and forecast 2023-2028
      • Chart on North America - Market size and forecast 2023-2028 ($ million)
      • Data Table on North America - Market size and forecast 2023-2028 ($ million)
      • Chart on North America - Year-over-year growth 2023-2028 (%)
      • Data Table on North America - Year-over-year growth 2023-2028 (%)
    • 9.4 Europe - Market size and forecast 2023-2028
      • Chart on Europe - Market size and forecast 2023-2028 ($ million)
      • Data Table on Europe - Market size and forecast 2023-2028 ($ million)
      • Chart on Europe - Year-over-year growth 2023-2028 (%)
      • Data Table on Europe - Year-over-year growth 2023-2028 (%)
    • 9.5 APAC - Market size and forecast 2023-2028
      • Chart on APAC - Market size and forecast 2023-2028 ($ million)
      • Data Table on APAC - Market size and forecast 2023-2028 ($ million)
      • Chart on APAC - Year-over-year growth 2023-2028 (%)
      • Data Table on APAC - Year-over-year growth 2023-2028 (%)
    • 9.6 South America - Market size and forecast 2023-2028
      • Chart on South America - Market size and forecast 2023-2028 ($ million)
      • Data Table on South America - Market size and forecast 2023-2028 ($ million)
      • Chart on South America - Year-over-year growth 2023-2028 (%)
      • Data Table on South America - Year-over-year growth 2023-2028 (%)
    • 9.7 Middle East and Africa - Market size and forecast 2023-2028
      • Chart on Middle East and Africa - Market size and forecast 2023-2028 ($ million)
      • Data Table on Middle East and Africa - Market size and forecast 2023-2028 ($ million)
      • Chart on Middle East and Africa - Year-over-year growth 2023-2028 (%)
      • Data Table on Middle East and Africa - Year-over-year growth 2023-2028 (%)
    • 9.8 US - Market size and forecast 2023-2028
      • Chart on US - Market size and forecast 2023-2028 ($ million)
      • Data Table on US - Market size and forecast 2023-2028 ($ million)
      • Chart on US - Year-over-year growth 2023-2028 (%)
      • Data Table on US - Year-over-year growth 2023-2028 (%)
    • 9.9 Germany - Market size and forecast 2023-2028
      • Chart on Germany - Market size and forecast 2023-2028 ($ million)
      • Data Table on Germany - Market size and forecast 2023-2028 ($ million)
      • Chart on Germany - Year-over-year growth 2023-2028 (%)
      • Data Table on Germany - Year-over-year growth 2023-2028 (%)
    • 9.10 UK - Market size and forecast 2023-2028
      • Chart on UK - Market size and forecast 2023-2028 ($ million)
      • Data Table on UK - Market size and forecast 2023-2028 ($ million)
      • Chart on UK - Year-over-year growth 2023-2028 (%)
      • Data Table on UK - Year-over-year growth 2023-2028 (%)
    • 9.11 France - Market size and forecast 2023-2028
      • Chart on France - Market size and forecast 2023-2028 ($ million)
      • Data Table on France - Market size and forecast 2023-2028 ($ million)
      • Chart on France - Year-over-year growth 2023-2028 (%)
      • Data Table on France - Year-over-year growth 2023-2028 (%)
    • 9.12 China - Market size and forecast 2023-2028
      • Chart on China - Market size and forecast 2023-2028 ($ million)
      • Data Table on China - Market size and forecast 2023-2028 ($ million)
      • Chart on China - Year-over-year growth 2023-2028 (%)
      • Data Table on China - Year-over-year growth 2023-2028 (%)
    • 9.13 Market opportunity by geography
      • Market opportunity by geography ($ million)
      • Data Tables on Market opportunity by geography ($ million)

    10 Drivers, Challenges, and Opportunity/Restraints

    • 10.1 Market drivers
      • 10.2 Market challenges
        • 10.3 Impact of drivers and challenges
          • Impact of drivers and challenges in 2023 and 2028
        • 10.4 Market opportunities/restraints

          11 Competitive Landscape

          • 11.1 Overview
            • 11.2 Competitive Landscape
              • Overview on criticality of inputs and factors of differentiation
            • 11.3 Landscape disruption
              • Overview on factors of disruption
            • 11.4 Industry risks
              • Impact of key risks on business

            12 Competitive Analysis

            • 12.1 Companies profiled
              • Companies covered
            • 12.2 Market positioning of companies
              • Matrix on companies position and classification
            • 12.3 ARxIUM Inc.
              • ARxIUM Inc. - Overview
              • ARxIUM Inc. - Product / Service
              • ARxIUM Inc. - Key offerings
            • 12.4 Becton Dickinson and Co.
              • Becton Dickinson and Co. - Overview
              • Becton Dickinson and Co. - Business segments
              • Becton Dickinson and Co. - Key news
              • Becton Dickinson and Co. - Key offerings
              • Becton Dickinson and Co. - Segment focus
            • 12.5 Capsa Healthcare LLC
              • Capsa Healthcare LLC - Overview
              • Capsa Healthcare LLC - Product / Service
              • Capsa Healthcare LLC - Key offerings
            • 12.6 Cornerstone Automation Systems LLC
              • Cornerstone Automation Systems LLC - Overview
              • Cornerstone Automation Systems LLC - Product / Service
              • Cornerstone Automation Systems LLC - Key offerings
            • 12.7 Gebr. Willach GmbH
              • Gebr. Willach GmbH - Overview
              • Gebr. Willach GmbH - Product / Service
              • Gebr. Willach GmbH - Key offerings
            • 12.8 KUKA AG
              • KUKA AG - Overview
              • KUKA AG - Business segments
              • KUKA AG - Key offerings
              • KUKA AG - Segment focus
            • 12.9 McKesson Corp.
              • McKesson Corp. - Overview
              • McKesson Corp. - Business segments
              • McKesson Corp. - Key news
              • McKesson Corp. - Key offerings
              • McKesson Corp. - Segment focus
            • 12.10 Noritsu America Corp.
              • Noritsu America Corp. - Overview
              • Noritsu America Corp. - Product / Service
              • Noritsu America Corp. - Key offerings
            • 12.11 Omnicell Inc.
              • Omnicell Inc. - Overview
              • Omnicell Inc. - Product / Service
              • Omnicell Inc. - Key news
              • Omnicell Inc. - Key offerings
            • 12.12 Oracle Corp.
              • Oracle Corp. - Overview
              • Oracle Corp. - Business segments
              • Oracle Corp. - Key news
              • Oracle Corp. - Key offerings
              • Oracle Corp. - Segment focus
            • 12.13 Quality Manufacturing Systems Inc.
              • Quality Manufacturing Systems Inc. - Overview
              • Quality Manufacturing Systems Inc. - Product / Service
              • Quality Manufacturing Systems Inc. - Key offerings
            • 12.14 Rxsafe LLC
              • Rxsafe LLC - Overview
              • Rxsafe LLC - Product / Service
              • Rxsafe LLC - Key offerings
            • 12.15 ScriptPro LLC
              • ScriptPro LLC - Overview
              • ScriptPro LLC - Product / Service
              • ScriptPro LLC - Key offerings
            • 12.16 Tension Corp.
              • Tension Corp. - Overview
              • Tension Corp. - Product / Service
              • Tension Corp. - Key offerings
            • 12.17 Yuyama USA Inc.
              • Yuyama USA Inc. - Overview
              • Yuyama USA Inc. - Product / Service
              • Yuyama USA Inc. - Key offerings

            13 Appendix

            • 13.1 Scope of the report
              • 13.2 Inclusions and exclusions checklist
                • Inclusions checklist
                • Exclusions checklist
              • 13.3 Currency conversion rates for US$
                • Currency conversion rates for US$
              • 13.4 Research methodology
                • Research methodology
              • 13.5 Data procurement
                • Information sources
              • 13.6 Data validation
                • Data validation
              • 13.7 Validation techniques employed for market sizing
                • Validation techniques employed for market sizing
              • 13.8 Data synthesis
                • Data synthesis
              • 13.9 360 degree market analysis
                • 360 degree market analysis
              • 13.10 List of abbreviations
                • List of abbreviations

              Research Methodology

              Technavio presents a detailed picture of the market by way of study, synthesis, and summation of data from multiple sources. The analysts have presented the various facets of the market with a particular focus on identifying the key industry influencers. The data thus presented is comprehensive, reliable, and the result of extensive research, both primary and secondary.

              INFORMATION SOURCES

              Primary sources

              • Manufacturers and suppliers
              • Channel partners
              • Industry experts
              • Strategic decision makers

              Secondary sources

              • Industry journals and periodicals
              • Government data
              • Financial reports of key industry players
              • Historical data
              • Press releases

              DATA ANALYSIS

              Data Synthesis

              • Collation of data
              • Estimation of key figures
              • Analysis of derived insights

              Data Validation

              • Triangulation with data models
              • Reference against proprietary databases
              • Corroboration with industry experts

              REPORT WRITING

              Qualitative

              • Market drivers
              • Market challenges
              • Market trends
              • Five forces analysis

              Quantitative

              • Market size and forecast
              • Market segmentation
              • Geographical insights
              • Competitive landscape

              Interested in this report?

              Get your sample now to see our research methodology and insights!

              Download Now

              Frequently Asked Questions

              Central Fill Pharmacy Automation market growth will increase by $ 623.6 mn during 2024-2028.

              The Central Fill Pharmacy Automation market is expected to grow at a CAGR of 13.63% during 2024-2028.

              Central Fill Pharmacy Automation market is segmented by Application( Inpatient pharmacy, Outpatient pharmacy, Retail pharmacy) Type( Equipment, Services)

              Agilent Technologies Inc., ARxIUM Inc., Becton Dickinson and Co., Capsa Healthcare LLC, Cornerstone Automation Systems LLC, FORMULATRIX Inc., Gebr. Willach GmbH, Innovation Associates, KUKA AG, LABEL ELETTRONICA S.R.L., McKesson Corp., Noritsu America Corp., Omnicell Inc., Oracle Corp., Quality Manufacturing Systems Inc., Rxsafe LLC, ScriptPro LLC, Sensum d.o.o., Tension Corp., Yuyama USA Inc. are a few of the key vendors in the Central Fill Pharmacy Automation market.

              Europe will register the highest growth rate of 37% among the other regions. Therefore, the Central Fill Pharmacy Automation market in Europe is expected to garner significant business opportunities for the vendors during the forecast period.

              US, Germany, UK, France, China

              • Rise in medication errorsGlobally is the driving factor this market.
              • there are many patients who take multiple medications daily. For instance is the driving factor this market.
              • according to the CDC is the driving factor this market.
              • the majority of Americans have at least one prescription is the driving factor this market.
              • with more than 50% taking multiple medications daily. Patients taking multiple medications bear a high risk of medication errors. Medication errors are a significant cause of health risks in patients is the driving factor this market.
              • especially in the US is the driving factor this market.
              • thereby adding to the country annual healthcare expenditure. Annually is the driving factor this market.
              • hospitals in the US spend an average of $60 is the driving factor this market.
              • 000-$65 is the driving factor this market.
              • 000 is the driving factor this market.
              • amounting to total healthcare costs ranging between $3 billion to $6 billion owing to medication errors. Medication errors can lead to instances such as a medication cocktail called polypharmacy is the driving factor this market.
              • which can lead to an emergency hospital visit and worsening of the disease. For instance is the driving factor this market.
              • ingesting acetaminophen is the driving factor this market.
              • the active ingredient in Tylenol is the driving factor this market.
              • in large doses is the driving factor this market.
              • even in different pill combinations is the driving factor this market.
              • causes liver damage. Thus is the driving factor this market.
              • medication errors can have serious health risks for patients. Vendors have developed products such as central fill pharmacy automation is the driving factor this market.
              • which help in reducing medication errors. Central fill pharmacy automation allows a patient to monitor the time of medication and the exact dose of medication ingested with features such as color coding is the driving factor this market.
              • braille for the blind is the driving factor this market.
              • and a locking mechanism to prevent double dosing. Medication dispensers aid people with impaired ability to monitor their medication. Some medication dispensers have sections for insulin and hypodermic syringes is the driving factor this market.
              • which are useful for diabetics. Thus is the driving factor this market.
              • central fill pharmacy automation aid in reducing medication errors is the driving factor this market.
              • which reduces the risk of injury or death and ensures patient safety. Such advantages provided by medication dispensing systems will drive the growth of the market during the forecast period. is the driving factor this market.

              The Central Fill Pharmacy Automation market vendors should focus on grabbing business opportunities from the Inpatient pharmacy segment as it accounted for the largest market share in the base year.