Chainsaw Market Analysis, Size, and Forecast 2026-2030: North America (US, Canada, and Mexico), Europe (Germany, France, and UK), APAC (China, Japan, and India), South America (Brazil and Argentina), Middle East and Africa (Turkey, South Africa, and Saudi Arabia), and Rest of World (ROW)

Chainsaw Market Analysis, Size, and Forecast 2026-2030:
North America (US, Canada, and Mexico), Europe (Germany, France, and UK), APAC (China, Japan, and India), South America (Brazil and Argentina), Middle East and Africa (Turkey, South Africa, and Saudi Arabia), and Rest of World (ROW)

Published: Mar 2026 279 Pages SKU: IRTNTR44746

Market Overview at a Glance

$1.06 B
Market Opportunity
5.2%
CAGR 2025 - 2030
40.6%
North America Growth
$2.19 B
Commercial segment 2024

Chainsaw Market Size 2026-2030

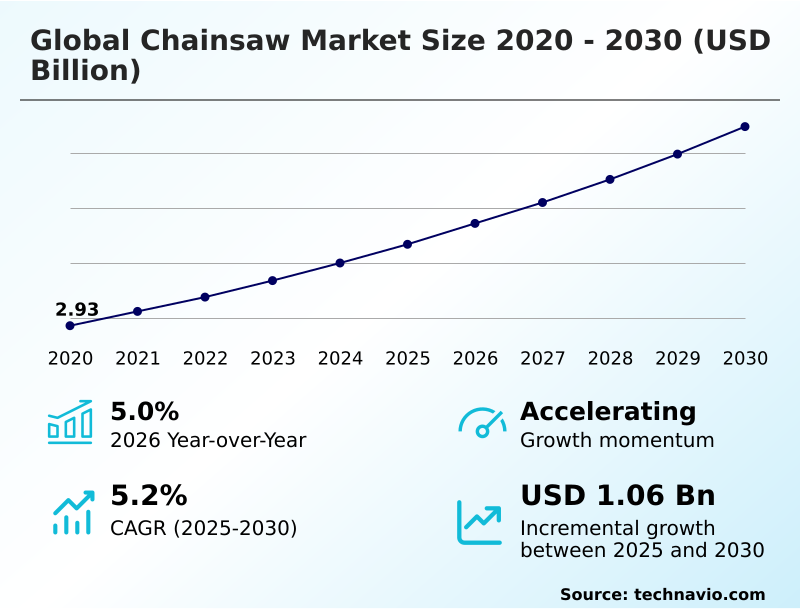
The chainsaw market size is valued to increase by USD 1.06 billion, at a CAGR of 5.2% from 2025 to 2030. Rising construction and infrastructure development will drive the chainsaw market.

Major Market Trends & Insights

  • North America dominated the market and accounted for a 40.6% growth during the forecast period.
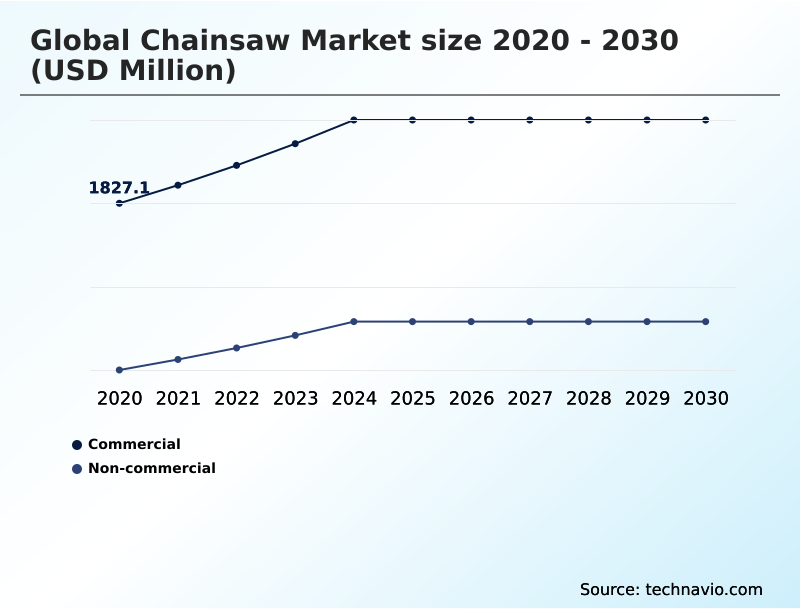
  • By End-user - Commercial segment was valued at USD 2.19 billion in 2024
  • By Product - Gas-powered segment accounted for the largest market revenue share in 2024

Market Size & Forecast

  • Market Opportunities: USD 1.80 billion
  • Market Future Opportunities: USD 1.06 billion
  • CAGR from 2025 to 2030 : 5.2%

Market Summary

  • The chainsaw market is undergoing a significant transformation, driven by the dual pressures of environmental regulation and demands for increased operational efficiency. The industry is pivoting from traditional gasoline engines to advanced electric-powered systems, including high-torque cordless chainsaw models equipped with high-capacity lithium-ion battery system technology.
  • This shift is particularly evident in residential and urban commercial applications, where lower noise and zero emissions are critical. Key trends include the integration of brushless motor technology for longer tool life and the development of sophisticated safety features like the automated chain brake and advanced kickback protection.
  • For professional users in forestry and construction, the focus remains on power and durability, with innovations in two-stroke engine design, such as stratified scavenging, improving fuel efficiency. A key business scenario involves a commercial landscaping firm leveraging digital connectivity in its fleet of cordless power tools.
  • By monitoring battery health, chain tension monitoring, and usage hours in real-time, fleet managers can optimize maintenance schedules, reducing equipment downtime by over 25% and maximizing crew productivity across multiple job sites, directly impacting profitability.

What will be the Size of the Chainsaw Market during the forecast period?

Get Key Insights on Market Forecast (PDF) Request Free Sample

How is the Chainsaw Market Segmented?

The chainsaw industry research report provides comprehensive data (region-wise segment analysis), with forecasts and estimates in "USD million" for the period 2026-2030, as well as historical data from 2020-2024 for the following segments.

  • End-user
    • Commercial
    • Non-commercial
  • Product
    • Gas-powered
    • Electric-powered
  • Distribution channel
    • Offline
    • Online
  • Geography
    • North America
      • US
      • Canada
      • Mexico
    • Europe
      • Germany
      • France
      • UK
    • APAC
      • China
      • Japan
      • India
    • South America
      • Brazil
      • Argentina
    • Middle East and Africa
      • Turkey
      • South Africa
      • Saudi Arabia
    • Rest of World (ROW)

By End-user Insights

The commercial segment is estimated to witness significant growth during the forecast period.

The commercial segment, serving professional loggers and arborists, remains a critical revenue driver. These users require commercial-grade cutting tools and high-performance forestry saws that deliver reliability for demanding tasks like timber harvesting equipment and demolition cutting tool applications.

While the high-displacement petrol engine continues to be a mainstay for its raw power, the adoption of lithium-ion battery system technology is accelerating in urban forestry to meet noise regulations.

This shift is driven by a focus on superior power-to-weight ratio and ergonomic design to reduce operator fatigue.

Advanced arboriculture tools now demonstrate up to a 25% improvement in operational uptime in managed fleet scenarios due to reduced maintenance needs compared to their gas counterparts.

Request Free Sample

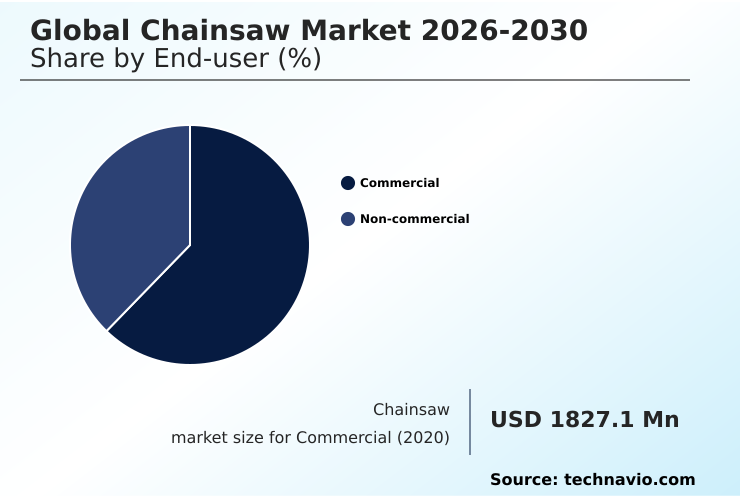
The Commercial segment was valued at USD 2.19 billion in 2024 and showed a gradual increase during the forecast period.

Request Free Sample

Regional Analysis

North America is estimated to contribute 40.6% to the growth of the global market during the forecast period.Technavio’s analysts have elaborately explained the regional trends and drivers that shape the market during the forecast period.

See How Chainsaw Market Demand is Rising in North America Request Free Sample

The geographic landscape is shaped by regional regulations and end-user needs. In North America, which accounts for over 40% of incremental market growth, the adoption of outdoor power equipment with brushless motor technology is surging.

In Europe, strict decibel limits have accelerated the transition to electric models, with sales of high-capacity battery tools growing 22% year-over-year in some urban markets. Innovations like solid-state battery technology are poised to further disrupt these mature markets.

Meanwhile, in APAC and South America, demand for traditional gas-powered arborist saws for timber harvesting equipment remains robust, although interest in bio-fuels is growing.

Digital connectivity is a unifying global trend, allowing fleet managers to track tool performance and maintenance needs across diverse regions.

Market Dynamics

Our researchers analyzed the data with 2025 as the base year, along with the key drivers, trends, and challenges. A holistic analysis of drivers will help companies refine their marketing strategies to gain a competitive advantage.

  • Navigating the chainsaw market requires understanding the specific needs of different users. A primary consideration is the gas vs electric chainsaw for homeowners, where electric models often win for ease of use and lower maintenance. For professionals, identifying the best professional arborist chainsaw features such as a high power-to-weight ratio and advanced safety systems is critical.
  • Regardless of the user, chainsaw safety for diy projects and professional work cannot be overstated, making chainsaw kickback prevention techniques and proper handling essential knowledge. Effective chainsaw maintenance for longer life starts with a consistent chainsaw engine maintenance checklist and adhering to chainsaw chain sharpening best practices.
  • The choice between a top-handle vs rear-handle chainsaw often depends on the task, with top-handle models favored for in-tree work. Furthermore, understanding chainsaw bar and chain sizes is crucial for performance. Specialized applications, like learning how to choose a chainsaw for cutting concrete or effective chainsaw use in construction demolition, require specific tool knowledge.
  • For battery models, a cordless chainsaw battery compatibility guide is invaluable. Proper chainsaw cutting techniques for firewood and using a chainsaw for storm cleanup can improve efficiency by more than double that of an amateur approach, while exploring eco-friendly chainsaw fuel options is a growing consideration. Finally, being able to perform basic troubleshooting common chainsaw starting problems ensures minimal downtime.

What are the key market drivers leading to the rise in the adoption of Chainsaw Industry?

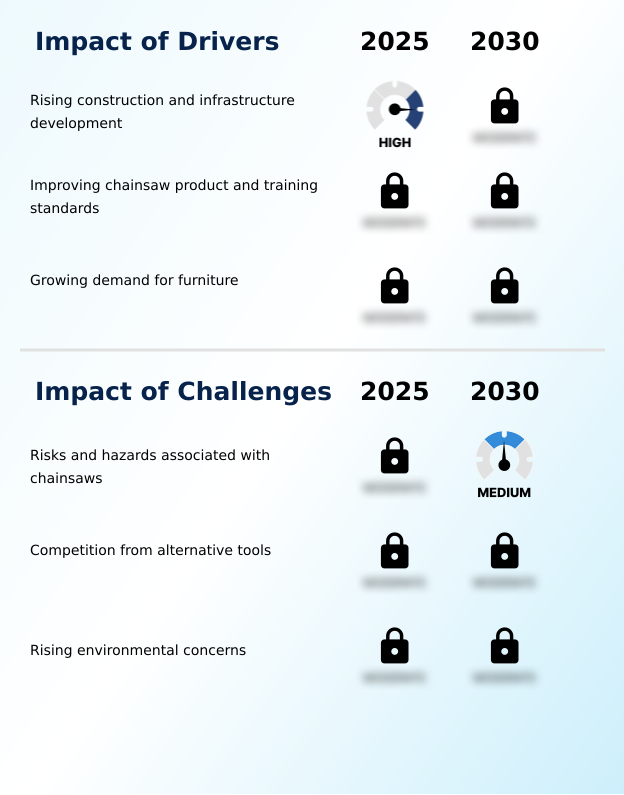
  • The global expansion of construction and infrastructure development activities serves as a primary driver for the chainsaw market.

  • The expansion of construction and infrastructure is a primary market driver. Chainsaws are essential construction cutting tools for cutting lumber and serve as vital wood cutting tools in framing and demolition.
  • Specialized models featuring a diamond-tipped chain are increasingly used as a concrete cutting saw and for masonry cutting tools, reducing task time by up to 30% compared to traditional methods.
  • For large-scale infrastructure development tools and land clearing equipment, high-torque cordless chainsaws powered by cordless lithium-ion chainsaws offer mobility without emissions.
  • The reliability of the two-stroke engine, enhanced with stratified scavenging, ensures these tools remain critical for site preparation equipment, where power is non-negotiable. Proper guide bar selection further enhances precision, improving material-use efficiency by over 10% on complex jobs.

What are the market trends shaping the Chainsaw Industry?

  • A prominent market trend is the rising engagement of homeowners in do-it-yourself projects. This fuels demand for user-friendly, accessible chainsaws for home improvement and garden maintenance.

  • The rise in DIY activities is a significant market trend, expanding the user base for lightweight cordless chainsaws and the compact electric garden chainsaw. Homeowners increasingly seek versatile cordless power tools for property maintenance tools, firewood preparation, and storm debris clearance.
  • This shift has led to product innovations focusing on ease of use and safety, with features like an automated chain brake and enhanced kickback protection becoming standard. These user-friendly models show a 20% higher adoption rate among first-time buyers.
  • As homeowners invest more in yard maintenance equipment, moving beyond traditional walk-behind mowers to more advanced tools, the demand for accessible cutting solutions grows, with some retailers reporting a 15% increase in bundled sales of chainsaws with other DIY home improvement tools.

What challenges does the Chainsaw Industry face during its growth?

  • Inherent operational risks and safety hazards associated with chainsaw use pose a significant challenge to market growth.

  • Significant challenges stem from the inherent risks of using handheld power tools. Operator safety concerns, particularly in professional landscaping and tree felling equipment, restrain market growth. To mitigate these risks, manufacturers are heavily investing in anti-vibration technology and other vibration reduction systems, which can decrease long-term health risks by over 40%.
  • Advanced features like real-time chain tension monitoring and improved acoustic insulation also enhance safety. For gas models, the integration of a catalytic converter addresses environmental concerns, contributing to carbon footprint reduction efforts.
  • However, improper use remains a primary issue, with data indicating that formal training can reduce accident rates by as much as 60%, highlighting the need for continuous education for users of all branch pruning tools.

Exclusive Technavio Analysis on Customer Landscape

The chainsaw market forecasting report includes the adoption lifecycle of the market, covering from the innovator’s stage to the laggard’s stage. It focuses on adoption rates in different regions based on penetration. Furthermore, the chainsaw market report also includes key purchase criteria and drivers of price sensitivity to help companies evaluate and develop their market growth analysis strategies.

Customer Landscape of Chainsaw Industry

Competitive Landscape

Companies are implementing various strategies, such as strategic alliances, chainsaw market forecast, partnerships, mergers and acquisitions, geographical expansion, and product/service launches, to enhance their presence in the industry.

AL KO Gardentech - Analysis indicates a focus on high-performance outdoor power equipment for professional forestry and residential garden care, with increasing emphasis on battery-powered and robotic solutions.

The industry research and growth report includes detailed analyses of the competitive landscape of the market and information about key companies, including:

  • AL KO Gardentech
  • Alfred Karcher SE and Co. KG
  • ANDREAS STIHL AG and Co. KG
  • Briggs and Stratton Corp.
  • EGO Power
  • Einhell Germany AG
  • Husqvarna AB
  • Makita Corp.
  • Oregon Tool Inc.
  • Robert Bosch GmbH
  • Stanley Black and Decker Inc.
  • STIGA SpA
  • Talon Tough Tools
  • Techtronic Industries Co. Ltd.
  • The Toro Co.
  • Yamabiko Corp.
  • Yard Force

Qualitative and quantitative analysis of companies has been conducted to help clients understand the wider business environment as well as the strengths and weaknesses of key industry players. Data is qualitatively analyzed to categorize companies as pure play, category-focused, industry-focused, and diversified; it is quantitatively analyzed to categorize companies as dominant, leading, strong, tentative, and weak.

Recent Development and News in Chainsaw market

  • In May 2025, Makita Corp. finalized a strategic collaboration with a renewable energy firm to power the organization's primary chainsaw assembly lines using exclusively solar energy, advancing its sustainability goals.
  • In April 2025, The Global Forestry Alliance introduced a new certification standard for heavy-duty electric chainsaws used in municipal land management, promoting safer and more environmentally friendly urban forestry practices.
  • In March 2025, Milwaukee Tool announced the integration of solid-state battery technology within its professional chainsaw range, a key part of its product roadmap to enhance the power-to-weight ratio for professional arborists.
  • In February 2025, ANDREAS STIHL AG and Co. KG launched a sophisticated artificial intelligence interface for its professional battery series, enabling real-time monitoring of chain tension and motor temperature for improved performance and safety.

Dive into Technavio’s robust research methodology, blending expert interviews, extensive data synthesis, and validated models for unparalleled Chainsaw Market insights. See full methodology.

Market Scope
Page number 279
Base year 2025
Historic period 2020-2024
Forecast period 2026-2030
Growth momentum & CAGR Accelerate at a CAGR of 5.2%
Market growth 2026-2030 USD 1064.9 million
Market structure Fragmented
YoY growth 2025-2026(%) 5.0%
Key countries US, Canada, Mexico, Germany, France, UK, Spain, Italy, The Netherlands, China, Japan, India, South Korea, Australia, Indonesia, Brazil, Argentina, Chile, Turkey, South Africa, Saudi Arabia, UAE and Israel
Competitive landscape Leading Companies, Market Positioning of Companies, Competitive Strategies, and Industry Risks

Request Free Sample

Research Analyst Overview

  • The chainsaw market's evolution is defined by a decisive pivot toward electrification and intelligent systems. Core advancements in brushless motor technology and lithium-ion battery system development are reshaping product capabilities, enabling high-torque cordless chainsaw models to challenge the dominance of the two-stroke engine.
  • This transition is not merely a technological shift but a strategic response to tightening environmental regulations, influencing boardroom decisions on R&D investment to ensure compliance with new decibel limits and carbon footprint reduction targets. Innovations such as the automated chain brake, enhanced anti-vibration technology, and real-time chain tension monitoring are becoming standard.
  • The integration of a solid-state battery promises to further improve the power-to-weight ratio, a critical metric for professional users of arborist saws. In practice, firms adopting tools with advanced ergonomic design and vibration reduction have reported a 15% increase in operator productivity due to reduced fatigue.

What are the Key Data Covered in this Chainsaw Market Research and Growth Report?

  • What is the expected growth of the Chainsaw Market between 2026 and 2030?

    • USD 1.06 billion, at a CAGR of 5.2%

  • What segmentation does the market report cover?

    • The report is segmented by End-user (Commercial, and Non-commercial), Product (Gas-powered, and Electric-powered), Distribution Channel (Offline, and Online) and Geography (North America, Europe, APAC, South America, Middle East and Africa)

  • Which regions are analyzed in the report?

    • North America, Europe, APAC, South America and Middle East and Africa

  • What are the key growth drivers and market challenges?

    • Rising construction and infrastructure development, Risks and hazards associated with chainsaws

  • Who are the major players in the Chainsaw Market?

    • AL KO Gardentech, Alfred Karcher SE and Co. KG, ANDREAS STIHL AG and Co. KG, Briggs and Stratton Corp., EGO Power, Einhell Germany AG, Husqvarna AB, Makita Corp., Oregon Tool Inc., Robert Bosch GmbH, Stanley Black and Decker Inc., STIGA SpA, Talon Tough Tools, Techtronic Industries Co. Ltd., The Toro Co., Yamabiko Corp. and Yard Force

Market Research Insights

  • The market's dynamics are shaped by evolving end-user demands across professional and residential sectors. The need for efficient forestry management equipment and timber harvesting equipment drives innovation in high-power segments, while the growing DIY trend fuels demand for accessible property maintenance tools and yard maintenance equipment.
  • The transition to battery power is a defining characteristic, with adoption rates for electric models used in garden maintenance tools increasing by 18% in suburban markets. This shift delivers tangible business outcomes; for instance, professional crews using electric arboriculture tools in noise-sensitive zones report a 90% reduction in noise complaints, improving community relations.
  • Furthermore, the versatility of these tools for applications ranging from storm debris clearance to construction cutting tools broadens their appeal, with multi-use platforms demonstrating a 25% higher lifetime value for commercial buyers.

We can help! Our analysts can customize this chainsaw market research report to meet your requirements.

Get in touch

1. Executive Summary

1.1 Market overview

Executive Summary - Chart on Market Overview
Executive Summary - Data Table on Market Overview
Executive Summary - Chart on Global Market Characteristics
Executive Summary - Chart on Market by Geography
Executive Summary - Chart on Market Segmentation by End-user
Executive Summary - Chart on Market Segmentation by Product
Executive Summary - Chart on Market Segmentation by Distribution Channel
Executive Summary - Chart on Incremental Growth
Executive Summary - Data Table on Incremental Growth
Executive Summary - Chart on Company Market Positioning

2. Technavio Analysis

2.1 Analysis of price sensitivity, lifecycle, customer purchase basket, adoption rates, and purchase criteria

2.2 Criticality of inputs and Factors of differentiation

Chart on Overview on criticality of inputs and factors of differentiation

2.3 Factors of disruption

Chart on Overview on factors of disruption

2.4 Impact of drivers and challenges

Chart on Impact of drivers and challenges in 2025 and 2030

3. Market Landscape

3.1 Market ecosystem

Chart on Parent Market
Data Table on - Parent Market

3.2 Market characteristics

Chart on Market characteristics analysis

3.3 Value chain analysis

Chart on Value chain analysis

4. Market Sizing

4.1 Market definition

Data Table on Offerings of companies included in the market definition

4.2 Market segment analysis

Market segments

4.3 Market size 2025

4.4 Market outlook: Forecast for 2025-2030

Chart on Global - Market size and forecast 2025-2030 ($ million)
Data Table on Global - Market size and forecast 2025-2030 ($ million)
Chart on Global Market: Year-over-year growth 2025-2030 (%)
Data Table on Global Market: Year-over-year growth 2025-2030 (%)

5. Historic Market Size

5.1 Global Chainsaw Market 2020 - 2024

Historic Market Size - Data Table on Global Chainsaw Market 2020 - 2024 ($ million)

5.2 End-user segment analysis 2020 - 2024

Historic Market Size - End-user Segment 2020 - 2024 ($ million)

5.3 Product segment analysis 2020 - 2024

Historic Market Size - Product Segment 2020 - 2024 ($ million)

5.4 Distribution Channel segment analysis 2020 - 2024

Historic Market Size - Distribution Channel Segment 2020 - 2024 ($ million)

5.5 Geography segment analysis 2020 - 2024

Historic Market Size - Geography Segment 2020 - 2024 ($ million)

5.6 Country segment analysis 2020 - 2024

Historic Market Size - Country Segment 2020 - 2024 ($ million)

6. Qualitative Analysis

6.1 The Impact of AI in the Global Chainsaw Market

7. Five Forces Analysis

7.1 Five forces summary

Five forces analysis - Comparison between 2025 and 2030

7.2 Bargaining power of buyers

Bargaining power of buyers - Impact of key factors 2025 and 2030

7.3 Bargaining power of suppliers

Bargaining power of suppliers - Impact of key factors in 2025 and 2030

7.4 Threat of new entrants

Threat of new entrants - Impact of key factors in 2025 and 2030

7.5 Threat of substitutes

Threat of substitutes - Impact of key factors in 2025 and 2030

7.6 Threat of rivalry

Threat of rivalry - Impact of key factors in 2025 and 2030

7.7 Market condition

Chart on Market condition - Five forces 2025 and 2030

8. Market Segmentation by End-user

8.1 Market segments

Chart on End-user - Market share 2025-2030 (%)
Data Table on End-user - Market share 2025-2030 (%)

8.2 Comparison by End-user

Chart on Comparison by End-user
Data Table on Comparison by End-user

8.3 Commercial - Market size and forecast 2025-2030

Chart on Commercial - Market size and forecast 2025-2030 ($ million)
Data Table on Commercial - Market size and forecast 2025-2030 ($ million)
Chart on Commercial - Year-over-year growth 2025-2030 (%)
Data Table on Commercial - Year-over-year growth 2025-2030 (%)

8.4 Non-commercial - Market size and forecast 2025-2030

Chart on Non-commercial - Market size and forecast 2025-2030 ($ million)
Data Table on Non-commercial - Market size and forecast 2025-2030 ($ million)
Chart on Non-commercial - Year-over-year growth 2025-2030 (%)
Data Table on Non-commercial - Year-over-year growth 2025-2030 (%)

8.5 Market opportunity by End-user

Market opportunity by End-user ($ million)
Data Table on Market opportunity by End-user ($ million)

9. Market Segmentation by Product

9.1 Market segments

Chart on Product - Market share 2025-2030 (%)
Data Table on Product - Market share 2025-2030 (%)

9.2 Comparison by Product

Chart on Comparison by Product
Data Table on Comparison by Product

9.3 Gas-powered - Market size and forecast 2025-2030

Chart on Gas-powered - Market size and forecast 2025-2030 ($ million)
Data Table on Gas-powered - Market size and forecast 2025-2030 ($ million)
Chart on Gas-powered - Year-over-year growth 2025-2030 (%)
Data Table on Gas-powered - Year-over-year growth 2025-2030 (%)

9.4 Electric-powered - Market size and forecast 2025-2030

Chart on Electric-powered - Market size and forecast 2025-2030 ($ million)
Data Table on Electric-powered - Market size and forecast 2025-2030 ($ million)
Chart on Electric-powered - Year-over-year growth 2025-2030 (%)
Data Table on Electric-powered - Year-over-year growth 2025-2030 (%)

9.5 Market opportunity by Product

Market opportunity by Product ($ million)
Data Table on Market opportunity by Product ($ million)

10. Market Segmentation by Distribution Channel

10.1 Market segments

Chart on Distribution Channel - Market share 2025-2030 (%)
Data Table on Distribution Channel - Market share 2025-2030 (%)

10.2 Comparison by Distribution Channel

Chart on Comparison by Distribution Channel
Data Table on Comparison by Distribution Channel

10.3 Offline - Market size and forecast 2025-2030

Chart on Offline - Market size and forecast 2025-2030 ($ million)
Data Table on Offline - Market size and forecast 2025-2030 ($ million)
Chart on Offline - Year-over-year growth 2025-2030 (%)
Data Table on Offline - Year-over-year growth 2025-2030 (%)

10.4 Online - Market size and forecast 2025-2030

Chart on Online - Market size and forecast 2025-2030 ($ million)
Data Table on Online - Market size and forecast 2025-2030 ($ million)
Chart on Online - Year-over-year growth 2025-2030 (%)
Data Table on Online - Year-over-year growth 2025-2030 (%)

10.5 Market opportunity by Distribution Channel

Market opportunity by Distribution Channel ($ million)
Data Table on Market opportunity by Distribution Channel ($ million)

11. Customer Landscape

11.1 Customer landscape overview

Analysis of price sensitivity, lifecycle, customer purchase basket, adoption rates, and purchase criteria

12. Geographic Landscape

12.1 Geographic segmentation

Chart on Market share by geography 2025-2030 (%)
Data Table on Market share by geography 2025-2030 (%)

12.2 Geographic comparison

Chart on Geographic comparison
Data Table on Geographic comparison

12.3 North America - Market size and forecast 2025-2030

Chart on North America - Market size and forecast 2025-2030 ($ million)
Data Table on North America - Market size and forecast 2025-2030 ($ million)
Chart on North America - Year-over-year growth 2025-2030 (%)
Data Table on North America - Year-over-year growth 2025-2030 (%)
Chart on Regional Comparison - North America
Data Table on Regional Comparison - North America

12.3.1 US - Market size and forecast 2025-2030

Chart on US - Market size and forecast 2025-2030 ($ million)
Data Table on US - Market size and forecast 2025-2030 ($ million)
Chart on US - Year-over-year growth 2025-2030 (%)
Data Table on US - Year-over-year growth 2025-2030 (%)

12.3.2 Canada - Market size and forecast 2025-2030

Chart on Canada - Market size and forecast 2025-2030 ($ million)
Data Table on Canada - Market size and forecast 2025-2030 ($ million)
Chart on Canada - Year-over-year growth 2025-2030 (%)
Data Table on Canada - Year-over-year growth 2025-2030 (%)

12.3.3 Mexico - Market size and forecast 2025-2030

Chart on Mexico - Market size and forecast 2025-2030 ($ million)
Data Table on Mexico - Market size and forecast 2025-2030 ($ million)
Chart on Mexico - Year-over-year growth 2025-2030 (%)
Data Table on Mexico - Year-over-year growth 2025-2030 (%)

12.4 Europe - Market size and forecast 2025-2030

Chart on Europe - Market size and forecast 2025-2030 ($ million)
Data Table on Europe - Market size and forecast 2025-2030 ($ million)
Chart on Europe - Year-over-year growth 2025-2030 (%)
Data Table on Europe - Year-over-year growth 2025-2030 (%)
Chart on Regional Comparison - Europe
Data Table on Regional Comparison - Europe

12.4.1 Germany - Market size and forecast 2025-2030

Chart on Germany - Market size and forecast 2025-2030 ($ million)
Data Table on Germany - Market size and forecast 2025-2030 ($ million)
Chart on Germany - Year-over-year growth 2025-2030 (%)
Data Table on Germany - Year-over-year growth 2025-2030 (%)

12.4.2 France - Market size and forecast 2025-2030

Chart on France - Market size and forecast 2025-2030 ($ million)
Data Table on France - Market size and forecast 2025-2030 ($ million)
Chart on France - Year-over-year growth 2025-2030 (%)
Data Table on France - Year-over-year growth 2025-2030 (%)

12.4.3 UK - Market size and forecast 2025-2030

Chart on UK - Market size and forecast 2025-2030 ($ million)
Data Table on UK - Market size and forecast 2025-2030 ($ million)
Chart on UK - Year-over-year growth 2025-2030 (%)
Data Table on UK - Year-over-year growth 2025-2030 (%)

12.4.4 Spain - Market size and forecast 2025-2030

Chart on Spain - Market size and forecast 2025-2030 ($ million)
Data Table on Spain - Market size and forecast 2025-2030 ($ million)
Chart on Spain - Year-over-year growth 2025-2030 (%)
Data Table on Spain - Year-over-year growth 2025-2030 (%)

12.4.5 Italy - Market size and forecast 2025-2030

Chart on Italy - Market size and forecast 2025-2030 ($ million)
Data Table on Italy - Market size and forecast 2025-2030 ($ million)
Chart on Italy - Year-over-year growth 2025-2030 (%)
Data Table on Italy - Year-over-year growth 2025-2030 (%)

12.4.6 The Netherlands - Market size and forecast 2025-2030

Chart on The Netherlands - Market size and forecast 2025-2030 ($ million)
Data Table on The Netherlands - Market size and forecast 2025-2030 ($ million)
Chart on The Netherlands - Year-over-year growth 2025-2030 (%)
Data Table on The Netherlands - Year-over-year growth 2025-2030 (%)

12.5 APAC - Market size and forecast 2025-2030

Chart on APAC - Market size and forecast 2025-2030 ($ million)
Data Table on APAC - Market size and forecast 2025-2030 ($ million)
Chart on APAC - Year-over-year growth 2025-2030 (%)
Data Table on APAC - Year-over-year growth 2025-2030 (%)
Chart on Regional Comparison - APAC
Data Table on Regional Comparison - APAC

12.5.1 China - Market size and forecast 2025-2030

Chart on China - Market size and forecast 2025-2030 ($ million)
Data Table on China - Market size and forecast 2025-2030 ($ million)
Chart on China - Year-over-year growth 2025-2030 (%)
Data Table on China - Year-over-year growth 2025-2030 (%)

12.5.2 Japan - Market size and forecast 2025-2030

Chart on Japan - Market size and forecast 2025-2030 ($ million)
Data Table on Japan - Market size and forecast 2025-2030 ($ million)
Chart on Japan - Year-over-year growth 2025-2030 (%)
Data Table on Japan - Year-over-year growth 2025-2030 (%)

12.5.3 India - Market size and forecast 2025-2030

Chart on India - Market size and forecast 2025-2030 ($ million)
Data Table on India - Market size and forecast 2025-2030 ($ million)
Chart on India - Year-over-year growth 2025-2030 (%)
Data Table on India - Year-over-year growth 2025-2030 (%)

12.5.4 South Korea - Market size and forecast 2025-2030

Chart on South Korea - Market size and forecast 2025-2030 ($ million)
Data Table on South Korea - Market size and forecast 2025-2030 ($ million)
Chart on South Korea - Year-over-year growth 2025-2030 (%)
Data Table on South Korea - Year-over-year growth 2025-2030 (%)

12.5.5 Australia - Market size and forecast 2025-2030

Chart on Australia - Market size and forecast 2025-2030 ($ million)
Data Table on Australia - Market size and forecast 2025-2030 ($ million)
Chart on Australia - Year-over-year growth 2025-2030 (%)
Data Table on Australia - Year-over-year growth 2025-2030 (%)

12.5.6 Indonesia - Market size and forecast 2025-2030

Chart on Indonesia - Market size and forecast 2025-2030 ($ million)
Data Table on Indonesia - Market size and forecast 2025-2030 ($ million)
Chart on Indonesia - Year-over-year growth 2025-2030 (%)
Data Table on Indonesia - Year-over-year growth 2025-2030 (%)

12.6 South America - Market size and forecast 2025-2030

Chart on South America - Market size and forecast 2025-2030 ($ million)
Data Table on South America - Market size and forecast 2025-2030 ($ million)
Chart on South America - Year-over-year growth 2025-2030 (%)
Data Table on South America - Year-over-year growth 2025-2030 (%)
Chart on Regional Comparison - South America
Data Table on Regional Comparison - South America

12.6.1 Brazil - Market size and forecast 2025-2030

Chart on Brazil - Market size and forecast 2025-2030 ($ million)
Data Table on Brazil - Market size and forecast 2025-2030 ($ million)
Chart on Brazil - Year-over-year growth 2025-2030 (%)
Data Table on Brazil - Year-over-year growth 2025-2030 (%)

12.6.2 Argentina - Market size and forecast 2025-2030

Chart on Argentina - Market size and forecast 2025-2030 ($ million)
Data Table on Argentina - Market size and forecast 2025-2030 ($ million)
Chart on Argentina - Year-over-year growth 2025-2030 (%)
Data Table on Argentina - Year-over-year growth 2025-2030 (%)

12.6.3 Chile - Market size and forecast 2025-2030

Chart on Chile - Market size and forecast 2025-2030 ($ million)
Data Table on Chile - Market size and forecast 2025-2030 ($ million)
Chart on Chile - Year-over-year growth 2025-2030 (%)
Data Table on Chile - Year-over-year growth 2025-2030 (%)

12.7 Middle East and Africa - Market size and forecast 2025-2030

Chart on Middle East and Africa - Market size and forecast 2025-2030 ($ million)
Data Table on Middle East and Africa - Market size and forecast 2025-2030 ($ million)
Chart on Middle East and Africa - Year-over-year growth 2025-2030 (%)
Data Table on Middle East and Africa - Year-over-year growth 2025-2030 (%)
Chart on Regional Comparison - Middle East and Africa
Data Table on Regional Comparison - Middle East and Africa

12.7.1 Turkey - Market size and forecast 2025-2030

Chart on Turkey - Market size and forecast 2025-2030 ($ million)
Data Table on Turkey - Market size and forecast 2025-2030 ($ million)
Chart on Turkey - Year-over-year growth 2025-2030 (%)
Data Table on Turkey - Year-over-year growth 2025-2030 (%)

12.7.2 South Africa - Market size and forecast 2025-2030

Chart on South Africa - Market size and forecast 2025-2030 ($ million)
Data Table on South Africa - Market size and forecast 2025-2030 ($ million)
Chart on South Africa - Year-over-year growth 2025-2030 (%)
Data Table on South Africa - Year-over-year growth 2025-2030 (%)

12.7.3 Saudi Arabia - Market size and forecast 2025-2030

Chart on Saudi Arabia - Market size and forecast 2025-2030 ($ million)
Data Table on Saudi Arabia - Market size and forecast 2025-2030 ($ million)
Chart on Saudi Arabia - Year-over-year growth 2025-2030 (%)
Data Table on Saudi Arabia - Year-over-year growth 2025-2030 (%)

12.7.4 UAE - Market size and forecast 2025-2030

Chart on UAE - Market size and forecast 2025-2030 ($ million)
Data Table on UAE - Market size and forecast 2025-2030 ($ million)
Chart on UAE - Year-over-year growth 2025-2030 (%)
Data Table on UAE - Year-over-year growth 2025-2030 (%)

12.7.5 Israel - Market size and forecast 2025-2030

Chart on Israel - Market size and forecast 2025-2030 ($ million)
Data Table on Israel - Market size and forecast 2025-2030 ($ million)
Chart on Israel - Year-over-year growth 2025-2030 (%)
Data Table on Israel - Year-over-year growth 2025-2030 (%)

12.8 Market opportunity by geography

Market opportunity by geography ($ million)
Data Tables on Market opportunity by geography ($ million)

13. Drivers, Challenges, and Opportunity

13.1 Market drivers

Rising construction and infrastructure development
Improving chainsaw product and training standards
Growing demand for furniture

13.2 Market challenges

Risks and hazards associated with chainsaws
Competition from alternative tools
Rising environmental concerns

13.3 Impact of drivers and challenges

Impact of drivers and challenges in 2025 and 2030

13.4 Market opportunities

Rise in do-it-yourself enthusiasts
Increased usage in agriculture and horticulture
Wireless battery charging technology

14. Competitive Landscape

14.1 Overview

14.2

Overview on criticality of inputs and factors of differentiation

14.3 Landscape disruption

Overview on factors of disruption

14.4 Industry risks

Impact of key risks on business

15. Competitive Analysis

15.1 Companies profiled

Companies covered

15.2 Company ranking index

15.3 Market positioning of companies

Matrix on companies position and classification

15.4 Alfred Karcher SE and Co. KG

Alfred Karcher SE and Co. KG - Overview
Alfred Karcher SE and Co. KG - Product / Service
Alfred Karcher SE and Co. KG - Key offerings
SWOT

15.5 ANDREAS STIHL AG and Co. KG

ANDREAS STIHL AG and Co. KG - Overview
ANDREAS STIHL AG and Co. KG - Product / Service
ANDREAS STIHL AG and Co. KG - Key offerings
SWOT

15.6 Briggs and Stratton Corp.

Briggs and Stratton Corp. - Overview
Briggs and Stratton Corp. - Product / Service
Briggs and Stratton Corp. - Key news
Briggs and Stratton Corp. - Key offerings
SWOT

15.7 EGO Power

EGO Power - Overview
EGO Power - Product / Service
EGO Power - Key offerings
SWOT

15.8 Einhell Germany AG

Einhell Germany AG - Overview
Einhell Germany AG - Business segments
Einhell Germany AG - Key offerings
Einhell Germany AG - Segment focus
SWOT

15.9 Husqvarna AB

Husqvarna AB - Overview
Husqvarna AB - Business segments
Husqvarna AB - Key news
Husqvarna AB - Key offerings
Husqvarna AB - Segment focus
SWOT

15.10 Makita Corp.

Makita Corp. - Overview
Makita Corp. - Business segments
Makita Corp. - Key offerings
Makita Corp. - Segment focus
SWOT

15.11 Oregon Tool Inc.

Oregon Tool Inc. - Overview
Oregon Tool Inc. - Product / Service
Oregon Tool Inc. - Key offerings
SWOT

15.12 Robert Bosch GmbH

Robert Bosch GmbH - Overview
Robert Bosch GmbH - Product / Service
Robert Bosch GmbH - Key news
Robert Bosch GmbH - Key offerings
SWOT

15.13 Stanley Black and Decker Inc.

Stanley Black and Decker Inc. - Overview
Stanley Black and Decker Inc. - Business segments
Stanley Black and Decker Inc. - Key offerings
Stanley Black and Decker Inc. - Segment focus
SWOT

15.14 STIGA SpA

STIGA SpA - Overview
STIGA SpA - Product / Service
STIGA SpA - Key offerings
SWOT

15.15 Talon Tough Tools

Talon Tough Tools - Overview
Talon Tough Tools - Product / Service
Talon Tough Tools - Key offerings
SWOT

15.16 Techtronic Industries Co. Ltd.

Techtronic Industries Co. Ltd. - Overview
Techtronic Industries Co. Ltd. - Business segments
Techtronic Industries Co. Ltd. - Key offerings
Techtronic Industries Co. Ltd. - Segment focus
SWOT

15.17 The Toro Co.

The Toro Co. - Overview
The Toro Co. - Business segments
The Toro Co. - Key news
The Toro Co. - Key offerings
The Toro Co. - Segment focus
SWOT

15.18 Yamabiko Corp.

Yamabiko Corp. - Overview
Yamabiko Corp. - Business segments
Yamabiko Corp. - Key offerings
Yamabiko Corp. - Segment focus
SWOT

16. Appendix

16.1 Scope of the report

Market definition
Objectives
Notes and caveats

16.2 Inclusions and exclusions checklist

Inclusions checklist
Exclusions checklist

16.3 Currency conversion rates for US$

16.4 Research methodology

16.5 Data procurement

Information sources

16.6 Data validation

16.7 Validation techniques employed for market sizing

16.8 Data synthesis

16.9 360 degree market analysis

16.10 List of abbreviations

Research Methodology

Technavio presents a detailed picture of the market by way of study, synthesis, and summation of data from multiple sources. The analysts have presented the various facets of the market with a particular focus on identifying the key industry influencers. The data thus presented is comprehensive, reliable, and the result of extensive research, both primary and secondary.

INFORMATION SOURCES

Primary sources

  • Manufacturers and suppliers
  • Channel partners
  • Industry experts
  • Strategic decision makers

Secondary sources

  • Industry journals and periodicals
  • Government data
  • Financial reports of key industry players
  • Historical data
  • Press releases

DATA ANALYSIS

Data Synthesis

  • Collation of data
  • Estimation of key figures
  • Analysis of derived insights

Data Validation

  • Triangulation with data models
  • Reference against proprietary databases
  • Corroboration with industry experts

REPORT WRITING

Qualitative

  • Market drivers
  • Market challenges
  • Market trends
  • Five forces analysis

Quantitative

  • Market size and forecast
  • Market segmentation
  • Geographical insights
  • Competitive landscape

Interested in this report?

Get your sample now to see our research methodology and insights!

Download Now

Frequently Asked Questions

Chainsaw market growth will increase by USD 1064.9 million during 2026-2030.

The Chainsaw market is expected to grow at a CAGR of 5.2% during 2026-2030.

Chainsaw market is segmented by End-user (Commercial, Non-commercial) Product (Gas-powered, Electric-powered) Distribution channel (Offline, Online)

AL KO Gardentech, Alfred Karcher SE and Co. KG, ANDREAS STIHL AG and Co. KG, Briggs and Stratton Corp., EGO Power, Einhell Germany AG, Husqvarna AB, Makita Corp., Oregon Tool Inc., Robert Bosch GmbH, Stanley Black and Decker Inc., STIGA SpA, Talon Tough Tools, Techtronic Industries Co. Ltd., The Toro Co., Yamabiko Corp., Yard Force are a few of the key vendors in the Chainsaw market.

North America will register the highest growth rate of 40.6% among the other regions. Therefore, the Chainsaw market in North America is expected to garner significant business opportunities for the vendors during the forecast period.

US, Canada, Mexico, Germany, France, UK, Spain, Italy, The Netherlands, China, Japan, India, South Korea, Australia, Indonesia, Brazil, Argentina, Chile, Turkey, South Africa, Saudi Arabia, UAE, Israel

  • Rising construction and infrastructure development is the driving factor this market.

The Chainsaw market vendors should focus on grabbing business opportunities from the End-user segment as it accounted for the largest market share in the base year.