Chart Recorder Market Size 2024-2028
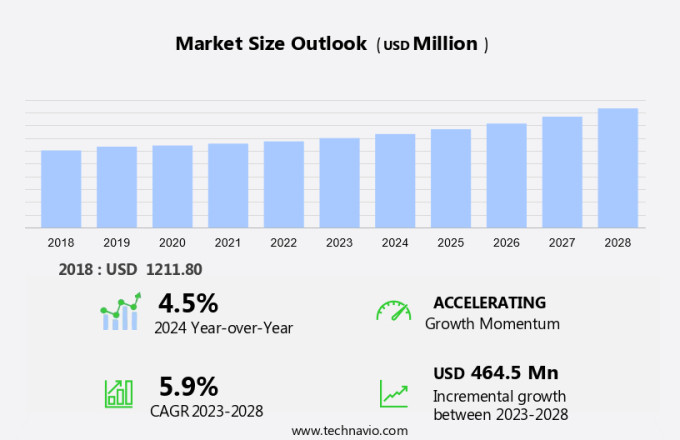
The chart recorder market size is forecast to increase by USD 464.5 million at a CAGR of 5.9% between 2023 and 2028. The market is experiencing significant growth due to the increasing demand for multi-channel recording solutions, particularly in sectors like water purification systems where accurate data recording is essential for monitoring system performance. Strip chart recorders and circular chart recorders continue to be popular choices for continuous analog record keeping. However, the emergence of data loggers and automated data acquisition systems has introduced digital file storage as a viable alternative, offering enhanced efficiency and accuracy. Multi-pen recorders offer the advantage of recording multiple data streams on a single chart, which is beneficial in applications such as water quality monitoring. The market is also witnessing the introduction of web-based chart recorders, enabling remote monitoring and real-time data access. Despite these advancements, challenges such as the availability of substitutes and the need for calibration and maintenance persist. Overall, the market is expected to grow as industries, including those involved in water purification, continue to prioritize accurate and efficient data recording solutions.
What will the size of the market be during the forecast period?
The market for chart recorders, a vital component of data acquisition systems (DAQ), continues to gain traction in various industries, including manufacturing, science, engineering labs, and power plants. These instruments are essential for capturing, recording, and analyzing electrical signals and process parameters such as temperature, pressure, flow, pH, humidity, vibration, movement, diagnostics, and statistical analysis. Chart recorders offer high resolution visualization tools that enable real-time monitoring and analysis of data. Their applications span across numerous sectors, including water purification, where they help monitor turbidity, dissolved oxygen, and sterilization processes. In environmental testing, they assist in tracking the effectiveness of various processes and maintaining optimal conditions. In the manufacturing sector, chart recorders play a crucial role in equipment maintenance and power plant operations.
Moreover, in the context of single-channel and multi-channel applications, chart recorders cater to diverse requirements, offering flexibility and scalability. The demand for chart recorders is driven by the increasing need for accurate and reliable data acquisition and analysis in various industries. As the importance of data-driven decision-making continues to grow, the market for these instruments is expected to expand. Furthermore, the integration of advanced features, such as statistical analysis and diagnostics, enhances their value proposition, making them indispensable tools for various applications.
Market Segmentation
The market research report provides comprehensive data (region-wise segment analysis), with forecasts and estimates in "USD million" for the period 2024-2028, as well as historical data from 2018-2022 for the following segments.
- Type
- Digital chart recorders
- Analog chart recorders
- Application
- Food and beverage
- Pharmaceuticals
- Industrial applications
- Environmental monitoring
- Geography
- North America
- Canada
- US
- APAC
- China
- India
- Japan
- South Korea
- Europe
- Germany
- UK
- France
- Italy
- South America
- Middle East and Africa
- North America
By Type Insights
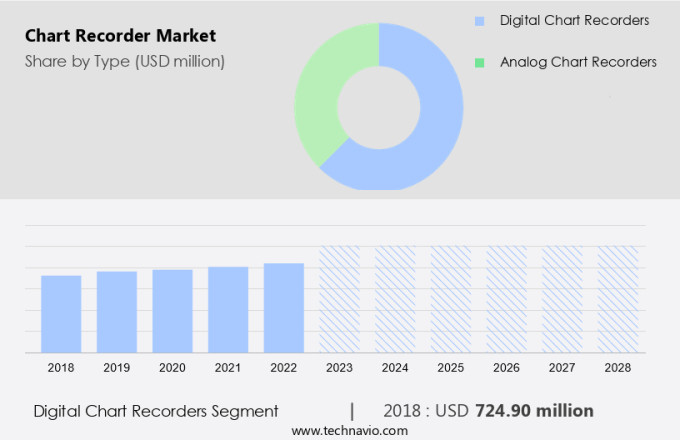
The digital chart recorders segment is estimated to witness significant growth during the forecast period. Digital chart recorders are an essential component of the expanding market, providing sophisticated features and enhanced functionality for modern data recording applications. One notable example is the OMEGA RD8250 by Omega Engineering Inc., which caters to diverse industrial requirements. This advanced digital process recorder boasts dual-function keys and a clear, colored graph display, ensuring a user-friendly experience. The RD8250 offers the flexibility to display real-time data in both digital and trend formats, making it a versatile tool for monitoring temperatures and other vital parameters in dispersed systems, marine installations, and large engines. The front-panel USB port enables seamless data transfer to a PC, enabling efficient analysis and management.
Real-time data can be viewed in both digital and trend formats, ensuring versatility and accuracy in monitoring. The front-panel USB port enables seamless data transfer to a PC via a flash memory card, streamlining data management and analysis. Multi-channel strip chart recorders, circular chart recorders, data loggers, and automated data acquisition systems are other essential components of the digital chart recorder market. Multi-pen recorders and continuous analog records continue to hold significance, complementing digital advancements. These devices offer valuable insights for industries, facilitating informed decision-making and process optimization.
Get a glance at the market share of various segments Request Free Sample
The Digital chart recorders segment accounted for USD 724.90 million in 2018 and showed a gradual increase during the forecast period.
Regional Insights
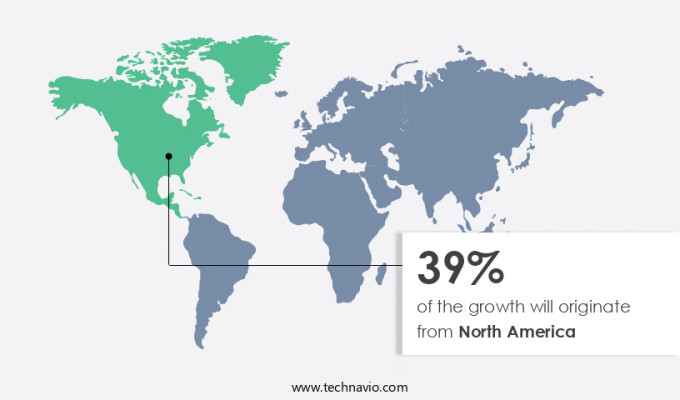
North America is estimated to contribute 39% to the growth of the global market during the forecast period. Technavio's analysts have elaborately explained the regional trends and drivers that shape the market during the forecast period.
For more insights on the market share of various regions Request Free Sample
In North America, the market is witnessing substantial growth due to advancements in technology and the implementation of advanced data acquisition (DAQ) systems. This innovative solution, based in the United States, enables users to effortlessly collect and visualize real-time data for temperature, humidity, and barometric pressure. The adoption of high-resolution measurement charts in various industries, such as healthcare, manufacturing, and research, further bolsters the market's growth in North America.
Our researchers analyzed the data with 2023 as the base year, along with the key drivers, trends, and challenges. A holistic analysis of drivers will help companies refine their marketing strategies to gain a competitive advantage.
Market Driver
Global manufacturing volume growth is the key driver of the market. The market in the United States is experiencing notable expansion due to the escalating manufacturing sector. Recent statistics reveal a modest uptick in US manufacturing production, with a 1.5% increase in the final quarter of 2023 compared to the same period in 2022. Furthermore, the sector registered a 1.0% growth from Q3 2023, signaling a transition towards an increasingly active production phase following a plateau since mid-2022. This revival in manufacturing activity is a significant catalyst for the market. With rising production volumes, the demand for accurate monitoring and documentation of various parameters such as pressure, flow, pH, humidity, vibration, and movement intensifies.
Further, diagnostic tools, statistical analysis, and visualization instruments play essential roles in ensuring optimal production processes and product quality. Companies in this sector focus on delivering advanced chart recorders that cater to the diverse needs of industries, including pharmaceuticals, food and beverage, oil and gas, and power generation.
Market Trends
The introduction of web-based chart recorders is the upcoming trend in the market. The market in the United States is undergoing a significant shift with the introduction of advanced web-based chart recorders. These innovative devices are transforming data collection, storage, and analysis processes, providing enhanced functionality and convenience for users. This product offers an advanced solution for monitoring environmental parameters, such as temperature, humidity, and barometric pressure, with a user-friendly web-based interface. Real-time data visualization and integration into existing systems are made possible through this device. One of its notable features is the expanded internal non-volatile storage capacity, enabling the recording and storage of large amounts of data.
Multi-channel strip chart recorders, circular chart recorders, data loggers, and automated data acquisition systems are also gaining popularity in the market. Multi-pen recorders provide the capability to record multiple data streams on a single chart. Digital files offer ease of data access and sharing, while micro chart recorders are compact and ideal for space-constrained applications. Automated data acquisition systems ensure continuous analog records, making them essential for industries requiring real-time data monitoring and analysis.
Market Challenge
The availability of viable substitutes is a key challenge affecting the market growth. The market in the United States continues to experience growth, particularly in sectors such as water purification, environmental testing, power plants, and equipment maintenance. Applications include monitoring parameters like Turbidity, Dissolved Oxygen, and sterilization Processes. In these industries, chart recorders play a crucial role in ensuring process efficiency and product quality. The xLDR is 50% lighter than previous models while maintaining the same level of crash protection for vital data like audio, flight data, video, and GPS parameters.
The xLDR not only adheres to but surpasses global regulations for crash-protected recorders on smaller aircraft. It introduces advanced features such as an increased data collection rate, automatic recording, and pilot-controlled capabilities, making it a preferred choice for various industries. In conclusion, the market is thriving, driven by its applications in water purification, environmental testing, power plants, and equipment maintenance. The xLDR, with its enhanced features and lightweight design, is a testament to the industry's commitment to progress and excellence.
Exclusive Customer Landscape
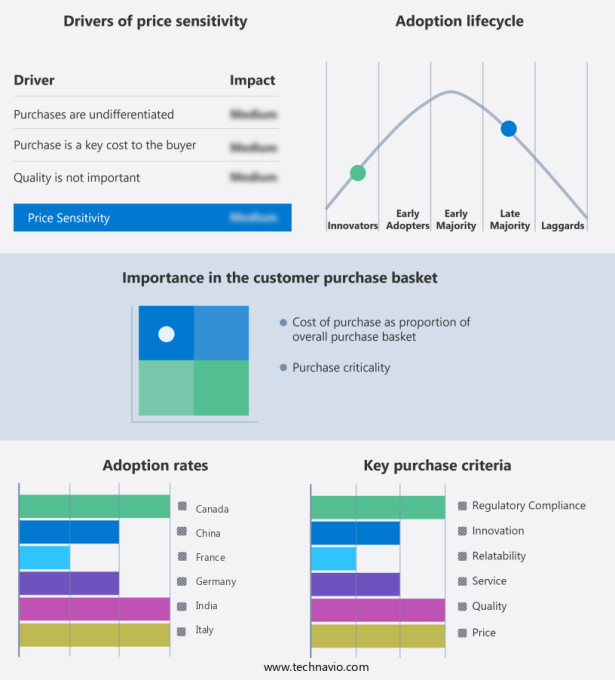
The market forecasting report includes the adoption lifecycle of the market, covering from the innovator's stage to the laggard's stage. It focuses on adoption rates in different regions based on penetration. Furthermore, the report also includes key purchase criteria and drivers of price sensitivity to help companies evaluate and develop their market growth analysis strategies.
Customer Landscape
Key Companies & Market Insights
Companies are implementing various strategies, such as strategic alliances, partnerships, mergers and acquisitions, geographical expansion, and product/service launches, to enhance their presence in the market.
ABB Ltd. - The company offers chart recorder such as C1300 circular chart recorder, C1900 circular chart recorder, C1950 pasteurizer recorder and others.
The market research and growth report includes detailed analyses of the competitive landscape of the market and information about key companies, including:
- BrainChild Electronic Co. Ltd.
- British Rototherm Group
- CHINO Works America Inc
- Cole Parmer Instrument Co. LLC
- Dickson Inc.
- Dwyer Instruments LLC
- Endress Hauser Group Services AG
- Future Design Controls Inc.
- Harvard Apparatus
- HIOKI E.E. Corp.
- Honeywell International Inc.
- JUMO India Pvt. Ltd.
- KOBOLD Instrumentatie BV
- Linseis Messgerate GmbH
- Monarch Instrument
- Omega Engineering Inc.
- Siemens AG
- Watlow Electric Manufacturing Co.
- Yokogawa Electric Corp.
Qualitative and quantitative analysis of companies has been conducted to help clients understand the wider business environment as well as the strengths and weaknesses of key market players. Data is qualitatively analyzed to categorize companies as pure play, category-focused, industry-focused, and diversified; it is quantitatively analyzed to categorize companies as dominant, leading, strong, tentative, and weak.
Research Analyst Overview
The market caters to the demand for instruments used in science and engineering labs for recording electrical and process signals. These instruments are essential for data acquisition (DAQ) in various industries, including power plants, water purification, and environmental testing. Chart recorders provide high-resolution measurement charts for temperature, pressure, flow, pH, humidity, vibration, movement, and other parameters. They offer visualization tools for statistical analysis and diagnostics. Suitable for single and multi-channel applications, chart recorders come in various forms such as strip chart recorders, circular chart recorders, data loggers, and digital recorders. They can record continuous analog records and support independent inputs with frequencies ranging from DC to several kHz.
Engineered for strongness, these instruments offer data display through colored graphs and permanent records on paper charts. The recording arm uses electrostatic or thermal means to ensure accurate data recording. Ultraviolet recorders employ photosensitive paper for recording data in specific applications. Analog-to-digital converters enable data conversion for digital file storage and retrieval. Chart recorders are widely used in various industries for equipment maintenance, power plant operations, and process control. They are also integral to marine installations, large engines, and dispersed systems. Their ability to provide real-time data and permanent records makes them indispensable tools for various applications.
|
Market Scope |
|
|
Report Coverage |
Details |
|
Page number |
206 |
|
Base year |
2023 |
|
Historic period |
2018-2022 |
|
Forecast period |
2024-2028 |
|
Growth momentum & CAGR |
Accelerate at a CAGR of 5.9% |
|
Market growth 2024-2028 |
USD 464.5 million |
|
Market structure |
Fragmented |
|
YoY growth 2023-2024(%) |
4.5 |
|
Regional analysis |
North America, APAC, Europe, South America, and Middle East and Africa |
|
Performing market contribution |
North America at 39% |
|
Key countries |
US, China, Canada, Germany, Japan, UK, India, France, Italy, and South Korea |
|
Competitive landscape |
Leading Companies, Market Positioning of Companies, Competitive Strategies, and Industry Risks |
|
Key companies profiled |
ABB Ltd., BrainChild Electronic Co. Ltd., British Rototherm Group, CHINO Works America Inc, Cole Parmer Instrument Co. LLC, Dickson Inc., Dwyer Instruments LLC, Endress Hauser Group Services AG, Future Design Controls Inc., Harvard Apparatus, HIOKI E.E. Corp., Honeywell International Inc., JUMO India Pvt. Ltd., KOBOLD Instrumentatie BV, Linseis Messgerate GmbH, Monarch Instrument, Omega Engineering Inc., Siemens AG, Watlow Electric Manufacturing Co., and Yokogawa Electric Corp. |
|
Market dynamics |
Parent market analysis, market growth inducers and obstacles, market forecast, fast-growing and slow-growing segment analysis, COVID-19 impact and recovery analysis and future consumer dynamics, market condition analysis for the forecast period |
|
Customization purview |
If our market report has not included the data that you are looking for, you can reach out to our analysts and get segments customized. |
What are the Key Data Covered in this Market Research and Growth Report?
- CAGR of the market during the forecast period
- Detailed information on factors that will drive the market growth and forecasting between 2024 and 2028
- Precise estimation of the size of the market and its contribution of the market in focus to the parent market
- Accurate predictions about upcoming market growth and trends and changes in consumer behaviour
- Growth of the market across North America, APAC, Europe, South America, and Middle East and Africa
- Thorough analysis of the market's competitive landscape and detailed information about companies
- Comprehensive analysis of factors that will challenge the growth of market companies
We can help! Our analysts can customize this market research report to meet your requirements. Get in touch


