Chemical Tanker Market Size 2025-2029
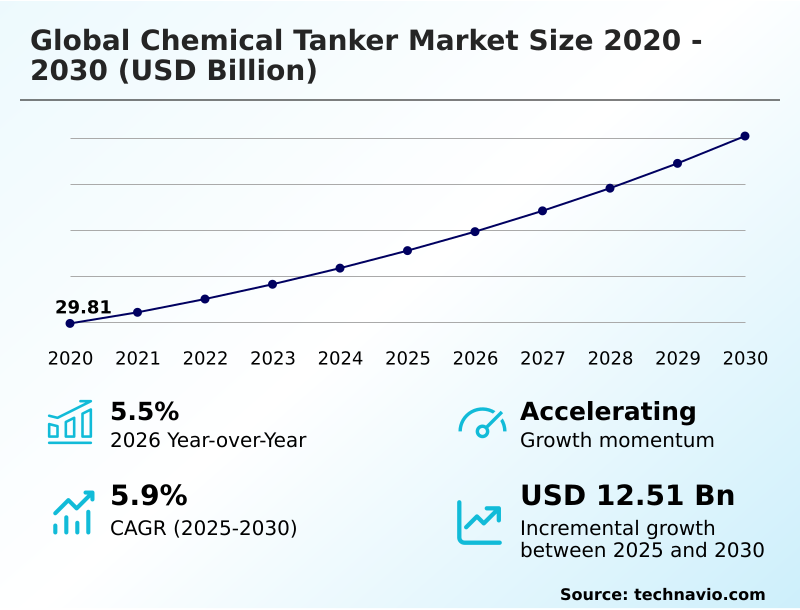
The chemical tanker market size is valued to increase USD 11.58 billion, at a CAGR of 5.8% from 2024 to 2029. Increase in LNG tanker transportation will drive the chemical tanker market.
Major Market Trends & Insights
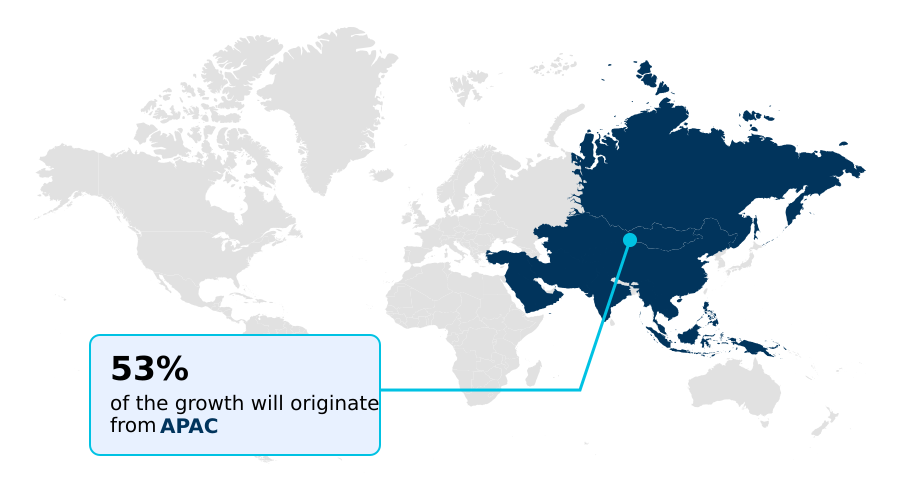
- APAC dominated the market and accounted for a 43% growth during the forecast period.
- By Product - Organic chemicals segment was valued at USD 12.22 billion in 2023
- By Type - Inland segment accounted for the largest market revenue share in 2023
Market Size & Forecast
- Market Opportunities: USD 63.98 million
- Market Future Opportunities: USD 11581.80 million
- CAGR from 2024 to 2029 : 5.8%
Market Summary
- The market experienced significant growth in recent years, with a reported value of over USD35 billion in 2020. This expansion can be attributed to the increasing demand for the transportation of chemicals, driven by the continuous growth of various industries, particularly in Asia Pacific. One of the key trends shaping the market is the advancement of propulsion systems, with many tankers transitioning to more fuel-efficient and environmentally friendly technologies. Despite this progress, the market faces challenges, such as the fluctuating Baltic Dry Index (BDI), which impacts freight rates and, consequently, the profitability of chemical tanker operators. Furthermore, stringent regulations regarding safety and environmental standards continue to evolve, requiring substantial investments in technology and infrastructure.
- In the future, the market is expected to remain dynamic, with a focus on innovation and sustainability. For instance, the development of next-generation tankers, such as those utilizing alternative fuels and advanced materials, could revolutionize the industry. Additionally, the integration of digital technologies, such as IoT and automation, is poised to enhance operational efficiency and reduce costs. In conclusion, the market is a critical component of the global logistics network, driven by the increasing demand for chemical transportation and the continuous advancement of technology. Despite challenges, such as the BDI and regulatory changes, the market is expected to remain dynamic, with a focus on innovation and sustainability.
What will be the Size of the Chemical Tanker Market during the forecast period?

Get Key Insights on Market Forecast (PDF) Request Free Sample
How is the Chemical Tanker Market Segmented ?
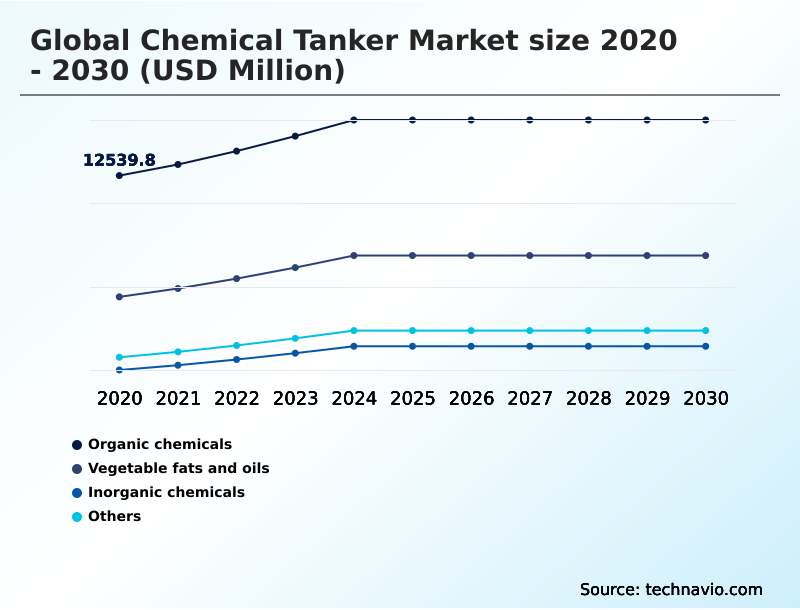
The chemical tanker industry research report provides comprehensive data (region-wise segment analysis), with forecasts and estimates in "USD million" for the period 2025-2029, as well as historical data from 2019-2023 for the following segments.
- Product
- Organic chemicals
- Vegetable fats and oils
- Inorganic chemicals
- Others
- Type
- Vessel Orientation
- Geography
- North America
- Europe
- France
- Germany
- Spain
- The Netherlands
- APAC
- Australia
- China
- India
- Japan
- South Korea
- Rest of World (ROW)
By Product Insights
The organic chemicals segment is estimated to witness significant growth during the forecast period.
The market is a dynamic and evolving sector, underpinned by the continuous demand for transporting a diverse range of chemicals. In 2024, the organic chemicals segment commanded the largest market share, driven by the burgeoning requirements for pharmaceuticals, fertilizers, pesticides, food and beverages, personal care products, cosmetics, polymers, water treatment, and other applications. Organic chemicals' widespread use in the food and beverages industry is attributed to their preservative and antioxidant properties. Moreover, the rapid expansion of shale gas production in China and North America has fueled organic chemicals' production growth. Advanced technologies, such as seaworthiness certification, cargo temperature control, and vessel tracking systems, are increasingly integrated into chemical tankers to ensure cargo integrity and safety.
Additionally, crew training programs, emergency response procedures, and vessel inspection protocols are essential components of hazardous material transport. Modern chemical tankers are equipped with pollution control technologies, including ballast water management, cargo tank cleaning, and electronic charting systems, to minimize environmental impact. Tanker fleet management relies on pressure relief valves, shipping lane optimization, cargo securing methods, and efficient pumping systems. Anti-corrosion techniques, gas detection systems, and tanker safety regulations are integral to maintaining vessel structural integrity and safety. With the increasing emphasis on maritime communication systems, tanker vessel stability, and inertial navigation systems, the market is poised for continued growth.
As per recent data, The market is projected to expand at a CAGR of 4.5% between 2021 and 2028.

Request Free Sample
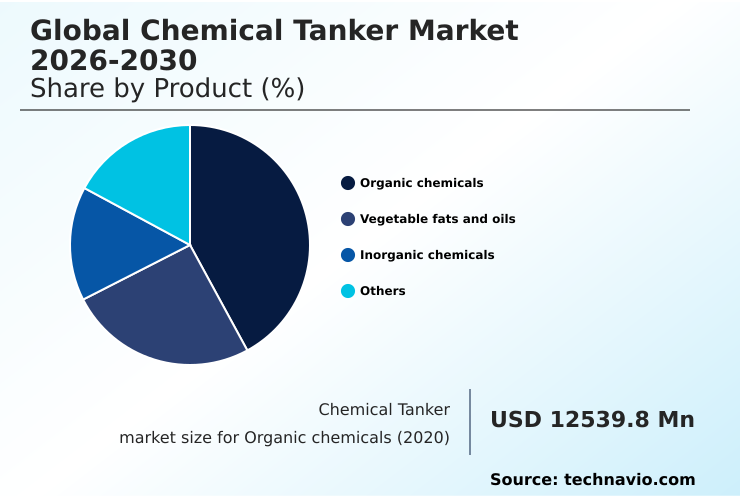
The Organic chemicals segment was valued at USD 12.22 billion in 2019 and showed a gradual increase during the forecast period.

Request Free Sample
Regional Analysis
APAC is estimated to contribute 43% to the growth of the global market during the forecast period.Technavio's analysts have elaborately explained the regional trends and drivers that shape the market during the forecast period.

See How Chemical Tanker Market Demand is Rising in APAC Request Free Sample
The market in Asia Pacific (APAC) is experiencing a steady expansion, underpinned by the increasing demand for various chemicals and petroleum products. According to recent market studies, APAC is projected to register a substantial growth rate during the forecast period. This growth can be attributed to the burgeoning demand for oil and gas, organic chemicals, vegetable fats and oils, and other chemicals in the region. The expanding urbanization and the rise of the middle-class income group have led to a surge in the demand for automobiles, thereby fueling the need for diesel, petrol, and gas.
Moreover, factors such as significant local production, extensive expansion plans in China, and the widespread presence of key chemical producers in the region are anticipated to further boost the market growth.
Market Dynamics
Our researchers analyzed the data with 2024 as the base year, along with the key drivers, trends, and challenges. A holistic analysis of drivers will help companies refine their marketing strategies to gain a competitive advantage.
The market is a critical sector in the global maritime industry, responsible for transporting a diverse range of chemicals and hazardous materials across the world's oceans. The effective and safe operation of chemical tankers is of paramount importance, with various regulations and techniques shaping the market landscape. Cargo tank cleaning techniques are essential for maintaining the integrity of chemical tankers, ensuring the next cargo load is transported safely. The impact of IMO regulations on tanker operations is significant, with new rules on cargo securing methods and ballast water management systems driving innovation. Optimization of tanker vessel routing algorithms is another key area of focus, with the aim of improving fuel efficiency and reducing operational costs.
Maritime communication system reliability is also crucial, as effective communication between vessels and shore-based teams is essential for responding to emergencies and ensuring the safety of crew and cargo. Analysis of chemical spill response effectiveness and evaluating various tanker hull cleaning methods are important aspects of maintaining the environmental sustainability of the market. The impact of ballast water management systems on tanker operations is also a significant consideration, with new regulations aimed at preventing the spread of invasive species. Assessing the effectiveness of emergency shutdown systems and implementing advanced tanker navigation systems are essential for enhancing safety management systems. Optimizing tanker fleet management strategies, measuring efficiency of various pumping systems, and analyzing tanker maintenance schedule optimization are all important areas of focus for reducing operational costs and improving overall performance. Tanker vessel structural integrity assessment methods and evaluating different cargo temperature control methods are critical for ensuring the safe and efficient transportation of chemicals. The implementation of advanced tanker navigation systems and optimization of tanker fleet management strategies are key trends driving growth in the market.

What are the key market drivers leading to the rise in the adoption of Chemical Tanker Industry?
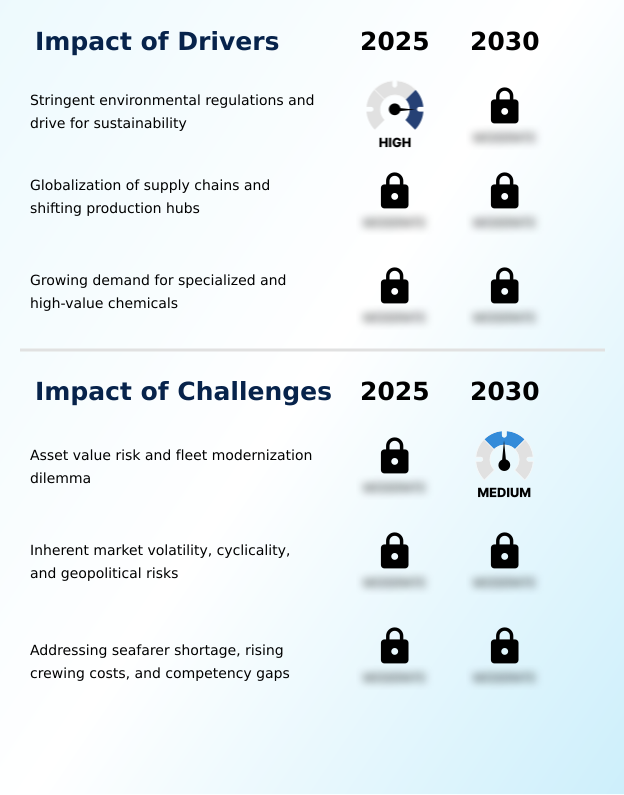
- The surge in LNG (Liquefied Natural Gas) tanker transportation plays a pivotal role in driving the market growth. With the increasing demand for cleaner energy sources and the expansion of global LNG trade, the need for reliable and efficient LNG tanker transportation has become essential, leading to a significant boost in market expansion.
- The market is experiencing a notable evolution, with liquefied natural gas (LNG) tankers playing a pivotal role in this transformation. The escalating global demand for LNG, fueled by the shift towards cleaner energy sources and the expansion of LNG infrastructure, has led to a substantial increase in the requirement for specialized tankers to transport these gases. LNG tankers are engineered to address the unique challenges of transporting liquefied gases, which necessitate cryogenic temperatures to remain in their liquid state.
- Technological advancements in LNG tanker design have significantly enhanced the efficiency and safety of these vessels, thereby influencing the broader chemical tankers market.
What are the market trends shaping the Chemical Tanker Industry?
- The advancements in tanker propulsion systems represent a significant market trend. This development signifies a notable progression in the maritime industry.
- Two-stroke diesel engines have become the preferred choice in marine propulsion, surpassing the usage of steam turbine engines due to their economic advantages. The maritime industry has witnessed significant technological advancements, resulting in the emergence of cross-compound double-reduction steam turbines. These steam turbines offer several benefits, including compact size and reduced space requirements in ship engine rooms. Additionally, steam turbines facilitate easy astern movement, generating up to half of the power output during reverse motion. The integration of controllable pitch propellers (CPP) in tanker ships allows for forward and astern propulsion without altering the engine's direction of rotation, further enhancing power generation.
- The adoption of these advanced technologies underscores the evolving nature of the market, catering to diverse sectors and optimizing operational efficiency.
What challenges does the Chemical Tanker Industry face during its growth?
- The Baltic Dry Index (BDI) fluctuations pose a significant challenge to the growth of the industry, as it is a key indicator reflecting the demand for major raw materials such as coal, iron ore, and grain, and thus impacts the profitability and investment decisions of shipping companies.
- The market, which transports crude oil, chemicals, and refined petroleum products, experiences fluctuations in the Baltic dry index, an economic indicator reflecting the demand-supply balance in sea-borne goods transportation via 23 global shipping routes. A high Baltic dry index signifies increased demand for tanker ships compared to their supply. However, the construction of new vessels is leading to an oversupply in the chemical tanker industry, posing challenges for companies and reducing shipping freight.
- This trend is evident in both dirty and clean tankers, as the tanker fleet size has grown significantly since 2008.
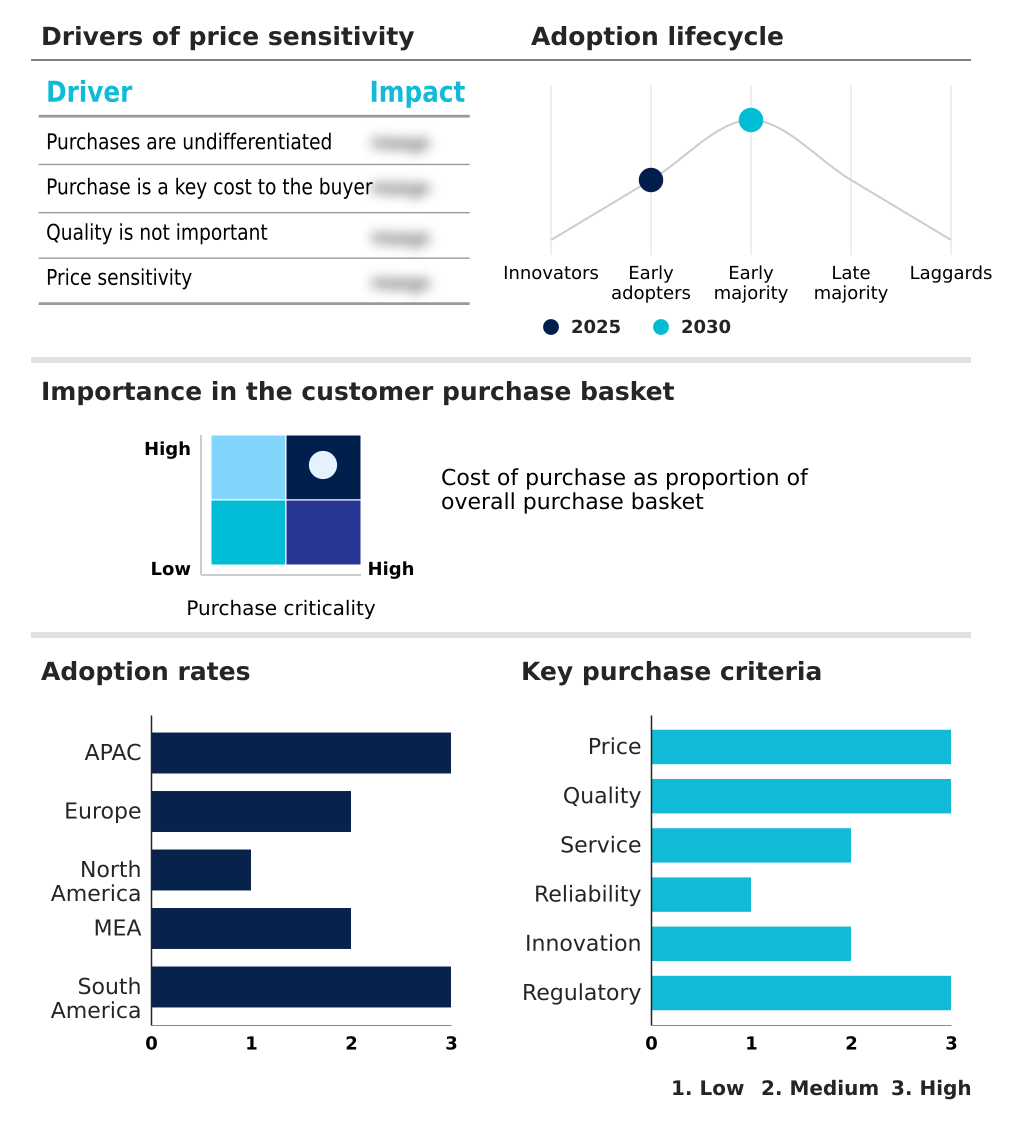
Exclusive Technavio Analysis on Customer Landscape
The chemical tanker market forecasting report includes the adoption lifecycle of the market, covering from the innovator's stage to the laggard's stage. It focuses on adoption rates in different regions based on penetration. Furthermore, the chemical tanker market report also includes key purchase criteria and drivers of price sensitivity to help companies evaluate and develop their market growth analysis strategies.

Customer Landscape of Chemical Tanker Industry
Competitive Landscape
Companies are implementing various strategies, such as strategic alliances, chemical tanker market forecast, partnerships, mergers and acquisitions, geographical expansion, and product/service launches, to enhance their presence in the industry.
AceTankers - This company specializes in providing advanced chemical tanker solutions for effective commercial asset management of various chemicals and vegetable oils. Their innovative offerings streamline logistics and optimize supply chain efficiency.
The industry research and growth report includes detailed analyses of the competitive landscape of the market and information about key companies, including:
- AceTankers
- Bahri
- HANSA TANKERS MANAGEMENT AS
- IINO Kaiun Kaisha Ltd.
- IMC Ship Management Pte Ltd.
- K Line Pte Ltd.
- KOYO KAIUN Co. Ltd.
- MOL CHEMICAL TANKERS PTE. LTD.
- M.T.M. Ship Management Pte Ltd.
- Navig8 Group
- Odfjell SE
- PT BERLIAN LAJU TANKER TBK
- Sinochem Group Co. Ltd.
- Stena Bulk
- Stolt Nielsen Ltd.
- Team Tankers International Ltd.
- UltraTank
- Wilmar International Ltd.
- Womar Pools Pte Ltd.
Qualitative and quantitative analysis of companies has been conducted to help clients understand the wider business environment as well as the strengths and weaknesses of key industry players. Data is qualitatively analyzed to categorize companies as pure play, category-focused, industry-focused, and diversified; it is quantitatively analyzed to categorize companies as dominant, leading, strong, tentative, and weak.
Recent Development and News in Chemical Tanker Market
- In January 2024, Mitsui O.S.K. Lines, Ltd. (MOL) and Kawasaki Kisen Kaisha, Ltd. (K-Line) announced a strategic partnership to jointly develop and operate large-scale chemical tankers with a capacity of over 50,000 dwt. This collaboration aimed to enhance their market presence and improve operational efficiency in the chemical tanker sector (MOL Press Release, 2024).
- In March 2024, the European Union (EU) approved the merger of Dutch chemical tanker companies Spliethoff Group and Tankerinvest B.V., creating the largest European chemical tanker operator, with a combined fleet of over 100 vessels (EU Commission Press Release, 2024).
- In April 2025, Teekay Corporation, a leading marine midstream services company, announced a strategic investment of USD200 million in the construction of new, state-of-the-art, medium-range chemical tankers. These vessels would be designed to meet the increasing demand for flexible, cost-effective, and environmentally friendly chemical transportation solutions (Teekay Corporation Press Release, 2025).
- In May 2025, the International Maritime Organization (IMO) approved new regulations to reduce sulfur emissions from shipping, effective January 1, 2026. This policy change would significantly impact the market, as it would require the retrofitting or replacement of older vessels with cleaner, more expensive alternatives (IMO Press Release, 2025).
Dive into Technavio's robust research methodology, blending expert interviews, extensive data synthesis, and validated models for unparalleled Chemical Tanker Market insights. See full methodology.
Market Scope
|
Report Coverage
|
Details
|
Page number
|
205
|
Base year
|
2024
|
Historic period
|
2019-2023 |
Forecast period
|
2025-2029
|
Growth momentum & CAGR
|
Accelerate at a CAGR of 5.8%
|
Market growth 2025-2029
|
USD 11581.8 million
|
Market structure
|
Fragmented
|
YoY growth 2024-2025(%)
|
5.3
|
Key countries
|
China, US, Germany, The Netherlands, India, Japan, France, South Korea, Australia, and Spain
|
Competitive landscape
|
Leading Companies, Market Positioning of Companies, Competitive Strategies, and Industry Risks
|
Request Free Sample
Research Analyst Overview
- The market continues to evolve, driven by the diverse demands of various sectors and the ongoing quest for efficiency, safety, and sustainability. Seaworthiness certification, a crucial aspect of tanker operations, ensures the vessels meet stringent safety standards. Cargo temperature control, achieved through advanced refrigeration systems, is essential for transporting sensitive chemicals. Liquid cargo handling relies on vessel tracking systems and AIS tracking technology, enabling real-time monitoring and optimization of shipping lanes. Crew training programs and emergency response procedures are vital for addressing unforeseen situations. Hazardous material transport necessitates robust vessel inspection protocols and the implementation of pollution control technologies.
- Tanker fleet management incorporates pressure relief valves, shipping lane optimization, and cargo securing methods to maintain vessel stability and structural integrity. Chemical tanker design focuses on pumping systems efficiency, hull cleaning methods, cargo tank cleaning, and electronic charting systems. Ballast water management and cargo tank coatings are essential for preventing oil spills and maintaining regulatory compliance. Double hull tankers, gas detection systems, and emergency shutdown systems are integral components of tanker safety regulations. IMO standards compliance, navigation equipment calibration, and cargo monitoring systems further enhance safety and efficiency. According to industry reports, The market is projected to grow by 3% annually, driven by increasing demand for chemical transportation and advancements in technology.
- For instance, a leading chemical company reported a 5% increase in sales due to the adoption of advanced cargo monitoring systems.
What are the Key Data Covered in this Chemical Tanker Market Research and Growth Report?
-
What is the expected growth of the Chemical Tanker Market between 2025 and 2029?
-
What segmentation does the market report cover?
-
The report is segmented by Product (Organic chemicals, Vegetable fats and oils, Inorganic chemicals, and Others), Type (Inland, Coastal, and Deep sea), Vessel Orientation (IMO 3, IMO 2, and IMO 1), and Geography (APAC, Europe, North America, Middle East and Africa, and South America)
-
Which regions are analyzed in the report?
-
APAC, Europe, North America, Middle East and Africa, and South America
-
What are the key growth drivers and market challenges?
-
Who are the major players in the Chemical Tanker Market?
-
AceTankers, Bahri, HANSA TANKERS MANAGEMENT AS, IINO Kaiun Kaisha Ltd., IMC Ship Management Pte Ltd., K Line Pte Ltd., KOYO KAIUN Co. Ltd., MOL CHEMICAL TANKERS PTE. LTD., M.T.M. Ship Management Pte Ltd., Navig8 Group, Odfjell SE, PT BERLIAN LAJU TANKER TBK, Sinochem Group Co. Ltd., Stena Bulk, Stolt Nielsen Ltd., Team Tankers International Ltd., UltraTank, Wilmar International Ltd., and Womar Pools Pte Ltd.
Market Research Insights
- The market is a dynamic and complex industry that requires constant adaptation to various market conditions and regulatory requirements. Two key aspects of this market are the increasing demand for chemical transportation and the industry's ongoing efforts to improve operational efficiency. According to industry reports, the global chemical tanker fleet is expected to grow by over 3% annually in the coming years, driven by the rising demand for chemicals in various sectors such as agriculture, pharmaceuticals, and manufacturing. For instance, the Asia-Pacific region is projected to account for over 40% of the global chemical tanker demand by 2025.
- Moreover, chemical tanker operators are focusing on optimizing their operations to reduce costs and improve safety. For example, advanced weather routing strategies help minimize fuel consumption and reduce emissions, while communication network reliability and crew fatigue management ensure safe and efficient vessel operations. Additionally, the implementation of maritime cybersecurity measures and navigation system accuracy enhance the overall safety and efficiency of tanker fleets.
We can help! Our analysts can customize this chemical tanker market research report to meet your requirements.
Get in touch
1 Executive Summary
- 1.1 Market overview
- Executive Summary - Chart on Market Overview
- Executive Summary - Data Table on Market Overview
- Executive Summary - Chart on Global Market Characteristics
- Executive Summary - Chart on Market by Geography
- Executive Summary - Chart on Market Segmentation by Product
- Executive Summary - Chart on Market Segmentation by Type
- Executive Summary - Chart on Market Segmentation by Vessel Orientation
- Executive Summary - Chart on Incremental Growth
- Executive Summary - Data Table on Incremental Growth
- Executive Summary - Chart on Company Market Positioning
2 Technavio Analysis
- 2.1 Analysis of price sensitivity, lifecycle, customer purchase basket, adoption rates, and purchase criteria
- Analysis of price sensitivity, lifecycle, customer purchase basket, adoption rates, and purchase criteria
- 2.2 Criticality of inputs and Factors of differentiation
- Overview on criticality of inputs and factors of differentiation
- 2.3 Factors of disruption
- Overview on factors of disruption
- 2.4 Impact of drivers and challenges
- Impact of drivers and challenges in 2024 and 2029
3 Market Landscape
- 3.1 Market ecosystem
- Parent Market
- Data Table on - Parent Market
- 3.2 Market characteristics
- Market characteristics analysis
4 Market Sizing
- 4.1 Market definition
- Offerings of companies included in the market definition
- 4.2 Market segment analysis
- 4.4 Market outlook: Forecast for 2024-2029
- Chart on Global - Market size and forecast 2024-2029 ($ million)
- Data Table on Global - Market size and forecast 2024-2029 ($ million)
- Chart on Global Market: Year-over-year growth 2024-2029 (%)
- Data Table on Global Market: Year-over-year growth 2024-2029 (%)
5 Historic Market Size
- 5.1 Global Chemical Tanker Market 2019 - 2023
- Historic Market Size - Data Table on Global Chemical Tanker Market 2019 - 2023 ($ million)
- 5.2 Product segment analysis 2019 - 2023
- Historic Market Size - Product Segment 2019 - 2023 ($ million)
- 5.3 Type segment analysis 2019 - 2023
- Historic Market Size - Type Segment 2019 - 2023 ($ million)
- 5.4 Vessel Orientation segment analysis 2019 - 2023
- Historic Market Size - Vessel Orientation Segment 2019 - 2023 ($ million)
- 5.5 Geography segment analysis 2019 - 2023
- Historic Market Size - Geography Segment 2019 - 2023 ($ million)
- 5.6 Country segment analysis 2019 - 2023
- Historic Market Size - Country Segment 2019 - 2023 ($ million)
6 Qualitative Analysis
- 6.1 Impact of AI in the Global Chemical Tanker Market
7 Five Forces Analysis
- 7.1 Five forces summary
- Five forces analysis - Comparison between 2024 and 2029
- 7.2 Bargaining power of buyers
- Bargaining power of buyers - Impact of key factors 2024 and 2029
- 7.3 Bargaining power of suppliers
- Bargaining power of suppliers - Impact of key factors in 2024 and 2029
- 7.4 Threat of new entrants
- Threat of new entrants - Impact of key factors in 2024 and 2029
- 7.5 Threat of substitutes
- Threat of substitutes - Impact of key factors in 2024 and 2029
- 7.6 Threat of rivalry
- Threat of rivalry - Impact of key factors in 2024 and 2029
- 7.7 Market condition
- Chart on Market condition - Five forces 2024 and 2029
8 Market Segmentation by Product
- 8.1 Market segments
- Chart on Product - Market share 2024-2029 (%)
- Data Table on Product - Market share 2024-2029 (%)
- 8.2 Comparison by Product
- Chart on Comparison by Product
- Data Table on Comparison by Product
- 8.3 Organic chemicals - Market size and forecast 2024-2029
- Chart on Organic chemicals - Market size and forecast 2024-2029 ($ million)
- Data Table on Organic chemicals - Market size and forecast 2024-2029 ($ million)
- Chart on Organic chemicals - Year-over-year growth 2024-2029 (%)
- Data Table on Organic chemicals - Year-over-year growth 2024-2029 (%)
- 8.4 Vegetable fats and oils - Market size and forecast 2024-2029
- Chart on Vegetable fats and oils - Market size and forecast 2024-2029 ($ million)
- Data Table on Vegetable fats and oils - Market size and forecast 2024-2029 ($ million)
- Chart on Vegetable fats and oils - Year-over-year growth 2024-2029 (%)
- Data Table on Vegetable fats and oils - Year-over-year growth 2024-2029 (%)
- 8.5 Inorganic chemicals - Market size and forecast 2024-2029
- Chart on Inorganic chemicals - Market size and forecast 2024-2029 ($ million)
- Data Table on Inorganic chemicals - Market size and forecast 2024-2029 ($ million)
- Chart on Inorganic chemicals - Year-over-year growth 2024-2029 (%)
- Data Table on Inorganic chemicals - Year-over-year growth 2024-2029 (%)
- 8.6 Others - Market size and forecast 2024-2029
- Chart on Others - Market size and forecast 2024-2029 ($ million)
- Data Table on Others - Market size and forecast 2024-2029 ($ million)
- Chart on Others - Year-over-year growth 2024-2029 (%)
- Data Table on Others - Year-over-year growth 2024-2029 (%)
- 8.7 Market opportunity by Product
- Market opportunity by Product ($ million)
- Data Table on Market opportunity by Product ($ million)
9 Market Segmentation by Type
- 9.1 Market segments
- Chart on Type - Market share 2024-2029 (%)
- Data Table on Type - Market share 2024-2029 (%)
- 9.2 Comparison by Type
- Chart on Comparison by Type
- Data Table on Comparison by Type
- 9.3 Inland - Market size and forecast 2024-2029
- Chart on Inland - Market size and forecast 2024-2029 ($ million)
- Data Table on Inland - Market size and forecast 2024-2029 ($ million)
- Chart on Inland - Year-over-year growth 2024-2029 (%)
- Data Table on Inland - Year-over-year growth 2024-2029 (%)
- 9.4 Coastal - Market size and forecast 2024-2029
- Chart on Coastal - Market size and forecast 2024-2029 ($ million)
- Data Table on Coastal - Market size and forecast 2024-2029 ($ million)
- Chart on Coastal - Year-over-year growth 2024-2029 (%)
- Data Table on Coastal - Year-over-year growth 2024-2029 (%)
- 9.5 Deep sea - Market size and forecast 2024-2029
- Chart on Deep sea - Market size and forecast 2024-2029 ($ million)
- Data Table on Deep sea - Market size and forecast 2024-2029 ($ million)
- Chart on Deep sea - Year-over-year growth 2024-2029 (%)
- Data Table on Deep sea - Year-over-year growth 2024-2029 (%)
- 9.6 Market opportunity by Type
- Market opportunity by Type ($ million)
- Data Table on Market opportunity by Type ($ million)
10 Market Segmentation by Vessel Orientation
- 10.1 Market segments
- Chart on Market Segmentation by Vessel Orientation - Market share 2024-2029 (%)
- Data Table on Market Segmentation by Vessel Orientation - Market share 2024-2029 (%)
- 10.2 Comparison by Market Segmentation by Vessel Orientation
- Chart on Comparison by Market Segmentation by Vessel Orientation
- Data Table on Comparison by Market Segmentation by Vessel Orientation
- 10.3 IMO 3 - Market size and forecast 2024-2029
- Chart on IMO 3 - Market size and forecast 2024-2029 ($ million)
- Data Table on IMO 3 - Market size and forecast 2024-2029 ($ million)
- Chart on IMO 3 - Year-over-year growth 2024-2029 (%)
- Data Table on IMO 3 - Year-over-year growth 2024-2029 (%)
- 10.4 IMO 2 - Market size and forecast 2024-2029
- Chart on IMO 2 - Market size and forecast 2024-2029 ($ million)
- Data Table on IMO 2 - Market size and forecast 2024-2029 ($ million)
- Chart on IMO 2 - Year-over-year growth 2024-2029 (%)
- Data Table on IMO 2 - Year-over-year growth 2024-2029 (%)
- 10.5 IMO 1 - Market size and forecast 2024-2029
- Chart on IMO 1 - Market size and forecast 2024-2029 ($ million)
- Data Table on IMO 1 - Market size and forecast 2024-2029 ($ million)
- Chart on IMO 1 - Year-over-year growth 2024-2029 (%)
- Data Table on IMO 1 - Year-over-year growth 2024-2029 (%)
- 10.6 Market opportunity by Market Segmentation by Vessel Orientation
- Market opportunity by Market Segmentation by Vessel Orientation ($ million)
- Data Table on Market opportunity by Market Segmentation by Vessel Orientation ($ million)
11 Customer Landscape
- 11.1 Customer landscape overview
- Analysis of price sensitivity, lifecycle, customer purchase basket, adoption rates, and purchase criteria
12 Geographic Landscape
- 12.1 Geographic segmentation
- Chart on Market share by geography 2024-2029 (%)
- Data Table on Market share by geography 2024-2029 (%)
- 12.2 Geographic comparison
- Chart on Geographic comparison
- Data Table on Geographic comparison
- 12.3 APAC - Market size and forecast 2024-2029
- Chart on APAC - Market size and forecast 2024-2029 ($ million)
- Data Table on APAC - Market size and forecast 2024-2029 ($ million)
- Chart on APAC - Year-over-year growth 2024-2029 (%)
- Data Table on APAC - Year-over-year growth 2024-2029 (%)
- 12.4 Europe - Market size and forecast 2024-2029
- Chart on Europe - Market size and forecast 2024-2029 ($ million)
- Data Table on Europe - Market size and forecast 2024-2029 ($ million)
- Chart on Europe - Year-over-year growth 2024-2029 (%)
- Data Table on Europe - Year-over-year growth 2024-2029 (%)
- 12.5 North America - Market size and forecast 2024-2029
- Chart on North America - Market size and forecast 2024-2029 ($ million)
- Data Table on North America - Market size and forecast 2024-2029 ($ million)
- Chart on North America - Year-over-year growth 2024-2029 (%)
- Data Table on North America - Year-over-year growth 2024-2029 (%)
- 12.6 Middle East and Africa - Market size and forecast 2024-2029
- Chart on Middle East and Africa - Market size and forecast 2024-2029 ($ million)
- Data Table on Middle East and Africa - Market size and forecast 2024-2029 ($ million)
- Chart on Middle East and Africa - Year-over-year growth 2024-2029 (%)
- Data Table on Middle East and Africa - Year-over-year growth 2024-2029 (%)
- 12.7 South America - Market size and forecast 2024-2029
- Chart on South America - Market size and forecast 2024-2029 ($ million)
- Data Table on South America - Market size and forecast 2024-2029 ($ million)
- Chart on South America - Year-over-year growth 2024-2029 (%)
- Data Table on South America - Year-over-year growth 2024-2029 (%)
- 12.8 China - Market size and forecast 2024-2029
- Chart on China - Market size and forecast 2024-2029 ($ million)
- Data Table on China - Market size and forecast 2024-2029 ($ million)
- Chart on China - Year-over-year growth 2024-2029 (%)
- Data Table on China - Year-over-year growth 2024-2029 (%)
- 12.9 US - Market size and forecast 2024-2029
- Chart on US - Market size and forecast 2024-2029 ($ million)
- Data Table on US - Market size and forecast 2024-2029 ($ million)
- Chart on US - Year-over-year growth 2024-2029 (%)
- Data Table on US - Year-over-year growth 2024-2029 (%)
- 12.10 Germany - Market size and forecast 2024-2029
- Chart on Germany - Market size and forecast 2024-2029 ($ million)
- Data Table on Germany - Market size and forecast 2024-2029 ($ million)
- Chart on Germany - Year-over-year growth 2024-2029 (%)
- Data Table on Germany - Year-over-year growth 2024-2029 (%)
- 12.11 India - Market size and forecast 2024-2029
- Chart on India - Market size and forecast 2024-2029 ($ million)
- Data Table on India - Market size and forecast 2024-2029 ($ million)
- Chart on India - Year-over-year growth 2024-2029 (%)
- Data Table on India - Year-over-year growth 2024-2029 (%)
- 12.12 The Netherlands - Market size and forecast 2024-2029
- Chart on The Netherlands - Market size and forecast 2024-2029 ($ million)
- Data Table on The Netherlands - Market size and forecast 2024-2029 ($ million)
- Chart on The Netherlands - Year-over-year growth 2024-2029 (%)
- Data Table on The Netherlands - Year-over-year growth 2024-2029 (%)
- 12.13 Japan - Market size and forecast 2024-2029
- Chart on Japan - Market size and forecast 2024-2029 ($ million)
- Data Table on Japan - Market size and forecast 2024-2029 ($ million)
- Chart on Japan - Year-over-year growth 2024-2029 (%)
- Data Table on Japan - Year-over-year growth 2024-2029 (%)
- 12.14 France - Market size and forecast 2024-2029
- Chart on France - Market size and forecast 2024-2029 ($ million)
- Data Table on France - Market size and forecast 2024-2029 ($ million)
- Chart on France - Year-over-year growth 2024-2029 (%)
- Data Table on France - Year-over-year growth 2024-2029 (%)
- 12.15 South Korea - Market size and forecast 2024-2029
- Chart on South Korea - Market size and forecast 2024-2029 ($ million)
- Data Table on South Korea - Market size and forecast 2024-2029 ($ million)
- Chart on South Korea - Year-over-year growth 2024-2029 (%)
- Data Table on South Korea - Year-over-year growth 2024-2029 (%)
- 12.16 Australia - Market size and forecast 2024-2029
- Chart on Australia - Market size and forecast 2024-2029 ($ million)
- Data Table on Australia - Market size and forecast 2024-2029 ($ million)
- Chart on Australia - Year-over-year growth 2024-2029 (%)
- Data Table on Australia - Year-over-year growth 2024-2029 (%)
- 12.17 Spain - Market size and forecast 2024-2029
- Chart on Spain - Market size and forecast 2024-2029 ($ million)
- Data Table on Spain - Market size and forecast 2024-2029 ($ million)
- Chart on Spain - Year-over-year growth 2024-2029 (%)
- Data Table on Spain - Year-over-year growth 2024-2029 (%)
- 12.18 Market opportunity by geography
- Market opportunity by geography ($ million)
- Data Tables on Market opportunity by geography ($ million)
13 Drivers, Challenges, and Opportunity/Restraints
- 13.3 Impact of drivers and challenges
- Impact of drivers and challenges in 2024 and 2029
- 13.4 Market opportunities/restraints
14 Competitive Landscape
- 14.2 Competitive Landscape
- Overview on criticality of inputs and factors of differentiation
- 14.3 Landscape disruption
- Overview on factors of disruption
- 14.4 Industry risks
- Impact of key risks on business
15 Competitive Analysis
- 15.2 Company ranking index
- 15.3 Market positioning of companies
- Matrix on companies position and classification
- 15.4 AceTankers
- AceTankers - Overview
- AceTankers - Product / Service
- AceTankers - Key offerings
- SWOT
- 15.5 Bahri
- Bahri - Overview
- Bahri - Business segments
- Bahri - Key offerings
- Bahri - Segment focus
- SWOT
- 15.6 HANSA TANKERS MANAGEMENT AS
- HANSA TANKERS MANAGEMENT AS - Overview
- HANSA TANKERS MANAGEMENT AS - Product / Service
- HANSA TANKERS MANAGEMENT AS - Key offerings
- SWOT
- 15.7 IINO Kaiun Kaisha Ltd.
- IINO Kaiun Kaisha Ltd. - Overview
- IINO Kaiun Kaisha Ltd. - Product / Service
- IINO Kaiun Kaisha Ltd. - Key offerings
- SWOT
- 15.8 IMC Ship Management Pte Ltd.
- IMC Ship Management Pte Ltd. - Overview
- IMC Ship Management Pte Ltd. - Product / Service
- IMC Ship Management Pte Ltd. - Key offerings
- SWOT
- 15.9 KOYO KAIUN Co. Ltd.
- KOYO KAIUN Co. Ltd. - Overview
- KOYO KAIUN Co. Ltd. - Product / Service
- KOYO KAIUN Co. Ltd. - Key offerings
- SWOT
- 15.10 MOL CHEMICAL TANKERS PTE. LTD.
- MOL CHEMICAL TANKERS PTE. LTD. - Overview
- MOL CHEMICAL TANKERS PTE. LTD. - Product / Service
- MOL CHEMICAL TANKERS PTE. LTD. - Key offerings
- SWOT
- 15.11 M.T.M. Ship Management Pte Ltd.
- M.T.M. Ship Management Pte Ltd. - Overview
- M.T.M. Ship Management Pte Ltd. - Product / Service
- M.T.M. Ship Management Pte Ltd. - Key offerings
- SWOT
- 15.12 Navig8 Group
- Navig8 Group - Overview
- Navig8 Group - Product / Service
- Navig8 Group - Key offerings
- SWOT
- 15.13 Odfjell SE
- Odfjell SE - Overview
- Odfjell SE - Product / Service
- Odfjell SE - Key news
- Odfjell SE - Key offerings
- SWOT
- 15.14 Sinochem Group Co. Ltd.
- Sinochem Group Co. Ltd. - Overview
- Sinochem Group Co. Ltd. - Product / Service
- Sinochem Group Co. Ltd. - Key offerings
- SWOT
- 15.15 Stolt Nielsen Ltd.
- Stolt Nielsen Ltd. - Overview
- Stolt Nielsen Ltd. - Business segments
- Stolt Nielsen Ltd. - Key offerings
- Stolt Nielsen Ltd. - Segment focus
- SWOT
- 15.16 Team Tankers International Ltd.
- Team Tankers International Ltd. - Overview
- Team Tankers International Ltd. - Product / Service
- Team Tankers International Ltd. - Key offerings
- SWOT
- 15.17 UltraTank
- UltraTank - Overview
- UltraTank - Product / Service
- UltraTank - Key offerings
- SWOT
- 15.18 Womar Pools Pte Ltd.
- Womar Pools Pte Ltd. - Overview
- Womar Pools Pte Ltd. - Product / Service
- Womar Pools Pte Ltd. - Key offerings
- SWOT
16 Appendix
- 16.2 Inclusions and exclusions checklist
- Inclusions checklist
- Exclusions checklist
- 16.3 Currency conversion rates for US$
- Currency conversion rates for US$
- 16.4 Research methodology
- 16.7 Validation techniques employed for market sizing
- Validation techniques employed for market sizing
- 16.9 360 degree market analysis
- 360 degree market analysis
- 16.10 List of abbreviations