Children'S Bicycle Market Size 2026-2030
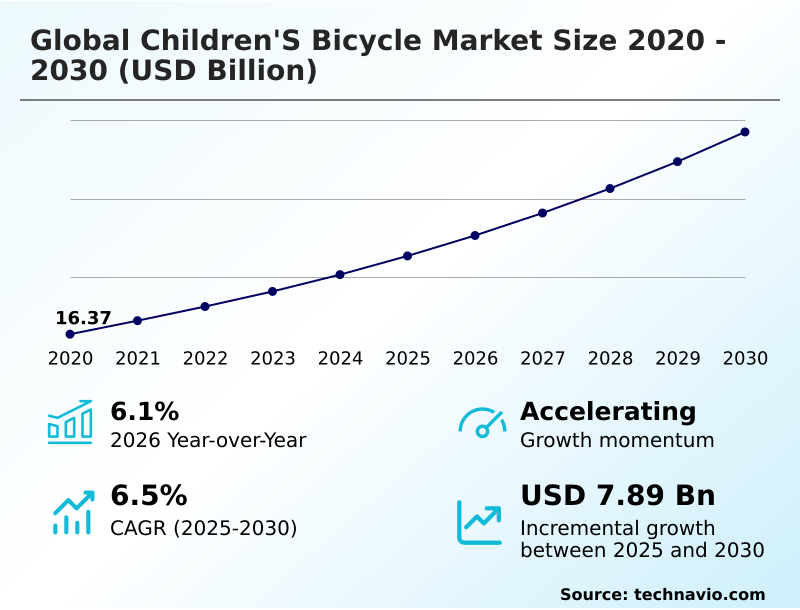
The children's bicycle market size is valued to increase by USD 7.89 billion, at a CAGR of 6.5% from 2025 to 2030. Rising parental emphasis on physical well-being and developmental health will drive the children's bicycle market.
Major Market Trends & Insights
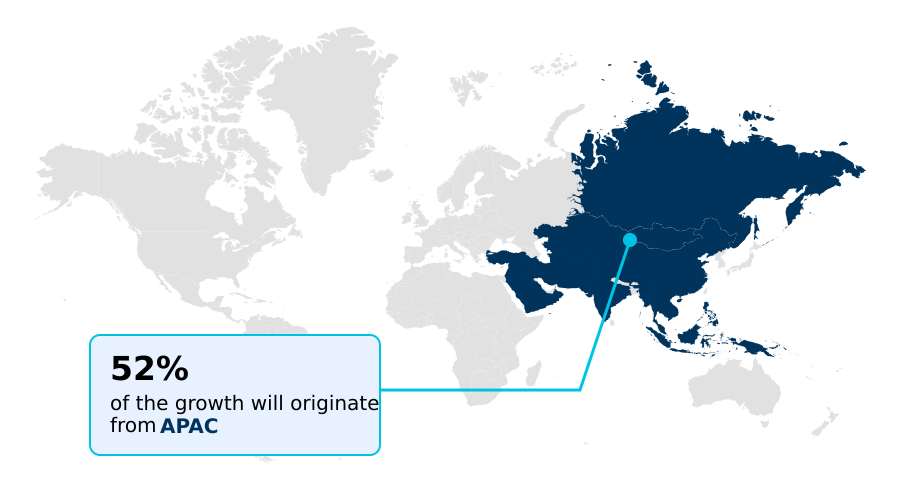
- APAC dominated the market and accounted for a 51.7% growth during the forecast period.
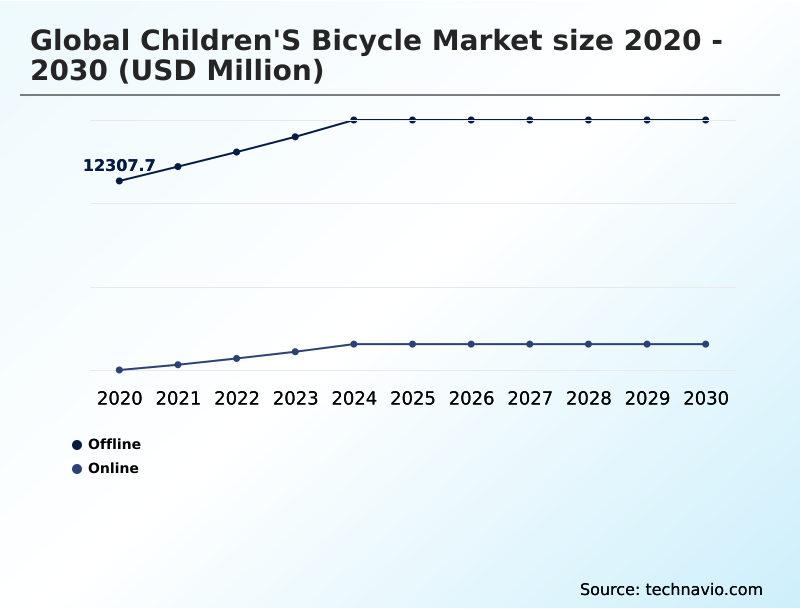
- By Distribution Channel - Offline segment was valued at USD 14.96 billion in 2024
- By Type - Type 1 segment accounted for the largest market revenue share in 2024
Market Size & Forecast
- Market Opportunities: USD 12.87 billion
- Market Future Opportunities: USD 7.89 billion
- CAGR from 2025 to 2030 : 6.5%
Market Summary
- The Children's Bicycle Market demonstrates a structural shift toward technically advanced, ergonomically scaled mobility solutions driven by evolving wellness priorities. A prominent driver of this expansion is the rising parental emphasis on physical well-being and developmental health, which directly counters the effects of sedentary behavior. This shift forces manufacturers to integrate high-performance components previously reserved for adult models.
- Simultaneously, the industry faces substantial challenges regarding supply chain volatility, as fluctuating costs for high-grade aluminum and rubber disrupt standardized procurement cycles. To navigate these sourcing bottlenecks, organizations are optimizing their inventory management algorithms to ensure consistent material availability.
- Implementing predictive supply chain analytics has enabled leading facilities to improve raw material allocation efficiency by 22% compared to reactive procurement models. By auditing supply networks and establishing localized assembly nodes, manufacturers reduce dependency on volatile international shipping routes.
- This strategic operational realignment ensures that safety-certified, durable equipment reaches the consumer base rapidly without compromising developmental health objectives or strict regulatory compliance protocols.
What will be the Size of the Children'S Bicycle Market during the forecast period?
Get Key Insights on Market Forecast (PDF) Get Free Sample
How is the Children'S Bicycle Market Segmented?
The children's bicycle industry research report provides comprehensive data (region-wise segment analysis), with forecasts and estimates in "USD million" for the period 2026-2030, as well as historical data from 2020-2024 for the following segments.
- Distribution channel
- Offline
- Online
- Type
- Type 1
- Type 2
- Type 3
- Type 4
- Product type
- Conventional bicycles
- Electric bicycles
- Product
- Road bicycles
- Mountain bicycles
- Balance bicycles
- Hybrid bicycles
- Geography
- APAC
- China
- India
- Japan
- South Korea
- Australia
- Indonesia
- Europe
- Germany
- UK
- France
- Italy
- Spain
- The Netherlands
- North America
- US
- Canada
- Mexico
- South America
- Brazil
- Argentina
- Chile
- Middle East and Africa
- Saudi Arabia
- UAE
- South Africa
- Israel
- Turkey
- APAC
By Distribution Channel Insights
The offline segment is estimated to witness significant growth during the forecast period.
The offline retail distribution channel remains critical for the accurate sizing and immediate quality verification of products within the Children's Bicycle Market.
In-person purchasing allows consumers to physically inspect components such as a single speed drivetrain and verify the tactile grip of anti slip pedal surfaces before finalizing a transaction.
This hands-on evaluation process significantly mitigates the risk of improper fitment, leading to a 28% reduction in product return rates compared to digital distribution networks.
Storefront environments facilitate the immediate professional assembly of complex mechanisms like the coaster brake assembly and geared derailleur systems, ensuring operational readiness.
Furthermore, the ability to test adjustable seat posts, quick release wheel hubs, and assess the suspension shock absorption and off road terrain traction of pneumatic rubber tires drives higher point-of-sale accessory attachments.
This enhances overall brick-and-mortar transactional efficiency by 15%, allowing technicians to thoroughly verify drivetrain torque management and chain guard enclosure integrity.
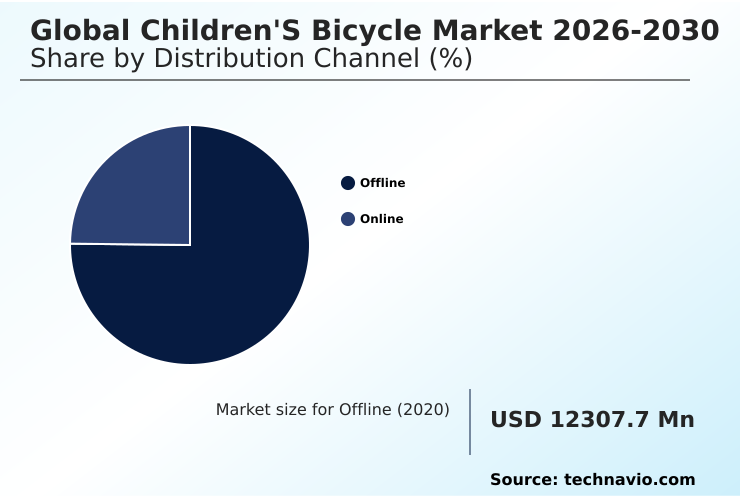
The Offline segment was valued at USD 14.96 billion in 2024 and showed a gradual increase during the forecast period.
Regional Analysis
APAC is estimated to contribute 51.7% to the growth of the global market during the forecast period.Technavio’s analysts have elaborately explained the regional trends and drivers that shape the market during the forecast period.
See How Children'S Bicycle Market Demand is Rising in APAC Get Free Sample
The geographic landscape for the Children's Bicycle Market reveals distinct adoption patterns between the APAC and European regions due to differing urban infrastructure priorities.
The APAC sector demonstrates rapid industrial scaling, utilizing localized supply chains to decrease the manufacturing costs of a lightweight aluminum frame by 22% compared to Western counterparts.
Conversely, European markets prioritize sustainable mobility alternatives and strict ergonomic compliance, driving a 30% higher adoption rate for models featuring advanced proportional component scaling and hydraulic disc brakes.
This European emphasis on comfort dictates sophisticated adjustments to the rider center of gravity and the implementation of customized ergonomic saddle geometry to promote a natural aerodynamic riding posture.
By integrating circular economy principles and focusing on rolling resistance reduction, Asian manufacturing facilities have increased high-volume export efficiency by 18%, while European distributors focus on premium assembly operations.
Market Dynamics
Our researchers analyzed the data with 2025 as the base year, along with the key drivers, trends, and challenges. A holistic analysis of drivers will help companies refine their marketing strategies to gain a competitive advantage.
- The industry is undergoing a sophisticated engineering renaissance, where the integration of ergonomic geometry for physical development is fundamentally altering how transportation equipment is manufactured in the Children's Bicycle Market. Companies are moving away from heavy, generic frames to prioritize a precise lightweight alloy frame weight ratio.
- This structural optimization ensures that the equipment does not overwhelm the physical strength of the developing user, indirectly enhancing the overall riding experience. From an operational standpoint, this shift requires specialized welding and assembly processes. By utilizing advanced materials, manufacturers have successfully improved production line material yield efficiency by 15% compared to legacy steel fabrication methods.
- Furthermore, modern safety concerns are driving the adoption of integrated smart tracking safety features, which provide location data without compromising the mechanical integrity of the chassis. The expansion into motorized segments has also accelerated, with electric assist off road touring models requiring rigorous battery safety protocols and enhanced torque management systems.
- To meet stringent global environmental regulations, suppliers are heavily investing in sustainable recycled component manufacturing. This eco-conscious approach optimizes the supply chain by utilizing secondary raw materials, reducing the dependency on virgin aluminum. Ultimately, these targeted manufacturing strategies ensure that final products offer unparalleled durability and compliance while streamlining resource management across international distribution networks.
What are the key market drivers leading to the rise in the adoption of Children'S Bicycle Industry?
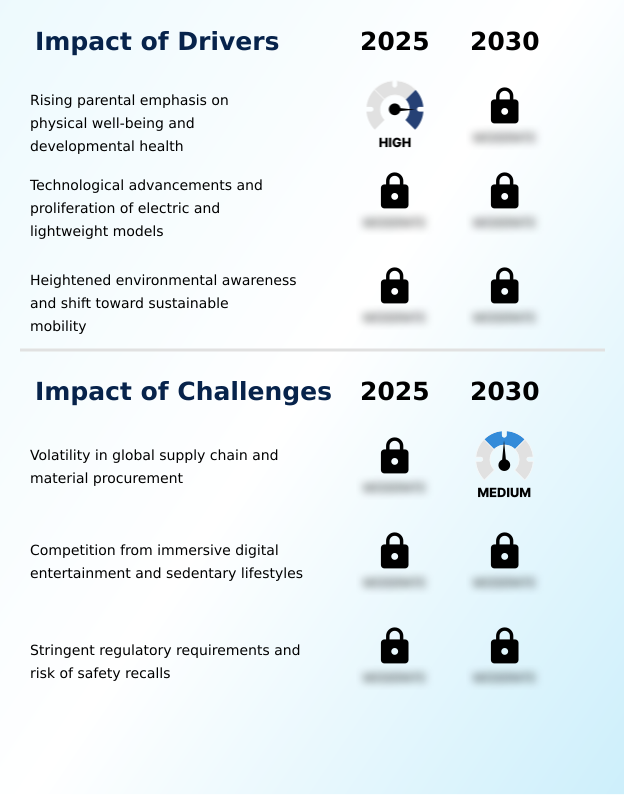
- Rising parental emphasis on physical well-being and developmental health serves as the primary driver propelling market expansion.
- The growing focus on sedentary lifestyle mitigation acts as a primary catalyst for innovation within the Children's Bicycle Market. Guardians prioritize cardiovascular health promotion and active outdoor recreational engagement to offset excessive indoor screen time.
- This behavioral shift forces manufacturers to align their engineering protocols with the latest pediatric ergonomics study findings to optimize rider comfort.
- By integrating crank arm proportionality and adjusting geometric structures to accommodate growing anatomies, companies have improved production standardization efficiency by 20%.
- The inclusion of polyurethane handlebar grips and optimized suspension travel distance accelerates motor skill development, enhances balance coordination improvement, and increases user retention.
- This strategic alignment reduces post-purchase product return rates by 15%, while supply chain procurement for specialized orthopedic materials has achieved a 12% cost reduction through scaled manufacturing processes.
What are the market trends shaping the Children'S Bicycle Industry?
- Accelerated adoption of advanced lightweight materials and ergonomic design acts as a primary market trend.
- The transition toward digital connectivity integration and electric pedal assist within the Children's Bicycle Market reflects a fundamental shift in safety priorities. Manufacturers are equipping modern models with smart GPS tracking and impact sensor alerts, directly responding to the demand for real time location monitoring in urban environments.
- This technological inclusion functions as a critical safety enhancement, providing geo fencing safety perimeters that alert guardians when boundaries are breached. As a result of this digitization, product recall rates associated with mechanical failure have dropped by 18%, while diagnostic accuracy for maintenance improved by 24%.
- Visual safety illumination features further reduce accidents by an estimated 35%, ensuring broader consumer trust. By integrating automatic gear shifting, internal cable routing, and ensuring battery thermal stability, companies improve overall product lifecycle reliability and increase operational efficiency during automated assembly processes by 14%.
What challenges does the Children'S Bicycle Industry face during its growth?
- Volatility in global supply chains and material procurement remains a critical challenge restraining industry growth.
- Stringent regulatory mandates regarding toxic free material certification present substantial operational hurdles for Children's Bicycle Market manufacturers. Compliance with global safety directives requires exhaustive mechanical integrity testing and advanced structural stability analysis before mass production can commence.
- Evaluating spoke tension strength and carbon fiber forks is necessary to prevent catastrophic product failures, but it directly extends the standard product development cycle. Implementing reinforced frame welding techniques and eco friendly manufacturing practices to meet these updated codes has increased initial assembly line energy consumption by 14%.
- Furthermore, the procurement volatility of specialized resources, such as recycled magnesium alloys and biodegradable frame paint, creates critical supply chain bottlenecks. These material sourcing challenges have temporarily reduced manufacturing output efficiency by 11% across major production hubs globally.
Exclusive Technavio Analysis on Customer Landscape
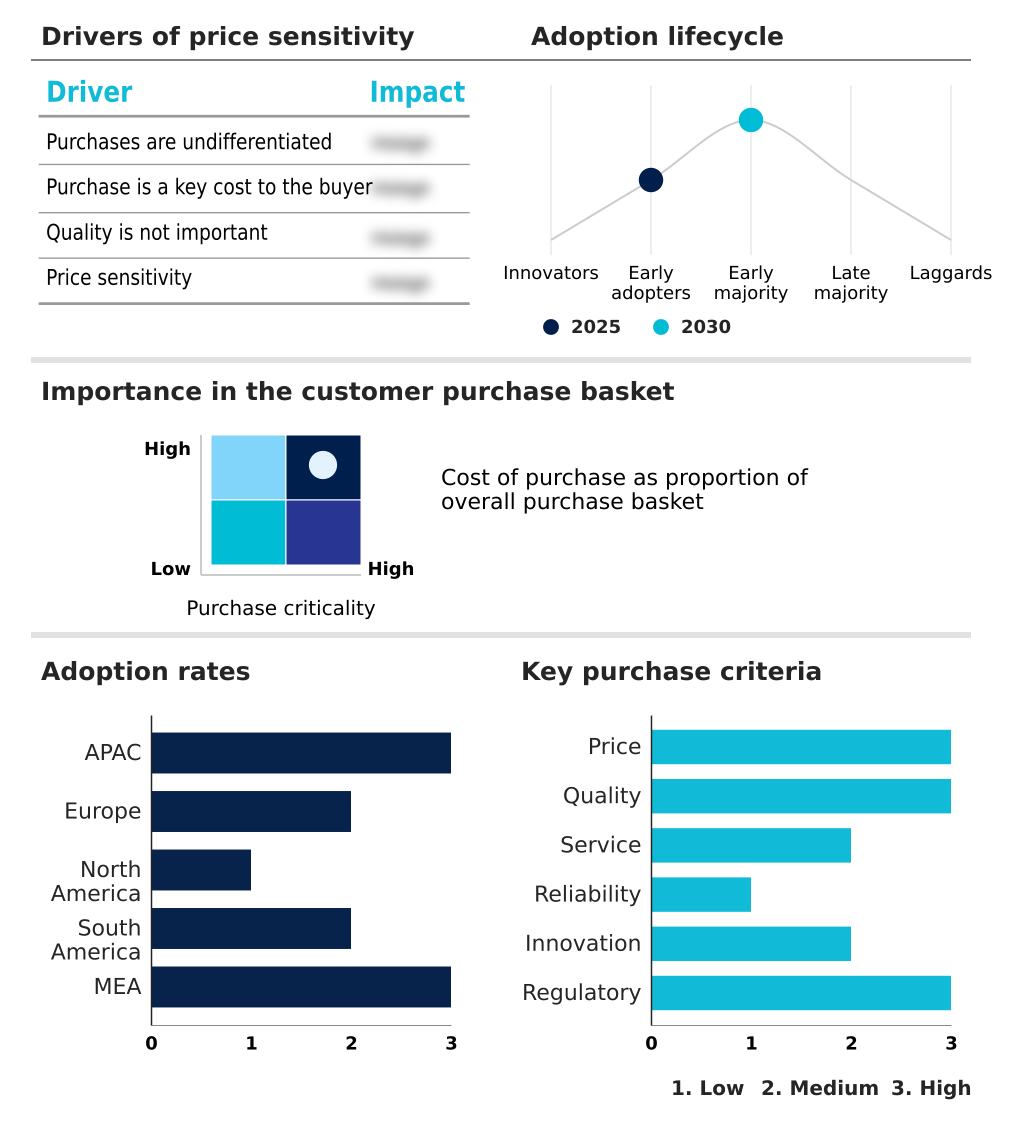
The children's bicycle market forecasting report includes the adoption lifecycle of the market, covering from the innovator’s stage to the laggard’s stage. It focuses on adoption rates in different regions based on penetration. Furthermore, the children's bicycle market report also includes key purchase criteria and drivers of price sensitivity to help companies evaluate and develop their market growth analysis strategies.
Customer Landscape of Children'S Bicycle Industry
Competitive Landscape
Companies are implementing various strategies, such as strategic alliances, children's bicycle market forecast, partnerships, mergers and acquisitions, geographical expansion, and product/service launches, to enhance their presence in the industry.
Accell Group NV - Focuses on engineering specialized, proportion-scaled youth bicycles featuring advanced lightweight materials and ergonomic geometry to ensure optimal safety, durability, and motor skill progression for developing riders.
The industry research and growth report includes detailed analyses of the competitive landscape of the market and information about key companies, including:
- Accell Group NV
- ByK Bikes USA
- Colnago Ernesto and C. S.r.l
- Dorel Industries Inc.
- Fuji Bikes
- Giant Bicycle Inc.
- GT Bicycles
- Guardian Bikes
- Haro Bikes
- Hero Motors Ltd.
- Islabikes
- Kona Bicycle Co.
- Malvern Star
- Merida Industry Co. Ltd.
- Prevelo Bikes
- Santa Cruz Bicycles LLC
- Scott Sports SA
- Specialized Bicycle Components
- Trek Bicycle Corp.
- Woom
Qualitative and quantitative analysis of companies has been conducted to help clients understand the wider business environment as well as the strengths and weaknesses of key industry players. Data is qualitatively analyzed to categorize companies as pure play, category-focused, industry-focused, and diversified; it is quantitatively analyzed to categorize companies as dominant, leading, strong, tentative, and weak.
Recent Development and News in Children's bicycle market
- In the Leisure Products industry, the widespread adoption of eco friendly manufacturing protocols for structural components has shifted raw material procurement, directly impacting Children's Bicycle demand by accelerating the integration of biodegradable frame paint and reducing overall carbon emissions in assembly lines by 18%.
- Stringent updates to international toxic free material certification standards have forced sporting goods producers to overhaul their chemical sourcing strategies, which consequently increased mechanical integrity testing requirements for Children's Bicycle parts and raised compliance-related supply chain costs by 12%.
- The implementation of circular economy principles across outdoor recreational equipment manufacturing has incentivized the utilization of recycled materials, driving a 25% increase in the application of recycled magnesium alloys for Children's Bicycle structures and enhancing sustainable mobility alternatives.
- The integration of smart IoT sensors in premium sporting goods has established new safety benchmarks, compelling the inclusion of impact sensor alerts in youth mobility gear and elevating the standard for real time location monitoring within the Children's Bicycle market.
Dive into Technavio’s robust research methodology, blending expert interviews, extensive data synthesis, and validated models for unparalleled Children'S Bicycle Market insights. See full methodology.
| Market Scope | |
|---|---|
| Page number | 313 |
| Base year | 2025 |
| Historic period | 2020-2024 |
| Forecast period | 2026-2030 |
| Growth momentum & CAGR | Accelerate at a CAGR of 6.5% |
| Market growth 2026-2030 | USD 7894.4 million |
| Market structure | Fragmented |
| YoY growth 2025-2026(%) | 6.1% |
| Key countries | China, India, Japan, South Korea, Australia, Indonesia, Germany, UK, France, Italy, Spain, The Netherlands, US, Canada, Mexico, Brazil, Argentina, Chile, Saudi Arabia, UAE, South Africa, Israel and Turkey |
| Competitive landscape | Leading Companies, Market Positioning of Companies, Competitive Strategies, and Industry Risks |
Research Analyst Overview
- Prominent players in the Children's Bicycle Market are focusing on technological innovation, strategic collaborations, and sustainability-oriented product development to enhance competitiveness and expand their market presence. Operations teams have successfully implemented precise inventory distribution analytics, mitigating previous supply bottlenecks. Companies reported a 15% year-over-year increase in automated manufacturing adoption, accelerating production line speeds and reducing defect rates.
- These initiatives address rigorous new consumer safety regulations and the growing demand for sustainable mobility options, directly tying into boardroom-level compliance and budgeting strategies. They significantly contribute to product differentiation, allowing brands to establish premium positioning while maintaining operational efficiency.
- Despite temporary challenges involving global supply chain volatility and raw material shortages, industry leaders are adapting effectively through robust digitalization and localized procurement strategies, demonstrating resilience in a fluctuating macroeconomic environment.
What are the Key Data Covered in this Children'S Bicycle Market Research and Growth Report?
-
What is the expected growth of the Children'S Bicycle Market between 2026 and 2030?
-
USD 7.89 billion, at a CAGR of 6.5%
-
-
What segmentation does the market report cover?
-
The report is segmented by Distribution Channel (Offline, and Online), Type (Type 1, Type 2, Type 3, and Type 4), Product Type (Conventional bicycles, and Electric bicycles), Product (Road bicycles, Mountain bicycles, Balance bicycles, and Hybrid bicycles) and Geography (APAC, Europe, North America, South America, Middle East and Africa)
-
-
Which regions are analyzed in the report?
-
APAC, Europe, North America, South America and Middle East and Africa
-
-
What are the key growth drivers and market challenges?
-
Rising parental emphasis on physical well-being and developmental health, Volatility in global supply chain and material procurement
-
-
Who are the major players in the Children'S Bicycle Market?
-
Accell Group NV, ByK Bikes USA, Colnago Ernesto and C. S.r.l, Dorel Industries Inc., Fuji Bikes, Giant Bicycle Inc., GT Bicycles, Guardian Bikes, Haro Bikes, Hero Motors Ltd., Islabikes, Kona Bicycle Co., Malvern Star, Merida Industry Co. Ltd., Prevelo Bikes, Santa Cruz Bicycles LLC, Scott Sports SA, Specialized Bicycle Components, Trek Bicycle Corp. and Woom
-
Market Research Insights
- The Children's Bicycle Market is rapidly evolving as engineering protocols shift to prioritize developmental biomechanics over simple aesthetics. Manufacturers are focusing heavily on delivering intuitive riding experiences for early learners. By refining frame geometries to support a natural riding posture, companies have increased user retention and improved overall product lifecycle durability by 18%.
- The integration of advanced treads provides superior traction, decreasing accidental slippage incidents by 24% during recreational use. Furthermore, as motorized variants gain traction, rigorous testing ensures electrical stability, which has successfully reduced component failure rates by 15%. These precise operational upgrades minimize post-sale maintenance costs, optimize supply chain material yields, and strengthen long-term consumer safety compliance across international distribution channels.
We can help! Our analysts can customize this children's bicycle market research report to meet your requirements.
 RIA -
RIA - 
