
China ERP Market Size 2025-2029
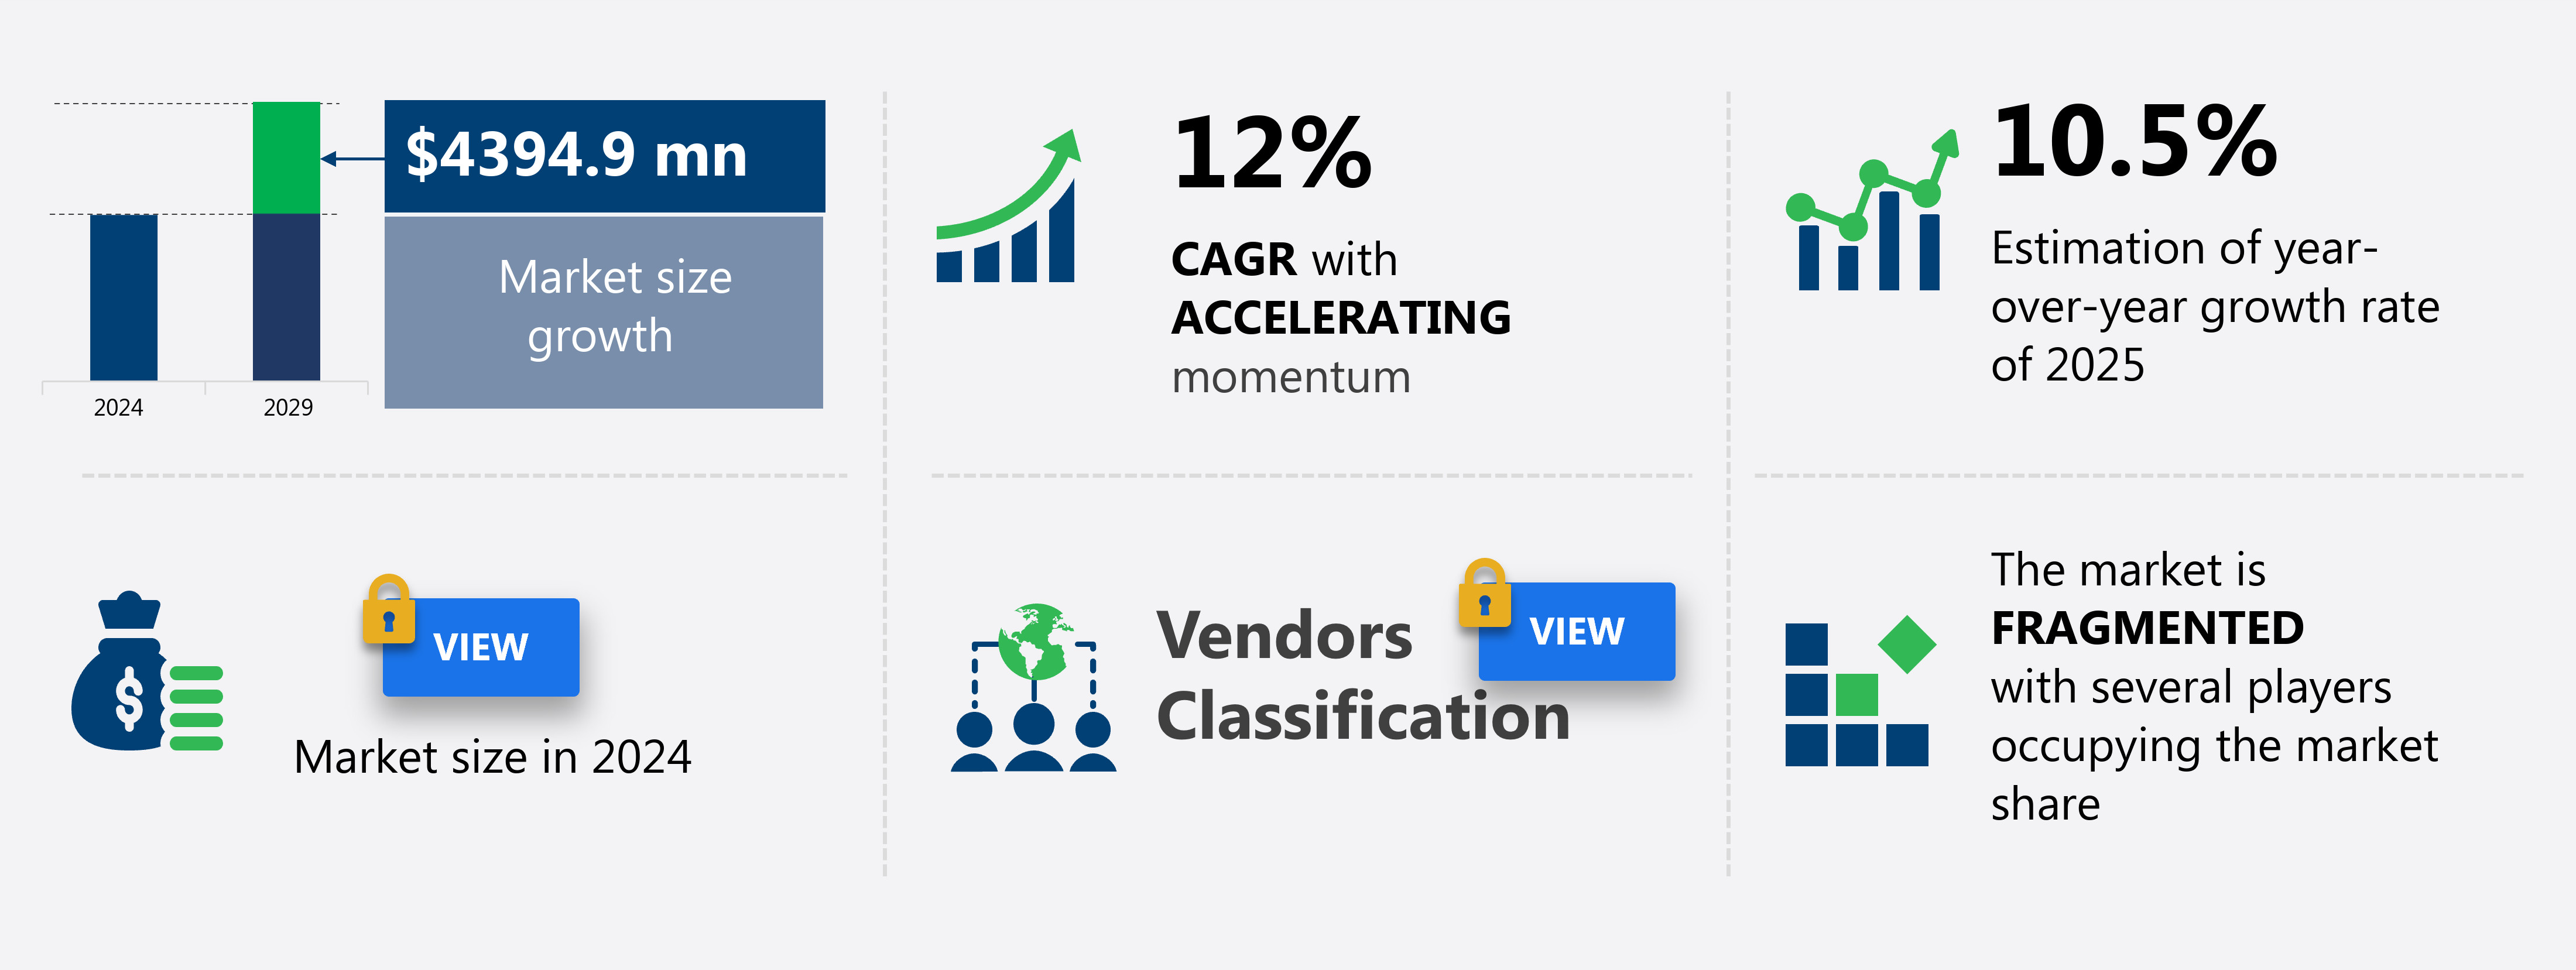
The ERP market in China size is forecast to increase by USD 4.39 billion at a CAGR of 12% between 2024 and 2029.
-
The ERP market is experiencing significant growth due to the increasing focus on operational efficiency among enterprises in various industries. This trend is particularly prominent in the financial sector, where ERP adoption is on the rise. However, the market also faces challenges, including the high risk of cyberattacks on ERP software. As businesses continue to digitalize their operations, securing ERP systems against cyber threats becomes increasingly important. Advanced technologies such as artificial intelligence, machine learning, and the Internet of Things are being integrated into ERP solutions to enhance business processes and improve operational efficiency.
Additionally, the growing complexity of ERP systems necessitates advanced security measures to protect sensitive data. Overall, the ERP market is poised for continued growth, driven by the need for improved operational efficiency and the increasing adoption of ERP solutions across industries, while also presenting significant challenges related to cybersecurity. This trend is particularly prominent in sectors with a strong focus on customer relationship management, such as ecommerce and consumer electronics, where real-time analytics tools and operational efficiency are crucial.
What will be the Size of the market During the Forecast Period?
-
The Enterprise Resource Planning (ERP) market continues to evolve, driven by the increasing adoption of advanced technologies such as cloud applications, open source solutions, and mobile-friendly platforms. Medium and large enterprises across various industries, including manufacturing and patient record administration, are implementing ERP software to streamline business processes, reduce inventory costs, and enhance customer relationship management. Cloud-based ERP platforms are gaining significant traction due to their flexibility, scalability, and cost-effectiveness. IT technologies like cloud services and colocation data centers support the deployment of these solutions. The cloud Enterprise Resource Planning (ERP) market comprises software solutions that enable businesses to manage and streamline their core processes, including customer relationship management, e-commerce, analytics tools, and operational efficiency.
ERP implementation for manufacturing businesses and human resource management is also on the rise. Supplier relationship management and advanced technologies, such as single tenant cloud-based ERP platforms, further enhance the capabilities of these systems. The market is expected to grow further as more businesses recognize the benefits of data-driven decisions and the integration of ERP with other IT applications. Enterprises in sectors such as aerospace and defense, public administration, banking, financial services, and insurance are investing in ERP solutions for consumer preferences and safety and security concerns, including biometric authentication and identification purposes.
How is this market segmented and which is the largest segment?
The market research report provides comprehensive data (region-wise segment analysis), with forecasts and estimates in "USD million" for the period 2025-2029, as well as historical data from 2019-2023 for the following segments.
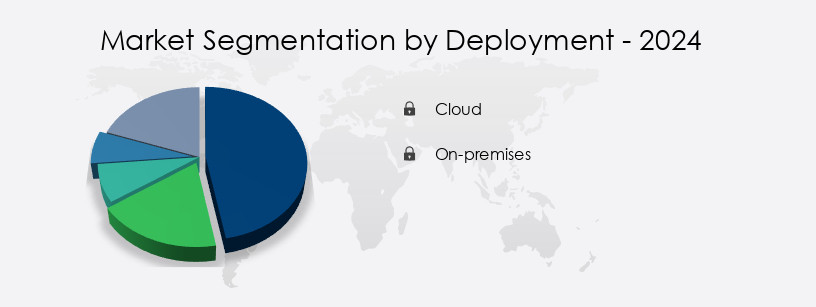
- Deployment
- Cloud
- On-premises
- End-user
- Manufacturing
- Retail and distribution
- IT and telecom
- Healthcare
- Others
- Sector
- Large enterprises
- Medium enterprises
- Small enterprises
- Application
- Finance and human resources (HR)
- Supply chain management (SCM)
- Customer relationship management (CRM)
- Others
- Geography
- China
By Deployment Insights
- The cloud segment is estimated to witness significant growth during the forecast period. The market is experiencing significant technological advancements, primarily driven by the adoption of cloud applications. Cloud-based ERP solutions have seen increasing demand among medium and large enterprises, leading companies to introduce separate offerings or modify existing solutions. For instance, Epicor Software Corp. Offers ERP deployment options for both enterprise data centers and the cloud. Cloud-based ERP software is hosted in remote data centers, enabling users to access it via the Internet. This deployment model offers several benefits, including real-time reporting, financial tracking, inventory control, and workflow automation. Cloud services, such as mobile-friendliness and integration with other cloud systems, have further fueled the growth of cloud-based ERP platforms.
- Medium and manufacturing SMEs have been particularly active in adopting cloud-based ERP solutions due to their cost-effectiveness and ease of implementation. These systems provide cross-functional information, process streamlining, and resource optimization, leading to improved operational performance and business automation. Additionally, next-generation technologies, such as artificial intelligence, machine learning, and data analytics, are increasingly being integrated into cloud-based ERP platforms. Cloud ERP systems offer significant advantages over traditional on-premises solutions, including system efficiency, software scalability, and enterprise tools for operational management. However, concerns around data duplication, data integrity, and data security remain. System integrators and third-party integrators play a crucial role in ensuring seamless integration with other systems and software updates.
Get a glance at the market report of share of various segments Request Free Sample
Market Dynamics
Our China ERP Market researchers analyzed the data with 2024 as the base year, along with the key drivers, trends, and challenges. A holistic analysis of drivers will help companies refine their marketing strategies to gain a competitive advantage.
What are the key market drivers leading to the rise in adoption of China ERP Market?
- Growing focus on improving operational efficiency among enterprises is the key driver of the market. ERP solutions, or Enterprise Resource Planning, are becoming increasingly popular among Chinese businesses as they seek to enhance operational efficiency. Cloud-based ERP platforms link various business functions within an organization, providing real-time access to data and enabling better cross-functional information flow. This leads to improved decision-making through data driven insights. Epicor Kinetic, for instance, offers cloud-based ERP solutions, launched in January 2025, which optimize operations, foster collaboration, and provide real-time data access. Advanced analytics and scalability are additional benefits, enabling organizations to streamline processes and make informed decisions. The adoption of ERP solutions allows for better control of documents, inventory, and supplier and customer relationships.
- Additionally, these platforms offer automation software for workflow management, resource scheduling, and project management. Cloud integration and data analytics provide valuable business insights, ensuring system efficiency, resource optimization, and process streamlining. The integration of machine learning, artificial intelligence, and big data analytics further enhances enterprise performance in industries like construction, healthcare, IT and telecom. ERP deployment offers software scalability, enterprise tools, and real-time reporting for financial tracking and inventory control. Security is ensured through custom modules and secure data management. Overall, ERP platforms offer a comprehensive solution for enterprise operations, improving operational performance, data accuracy, and system adaptability.
What are the market trends shaping the China ERP Market?
- Rising adoption of ERP among financial institutions is the upcoming trend in the market. In China, financial institutions are exploring the integration of cloud-based ERP systems with emerging technologies such as artificial intelligence (AI), Internet of Things (IoT), and blockchain, to drive business growth. These institutions, including credit unions, banking, trust companies, and insurance sectors, are increasingly adopting cloud applications for their ERP implementation. In April 2023, Huawei introduced its MetaERP system, marking the company's entry into the commercialization of ERP software. This trend signifies the growing importance of data driven decisions, system efficiency, and resource optimization for medium and large enterprises in China. Cloud-based ERP platforms offer benefits such as real-time reporting, financial tracking, inventory control, and workflow automation.
-
Additionally, these systems enable cross-functional information sharing, process integration, and live analytics. Cloud deployment options, including enterprise data centers, colocation data centers, and managed data centers, provide flexibility and scalability for businesses. Furthermore, the integration of AI, machine learning, and next-generation technologies such as material requirement planning, human capital management, and supplier relationship management, enhances operational performance and business automation. Cloud integration and data analytics facilitate custom modules, business insights, and system upgrades. Overall, the adoption of cloud-based ERP solutions is an investment in digitalization that offers significant benefits for enterprise productivity, process coordination, and data accuracy.
What challenges doesChina ERP Market face during the growth?
- High risk of cyberattacks on ERP software is a key challenge affecting market growth. ERP systems, which enable data driven decisions and streamline business processes, have gained significant adoption among medium and large enterprises worldwide. Cloud-based ERP platforms, including open source solutions, have become increasingly popular due to their flexibility, scalability, and cost-effectiveness. These systems facilitate real-time reporting, financial tracking, inventory control, and workflow automation, among other features. However, the increasing use of ERP systems presents new challenges, particularly in terms of security. As more businesses move to cloud deployment, there is a growing risk of cyberattacks, such as DDoS, targeting ERP systems. The potential consequences of these attacks can be severe, including data duplication, data integrity issues, and operational disruptions.
-
To mitigate these risks, businesses are investing in digitalization and implementing IT technologies like artificial intelligence, machine learning, and automation software. They are also relying on system integrators, third-party integrators, and cloud ERP companies for secure data management and system upgrades. Moreover, ERP systems are being integrated with cloud services, mobile devices, and other enterprise tools to enhance operational performance and resource optimization. Cloud integration and data analytics are also enabling process streamlining and business automation. In summary, while ERP systems offer numerous benefits, businesses must prioritize security and data integrity to fully realize their potential. However, concerns around cyber threats and encryption remain, necessitating continuous investment in cloud security. By leveraging next-generation technologies and partnering with trusted companies, they can mitigate risks and maximize the value of their ERP investments.
Exclusive Customer Landscape
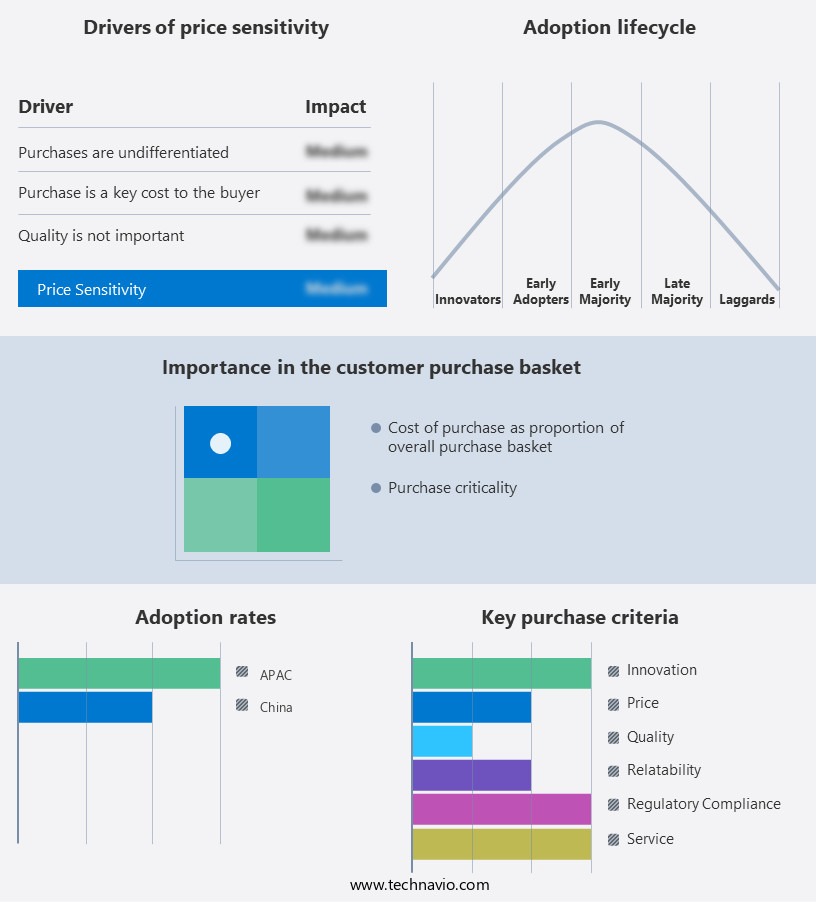
The market forecasting report includes the adoption lifecycle of the market, covering from the innovator's stage to the laggard's stage. It focuses on adoption rates in different regions based on penetration. Furthermore, the market report also includes key purchase criteria and drivers of price sensitivity to help companies evaluate and develop their market growth analysis strategies.
Customer Landscape
Key Companies & Market Insights
Companies are implementing various strategies, such as strategic alliances, market forecast, partnerships, mergers and acquisitions, geographical expansion, and product/service launches, to enhance their presence in the market.
Dassault Systemes SE - The company offers ERP solutions that cater to diverse industries and business sizes, ensuring a customized and effective implementation.
The market research and growth report includes detailed analyses of the competitive landscape of the market and information about key companies, including:
- Dassault Systemes SE
- Epicor Software Corp.
- Forterro UK Ltd.
- Fujitsu Ltd.
- Huawei Technologies Co. Ltd.
- Kingdee International Software Group Co. Ltd.
- Koch Industries Inc.
- Microsoft Corp.
- Neusoft Corp.
- Odoo SA
- Oracle Corp.
- QAD Inc.
- Ramco Systems Ltd.
- Rockwell Automation Inc.
- Rootstock Software
- Sage Group Plc
- SAP SE
- SYSPRO Pty. Ltd.
- Workday Inc.
- YonYou Network Technology Co. Ltd.
Qualitative and quantitative analysis of companies has been conducted to help clients understand the wider business environment as well as the strengths and weaknesses of key market players. Data is qualitatively analyzed to categorize companies as pure play, category-focused, industry-focused, and diversified; it is quantitatively analyzed to categorize companies as dominant, leading, strong, tentative, and weak.
Research Analyst Overview
The Enterprise Resource Planning (ERP) market continues to evolve, driven by the increasing adoption of cloud applications and open source solutions. Medium-sized businesses are recognizing the benefits of implementing cloud-based ERP platforms, which offer flexibility, scalability, and cost savings. IT technologies, such as cloud services and mobile devices, are enabling these businesses to access real-time data and streamline their operations. Inventory costs are a significant concern for manufacturing businesses, and ERP systems are essential tools for managing these costs effectively. Cloud-deployed ERP solutions offer advanced features for material requirement planning, supplier relationship management, and inventory control. Human resource management is another critical area where ERP systems can provide significant benefits, from recruitment and onboarding to performance management and succession planning.
Large enterprises have been early adopters of ERP systems, but medium enterprises are now following suit. The investment in digitalization is a key driver for ERP implementation, as businesses seek to improve operational performance and gain cross-functional insights. System integrators and third-party integrators play a crucial role in the deployment and integration of ERP systems, ensuring seamless data flow and process coordination. Cloud-based ERP platforms offer several advantages over traditional on-premises solutions. They are more flexible and scalable, allowing businesses to add or remove users and features as needed. They also offer real-time reporting and financial tracking, enabling businesses to make data-driven decisions quickly and effectively.
Next-generation technologies, such as artificial intelligence and machine learning, are being integrated into ERP platforms to provide advanced capabilities for data analytics and process automation. Digital assistants and control of documents are other features that are becoming increasingly important for businesses looking to streamline their operations and improve operational flow. Data duplication and data integrity are critical concerns for businesses implementing ERP systems. Cloud systems offer robust data security features, including encryption and access controls, to ensure the confidentiality and accuracy of business data. ERP platforms also offer custom modules and business insights, enabling businesses to tailor the system to their specific needs and gain valuable insights into their operations.
ERP deployment options include cloud-based, on-premises, and hybrid solutions. Cloud-based ERP offers several advantages, including lower upfront costs, easier deployment, and automatic software updates. However, on-premises solutions may offer greater control and customization options for larger enterprises. ERP systems are essential tools for managing business processes, from project management and risk management to business automation and process streamlining. They offer advanced features for data analytics, system efficiency, and resource optimization, enabling businesses to make informed decisions and improve operational performance. The ERP market is undergoing significant changes, driven by the adoption of cloud applications and open source solutions.
Medium-sized and large enterprises are investing in digitalization and implementing ERP systems to improve operational performance, gain cross-functional insights, and streamline their business processes. Cloud-based ERP platforms offer several advantages, including flexibility, scalability, and real-time reporting, making them an attractive option for businesses looking to make the most of their IT investments.
|
Market Scope |
|
|
Report Coverage |
Details |
|
Page number |
184 |
|
Base year |
2024 |
|
Historic period |
2019-2023 |
|
Forecast period |
2025-2029 |
|
Growth momentum & CAGR |
Accelerate at a CAGR of 12% |
|
Market growth 2025-2029 |
USD 4.39 billion |
|
Market structure |
Fragmented |
|
YoY growth 2024-2025(%) |
10.5 |
|
Key countries |
China and Asia |
|
Competitive landscape |
Leading Companies, Market Positioning of Companies, Competitive Strategies, and Industry Risks |
What are the Key Data Covered in this Market Research and Growth Report?
- CAGR of the market during the forecast period
- Detailed information on factors that will drive the market growth and forecasting between 2025 and 2029
- Precise estimation of the size of the market and its contribution of the market in focus to the parent market
- Accurate predictions about upcoming market growth and trends and changes in consumer behaviour
- Growth of the market across China
- Thorough analysis of the market's competitive landscape and detailed information about companies
- Comprehensive analysis of factors that will challenge the growth of market companies
We can help! Our analysts can customize this market research report to meet your requirements. Get in touch