Chlorine Dioxide Disinfectant Market Analysis North America, Europe, APAC, South America, Middle East and Africa - US, China, India, Germany, UK - Size and Forecast 2024-2028

Chlorine Dioxide Disinfectant Market Analysis North America, Europe, APAC, South America, Middle East and Africa - US, China, India, Germany, UK - Size and Forecast 2024-2028

Published: Feb 2024 171 Pages SKU: IRTNTR77511

Market Overview at a Glance

$276.59 Mn
Market Opportunity
5.9%
CAGR
4.9
YoY growth 2023-2024(%)

Chlorine Dioxide Disinfectant Market Size 2024-2028 

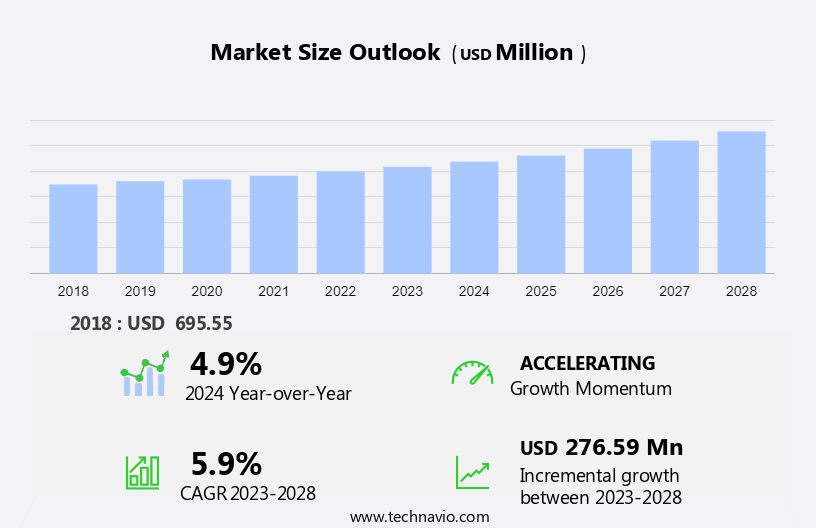
The chlorine dioxide disinfectant market size is forecast to increase by USD 276.59 million at a CAGR of 5.9% between 2023 and 2028.

  • The market is witnessing significant growth due to several key factors. Increased government regulations mandating stringent disinfection practices in healthcare facilities, particularly in hospitals, are driving market growth. The rising awareness about the prevalence and transmission of infectious diseases, including COVID-19, is also fueling the demand for effective disinfectants, with chlorine dioxide gaining popularity due to its broad-spectrum antimicrobial properties. Additionally, the availability of alternatives to chlorine dioxide disinfectants, such as hydrogen peroxide and quaternary ammonia, is posing challenges to market growth as they offer similar disinfection capabilities. However, the unique advantages of chlorine dioxide, such as its ability to penetrate biofilms and leave no residual chemicals, make it a preferred choice for many applications.

What will the size of the market be during the forecast period?

Chlorine Dioxide Disinfectant Market Size

 Request Free Sample

  • Chlorine disinfectants have long been a staple in sanitation and hygiene practices, particularly in public facilities such as swimming pools and water treatment plants. These antimicrobial agents effectively eliminate pathogens that cause waterborne diseases, ensuring clean water for various applications. Chlorine dioxide, a powerful oxidizing agent, has gained popularity due to its ability to disinfect without leaving taste profiles or forming trihalomethanes, like organochlorine compounds. Chlorine dioxide is effective against a broad spectrum of pathogens, making it an ideal choice for industrial activities, including poultry processing and wastewater treatment. Its use in electrolytic disinfection enhances its efficiency and safety.
  • In water treatment, chlorine dioxide plays a crucial role in maintaining water quality by eliminating bacteria, viruses, and parasites. However, it's essential to consider the potential environmental impact of using chemicals for disinfection. Chlorine dioxide can react with organic matter and form harmful by-products, contributing to pollution if not properly managed. Therefore, it's crucial to adhere to disinfection practices that ensure safe drinking water while minimizing the risk of industrial waste and waterborne diseases.

How is this market segmented and which is the largest segment?

The market research report provides comprehensive data (region-wise segment analysis), with forecasts and estimates in "USD million" for the period 2024-2028, as well as historical data from 2018-2022 for the following segments.

  • Type
    • Liquid
    • Gas
    • Solid
  • Application
    • Water treatment
    • Food and beverages
    • Healthcare
    • Others
  • Geography
    • North America
      • US
    • Europe
      • Germany
      • UK
    • APAC
      • China
      • India
    • South America
    • Middle East and Africa

By Type Insights

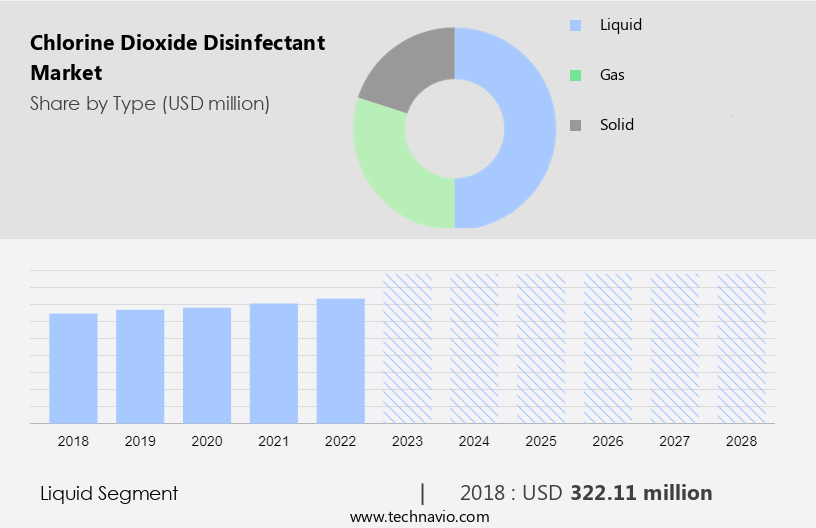
  • The liquid segment is estimated to witness significant growth during the forecast period.

Chlorine dioxide, a potent chlorine disinfectant, plays a crucial role in maintaining sanitation and hygiene in various sectors, including public facilities, water treatment plants, and swimming pools. Its application ensures the elimination of pathogens, thereby contributing to clean water and effective disinfection practices. Industrial activities, such as poultry processing, also utilize chlorine dioxide for wastewater treatment to prevent health risks associated with waterborne diseases and healthcare-associated infections (HAIs). The oxidation process employed by chlorine dioxide results in minimal formation of disinfection byproducts (DBPs), making it an attractive alternative to traditional chlorine-based disinfectants. Advancements in membrane technologies, including membrane filtration, reverse osmosis (RO), and membrane bioreactors (MBRs), have enabled smart delivery systems for chlorine dioxide, enhancing its application scope.

Furthermore, the automotive sector also employs chlorine dioxide for industrial wastewater treatment, ensuring freshwater availability. Despite its benefits, water scarcity remains a significant challenge, necessitating water conservation efforts and the development of more efficient disinfection solutions.

Chlorine Dioxide Disinfectant Market Size

Get a glance at the market report of share of various segments Request Free Sample

The liquid segment was valued at USD 322.11 million in 2018 and showed a gradual increase during the forecast period.

Regional Analysis

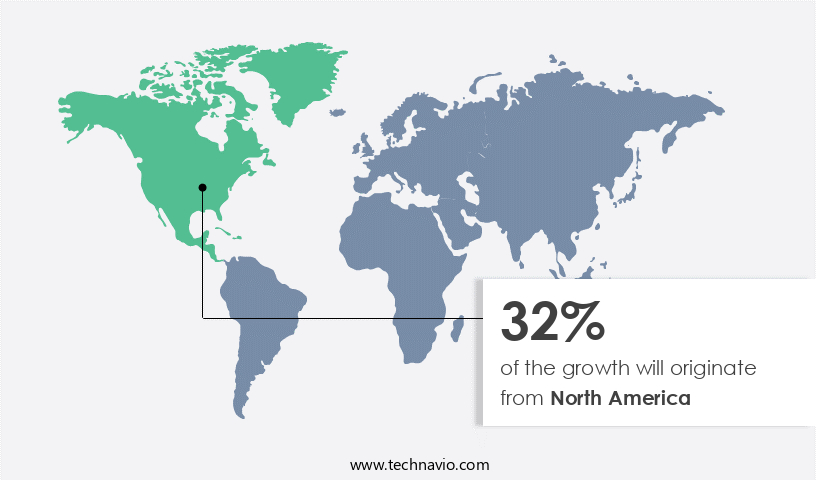
  • North America is estimated to contribute 32% to the growth of the global market during the forecast period.

Technavio's analysts have elaborately explained the regional trends and drivers that shape the market during the forecast period.

Chlorine Dioxide Disinfectant Market Share by Geography

For more insights on the market share of various regions Request Free Sample

The market in North America is projected to dominate the global industry landscape due to the increasing focus on sustainable practices and the growing demand for clean water. With population growth and rapid industrialization, there is a significant need for effective water treatment solutions to ensure the safety and quality of water supplies. Chlorine dioxide, as a potent biocide, plays a crucial role in water treatment by eliminating waterborne diseases and contaminants, including bacteria and viruses. Strict environmental regulations aimed at reducing water pollution and industrial waste are also driving the market's expansion in the region. In addition, the increasing demand for water reuse in various industries, such as food and beverage and electric power generation, is further fueling the market's growth.

However, concerns over the toxic effects of organochlorine compounds, including chlorine dioxide, and health hazards associated with their use are potential challenges that market participants must address. The fast food industry's growing demand for clean water and stringent regulations in industrial water treatment is expected to provide significant opportunities for market growth. Electric vehicles increasing popularity and the shift towards renewable energy sources may also impact the market's trajectory in the future.

Market Dynamics

Our researchers analyzed the data with 2023 as the base year, along with the key drivers, trends, and challenges. A holistic analysis of drivers will help companies refine their marketing strategies to gain a competitive advantage.

What are the key market drivers leading to the rise in the adoption of the Chlorine Dioxide Disinfectant Market?

Increased government regulations regarding disinfection in hospitals is the key driver of the market.

  • Chlorine disinfectants, such as Chlorine Dioxide, play a crucial role in maintaining sanitation and hygiene in various sectors including public facilities, water treatment plants, swimming pools, and industrial activities. With a growing focus on water quality and disinfection practices, Chlorine Dioxide has emerged as an effective disinfection solution for eliminating pathogens like bacteria, viruses, and fungi. In the healthcare sector, the increasing number of cases of healthcare-associated infections (HAIs) has led regulatory bodies like the Centers for Disease Control and Prevention (CDC), the Occupational Safety and Health Administration (OSHA), and the US Environmental Protection Agency (EPA) to enforce regulations on disinfection.
  • Chlorine Dioxide is used to sterilize tools, surfaces, and medical and lab equipment in hospitals to reduce the risk of HAIs. This oxidation process is also employed in water treatment, including wastewater treatment, to ensure clean water for various industries, including tourism and poultry processing, as well as for safe drinking water. Chlorine Dioxide is also used in industrial wastewater treatment, water conservation, and freshwater availability initiatives. Its use in membrane technologies like membrane filtration, reverse osmosis (RO), and membrane bioreactors (MBRs) has further increased its popularity due to smart delivery systems and its ability to minimize the formation of disinfection byproducts (DBPs).

What are the market trends shaping the Chlorine Dioxide Disinfectant Market?

Rising awareness about infectious diseases is the upcoming trend in the market.

  • Chlorine disinfectants have long been utilized in various sectors, including sanitation and hygiene, to ensure clean water and maintain effective disinfection practices. Public facilities such as swimming pools and water treatment plants rely on chlorine disinfectants to eliminate pathogens and ensure water quality. Industrial activities, including poultry processing, also utilize chlorine disinfectants to control microorganisms and prevent the spread of waterborne diseases. Chlorine dioxide, a potent oxidizing agent, is gaining popularity as an effective disinfection solution due to its ability to eliminate a wide range of pathogens, including bacteria, viruses, and parasites. This is particularly important in the context of the COVID-19 pandemic, which has highlighted the critical role that disinfection plays in disease prevention.
  • Membrane technologies, such as membrane filtration, reverse osmosis (RO), and membrane bioreactors (MBRs), are increasingly being used in water treatment to ensure clean water and reduce the formation of disinfection byproducts (DBPs). Chlorine dioxide, which does not form DBPs, is an attractive alternative to traditional chlorine disinfectants. The importance of clean water extends beyond public health initiatives. The tourism industry, for instance, relies on clean water for recreational activities such as swimming and water sports. Chlorine dioxide disinfectants are also used in the automotive sector for wastewater treatment and in the production of antimicrobial agents. Water scarcity is a growing concern, and the need for water conservation has led to the development of smart delivery systems for chlorine dioxide disinfectants.

What challenges does the Chlorine Dioxide Disinfectant Market face during its growth?

Availability of alternatives to chlorine dioxide disinfectants is a key challenge affecting the market growth.

  • Chlorine disinfectants have long been utilized for sanitation and hygiene applications in various sectors, including public facilities, water treatment plants, and swimming pools, to ensure water quality and maintain effective disinfection practices against pathogens. Chlorine Dioxide, a potent oxidizing agent, has gained popularity due to its ability to effectively eliminate bacteria, viruses, and other contaminants. However, the use of chlorine disinfectants, including Chlorine Dioxide, can lead to the formation of disinfection byproducts (DBPs), which may pose health concerns. Membrane technologies, such as membrane filtration, reverse osmosis (RO), and membrane bioreactors (MBRs), have emerged as viable alternatives to chlorine disinfection.
  • Membrane processes and UV radiation are particularly noteworthy, as they can effectively remove bacteria, viruses, protozoa, and other chemical contaminants. UV irradiation is capable of inactivating viruses, bacteria, and protozoan parasites, while membrane processes utilize a membrane barrier to filter or remove particles from water. Industrial activities, including poultry processing and wastewater treatment, also contribute to water contamination. Chlorine-treated wastewater from these industries can impact freshwater availability and contribute to health concerns, such as waterborne diseases and healthcare-associated infections (HAI). tourism industry, which relies on clean water for recreational activities, is also affected by these issues. Membrane processes and UV radiation offer potential solutions for addressing these challenges.

Exclusive Customer Landscape

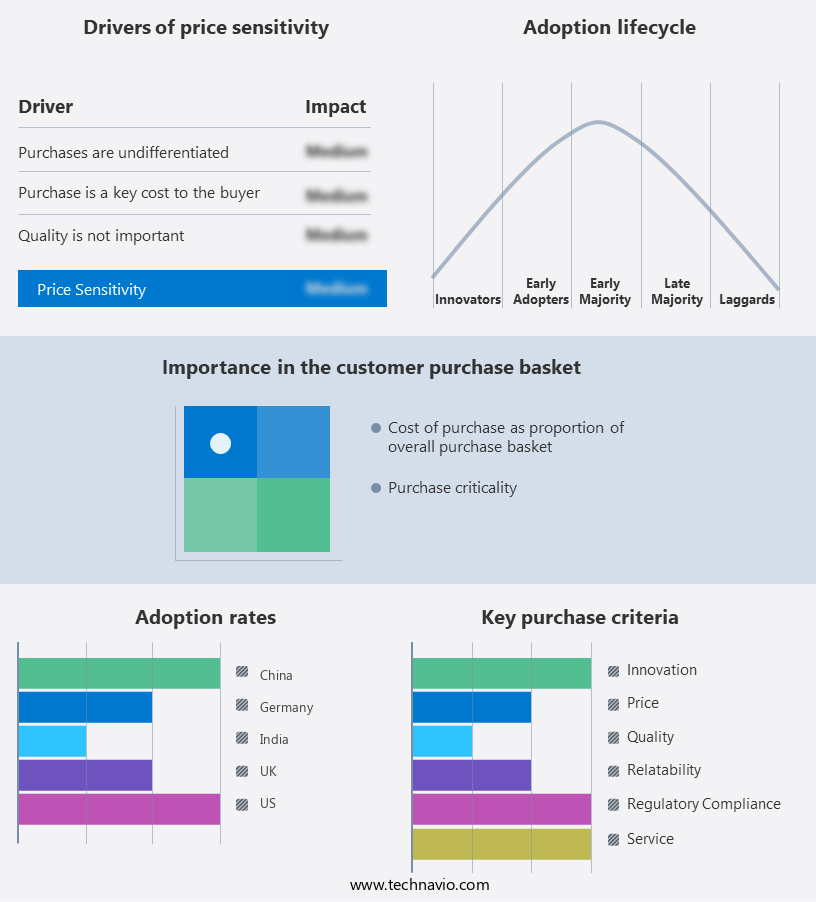
The market forecasting report includes the adoption lifecycle of the market, covering from the innovator's stage to the laggard's stage. It focuses on adoption rates in different regions based on penetration. Furthermore, the market report also includes key purchase criteria and drivers of price sensitivity to help companies evaluate and develop their market growth analysis strategies.

Chlorine Dioxide Disinfectant Market Share by Geography

 Customer Landscape

Key Companies & Market Insights

Companies are implementing various strategies, such as strategic alliances, market forecast, partnerships, mergers and acquisitions, geographical expansion, and product/service launches, to enhance their presence in the market. The market research and growth report includes detailed analyses of the competitive landscape of the market and information about key companies, including:

  • Accepta Ltd.
  • AquaPulse Systems
  • Beckart Environmental International Ltd.
  • DuPont de Nemours Inc.
  • Ecolab Inc.
  • Feedwater Ltd.
  • Grundfos Holding AS
  • Kemin Industries Inc.
  • Kurita Water Industries Ltd.
  • Lanxess AG
  • Lenntech BV
  • Nitto Denko Corp.
  • ProMinent GmbH
  • Quip Labs
  • Scotmas Group Ltd.
  • SVS Aqua Technologies
  • The Lubrizol Corp.
  • VASU CHEMICALS LLP
  • Veolia Environnement SA
  • Xylem Inc.

Qualitative and quantitative analysis of companies has been conducted to help clients understand the wider business environment as well as the strengths and weaknesses of key market players. Data is qualitatively analyzed to categorize companies as pure play, category-focused, industry-focused, and diversified; it is quantitatively analyzed to categorize companies as dominant, leading, strong, tentative, and weak.

Research Analyst Overview

Chlorine disinfectants continue to play a crucial role in ensuring cleanliness and hygiene in various sectors, including sanitation, public facilities, and water treatment plants. In swimming pools and water treatment plants, chlorine disinfectants are widely used for disinfection practices to eliminate pathogens and maintain water quality. Industrial activities, such as poultry processing, also rely on chlorine disinfectants to control bacteria and ensure safe production. Chlorine dioxide, a type of chlorine disinfectant, is gaining popularity due to its effectiveness against a broad spectrum of pathogens. It is particularly useful in water treatment, including wastewater treatment, to remove contaminants and ensure safe water for domestic and industrial use.

Furthermore, membrane technologies, such as membrane filtration, reverse osmosis (RO), and membrane bioreactors (MBRs), are increasingly being used in conjunction with chlorine disinfectants to enhance water treatment processes and reduce disinfection byproducts (DBPs). Chlorine dioxide is also used in smart delivery systems for efficient and targeted disinfection. Water scarcity and the need for effective disinfection solutions have led to the growth of the market. The market is also driven by public health initiatives to prevent waterborne diseases and healthcare-associated infections (HAIs). The tourism industry, automotive sector, and chemicals industry are other significant end-users of chlorine disinfectants. Chlorine dioxide is also used as an antimicrobial agent in various applications, including industrial wastewater treatment and freshwater availability. However, concerns over taste profiles and the formation of disinfection byproducts (DBPs) during the use of chlorine disinfectants may limit market growth.

Market Scope

Report Coverage

Details

Page number

171

Base year

2023

Historic period

2018-2022

Forecast period

2024-2028

Growth momentum & CAGR

Accelerate at a CAGR of 5.9%

Market Growth 2024-2028

USD 276.59 million

Market structure

Fragmented

YoY growth 2023-2024(%)

4.9

Key countries

US, China, India, Germany, and UK

Competitive landscape

Leading Companies, Market Positioning of Companies, Competitive Strategies, and Industry Risks

Request Free Sample

What are the Key Data Covered in this Market Research and Growth Report?

  • CAGR of the market during the forecast period
  • Detailed information on factors that will drive the market growth and forecasting between 2024 and 2028
  • Precise estimation of the size of the market  and its contribution of the market in focus to the parent market
  • Accurate predictions about upcoming market growth and trends and changes in consumer behaviour
  • Growth of the market across North America, Europe, APAC, South America, and Middle East and Africa
  • Thorough analysis of the market's competitive landscape and detailed information about companies
  • Comprehensive analysis of factors that will challenge the growth of market companies

We can help! Our analysts can customize this market research report to meet your requirements. Get in touch

1 Executive Summary

  • 1.1 Market overview
    • Exhibit 01: Executive Summary – Chart on Market Overview
    • Exhibit 02: Executive Summary – Data Table on Market Overview
    • Exhibit 03: Executive Summary – Chart on Global Market Characteristics
    • Exhibit 04: Executive Summary – Chart on Market by Geography
    • Exhibit 05: Executive Summary – Chart on Market Segmentation by Type
    • Exhibit 06: Executive Summary – Chart on Market Segmentation by Application
    • Exhibit 07: Executive Summary – Chart on Incremental Growth
    • Exhibit 08: Executive Summary – Data Table on Incremental Growth
    • Exhibit 09: Executive Summary – Chart on Vendor Market Positioning

2 Market Landscape

  • 2.1 Market ecosystem
    • Exhibit 10: Parent market
    • Exhibit 11: Market Characteristics

3 Market Sizing

  • 3.1 Market definition
    • Exhibit 12: Offerings of vendors included in the market definition
  • 3.2 Market segment analysis
    • Exhibit 13: Market segments
  • 3.3 Market size 2023
    • 3.4 Market outlook: Forecast for 2023-2028
      • Exhibit 14: Chart on Global - Market size and forecast 2023-2028 ($ million)
      • Exhibit 15: Data Table on Global - Market size and forecast 2023-2028 ($ million)
      • Exhibit 16: Chart on Global Market: Year-over-year growth 2023-2028 (%)
      • Exhibit 17: Data Table on Global Market: Year-over-year growth 2023-2028 (%)

    4 Historic Market Size

    • 4.1 Global chlorine dioxide disinfectant market 2018 - 2022
      • Exhibit 18: Historic Market Size – Data Table on global chlorine dioxide disinfectant market 2018 - 2022 ($ million)
    • 4.2 Type Segment Analysis 2018 - 2022
      • Exhibit 19: Historic Market Size – Type Segment 2018 - 2022 ($ million)
    • 4.3 Application Segment Analysis 2018 - 2022
      • Exhibit 20: Historic Market Size – Application Segment 2018 - 2022 ($ million)
    • 4.4 Geography Segment Analysis 2018 - 2022
      • Exhibit 21: Historic Market Size – Geography Segment 2018 - 2022 ($ million)
    • 4.5 Country Segment Analysis 2018 - 2022
      • Exhibit 22: Historic Market Size – Country Segment 2018 - 2022 ($ million)

    5 Five Forces Analysis

    • 5.1 Five forces summary
      • Exhibit 23: Five forces analysis - Comparison between 2023 and 2028
    • 5.2 Bargaining power of buyers
      • Exhibit 24: Chart on Bargaining power of buyers – Impact of key factors 2023 and 2028
    • 5.3 Bargaining power of suppliers
      • Exhibit 25: Bargaining power of suppliers – Impact of key factors in 2023 and 2028
    • 5.4 Threat of new entrants
      • Exhibit 26: Threat of new entrants – Impact of key factors in 2023 and 2028
    • 5.5 Threat of substitutes
      • Exhibit 27: Threat of substitutes – Impact of key factors in 2023 and 2028
    • 5.6 Threat of rivalry
      • Exhibit 28: Threat of rivalry – Impact of key factors in 2023 and 2028
    • 5.7 Market condition
      • Exhibit 29: Chart on Market condition - Five forces 2023 and 2028

    6 Market Segmentation by Type

    • 6.1 Market segments
      • Exhibit 30: Chart on Type - Market share 2023-2028 (%)
      • Exhibit 31: Data Table on Type - Market share 2023-2028 (%)
    • 6.2 Comparison by Type
      • Exhibit 32: Chart on Comparison by Type
      • Exhibit 33: Data Table on Comparison by Type
    • 6.3 Liquid - Market size and forecast 2023-2028
      • Exhibit 34: Chart on Liquid - Market size and forecast 2023-2028 ($ million)
      • Exhibit 35: Data Table on Liquid - Market size and forecast 2023-2028 ($ million)
      • Exhibit 36: Chart on Liquid - Year-over-year growth 2023-2028 (%)
      • Exhibit 37: Data Table on Liquid - Year-over-year growth 2023-2028 (%)
    • 6.4 Gas - Market size and forecast 2023-2028
      • Exhibit 38: Chart on Gas - Market size and forecast 2023-2028 ($ million)
      • Exhibit 39: Data Table on Gas - Market size and forecast 2023-2028 ($ million)
      • Exhibit 40: Chart on Gas - Year-over-year growth 2023-2028 (%)
      • Exhibit 41: Data Table on Gas - Year-over-year growth 2023-2028 (%)
    • 6.5 Solid - Market size and forecast 2023-2028
      • Exhibit 42: Chart on Solid - Market size and forecast 2023-2028 ($ million)
      • Exhibit 43: Data Table on Solid - Market size and forecast 2023-2028 ($ million)
      • Exhibit 44: Chart on Solid - Year-over-year growth 2023-2028 (%)
      • Exhibit 45: Data Table on Solid - Year-over-year growth 2023-2028 (%)
    • 6.6 Market opportunity by Type
      • Exhibit 46: Market opportunity by Type ($ million)
      • Exhibit 47: Data Table on Market opportunity by Type ($ million)

    7 Market Segmentation by Application

    • 7.1 Market segments
      • Exhibit 48: Chart on Application - Market share 2023-2028 (%)
      • Exhibit 49: Data Table on Application - Market share 2023-2028 (%)
    • 7.2 Comparison by Application
      • Exhibit 50: Chart on Comparison by Application
      • Exhibit 51: Data Table on Comparison by Application
    • 7.3 Water treatment - Market size and forecast 2023-2028
      • Exhibit 52: Chart on Water treatment - Market size and forecast 2023-2028 ($ million)
      • Exhibit 53: Data Table on Water treatment - Market size and forecast 2023-2028 ($ million)
      • Exhibit 54: Chart on Water treatment - Year-over-year growth 2023-2028 (%)
      • Exhibit 55: Data Table on Water treatment - Year-over-year growth 2023-2028 (%)
    • 7.4 Food and beverages - Market size and forecast 2023-2028
      • Exhibit 56: Chart on Food and beverages - Market size and forecast 2023-2028 ($ million)
      • Exhibit 57: Data Table on Food and beverages - Market size and forecast 2023-2028 ($ million)
      • Exhibit 58: Chart on Food and beverages - Year-over-year growth 2023-2028 (%)
      • Exhibit 59: Data Table on Food and beverages - Year-over-year growth 2023-2028 (%)
    • 7.5 Healthcare - Market size and forecast 2023-2028
      • Exhibit 60: Chart on Healthcare - Market size and forecast 2023-2028 ($ million)
      • Exhibit 61: Data Table on Healthcare - Market size and forecast 2023-2028 ($ million)
      • Exhibit 62: Chart on Healthcare - Year-over-year growth 2023-2028 (%)
      • Exhibit 63: Data Table on Healthcare - Year-over-year growth 2023-2028 (%)
    • 7.6 Others - Market size and forecast 2023-2028
      • Exhibit 64: Chart on Others - Market size and forecast 2023-2028 ($ million)
      • Exhibit 65: Data Table on Others - Market size and forecast 2023-2028 ($ million)
      • Exhibit 66: Chart on Others - Year-over-year growth 2023-2028 (%)
      • Exhibit 67: Data Table on Others - Year-over-year growth 2023-2028 (%)
    • 7.7 Market opportunity by Application
      • Exhibit 68: Market opportunity by Application ($ million)
      • Exhibit 69: Data Table on Market opportunity by Application ($ million)

    8 Customer Landscape

    • 8.1 Customer landscape overview
      • Exhibit 70: Analysis of price sensitivity, lifecycle, customer purchase basket, adoption rates, and purchase criteria

    9 Geographic Landscape

    • 9.1 Geographic segmentation
      • Exhibit 71: Chart on Market share by geography 2023-2028 (%)
      • Exhibit 72: Data Table on Market share by geography 2023-2028 (%)
    • 9.2 Geographic comparison
      • Exhibit 73: Chart on Geographic comparison
      • Exhibit 74: Data Table on Geographic comparison
    • 9.3 North America - Market size and forecast 2023-2028
      • Exhibit 75: Chart on North America - Market size and forecast 2023-2028 ($ million)
      • Exhibit 76: Data Table on North America - Market size and forecast 2023-2028 ($ million)
      • Exhibit 77: Chart on North America - Year-over-year growth 2023-2028 (%)
      • Exhibit 78: Data Table on North America - Year-over-year growth 2023-2028 (%)
    • 9.4 Europe - Market size and forecast 2023-2028
      • Exhibit 79: Chart on Europe - Market size and forecast 2023-2028 ($ million)
      • Exhibit 80: Data Table on Europe - Market size and forecast 2023-2028 ($ million)
      • Exhibit 81: Chart on Europe - Year-over-year growth 2023-2028 (%)
      • Exhibit 82: Data Table on Europe - Year-over-year growth 2023-2028 (%)
    • 9.5 APAC - Market size and forecast 2023-2028
      • Exhibit 83: Chart on APAC - Market size and forecast 2023-2028 ($ million)
      • Exhibit 84: Data Table on APAC - Market size and forecast 2023-2028 ($ million)
      • Exhibit 85: Chart on APAC - Year-over-year growth 2023-2028 (%)
      • Exhibit 86: Data Table on APAC - Year-over-year growth 2023-2028 (%)
    • 9.6 South America - Market size and forecast 2023-2028
      • Exhibit 87: Chart on South America - Market size and forecast 2023-2028 ($ million)
      • Exhibit 88: Data Table on South America - Market size and forecast 2023-2028 ($ million)
      • Exhibit 89: Chart on South America - Year-over-year growth 2023-2028 (%)
      • Exhibit 90: Data Table on South America - Year-over-year growth 2023-2028 (%)
    • 9.7 Middle East and Africa - Market size and forecast 2023-2028
      • Exhibit 91: Chart on Middle East and Africa - Market size and forecast 2023-2028 ($ million)
      • Exhibit 92: Data Table on Middle East and Africa - Market size and forecast 2023-2028 ($ million)
      • Exhibit 93: Chart on Middle East and Africa - Year-over-year growth 2023-2028 (%)
      • Exhibit 94: Data Table on Middle East and Africa - Year-over-year growth 2023-2028 (%)
    • 9.8 US - Market size and forecast 2023-2028
      • Exhibit 95: Chart on US - Market size and forecast 2023-2028 ($ million)
      • Exhibit 96: Data Table on US - Market size and forecast 2023-2028 ($ million)
      • Exhibit 97: Chart on US - Year-over-year growth 2023-2028 (%)
      • Exhibit 98: Data Table on US - Year-over-year growth 2023-2028 (%)
    • 9.9 China - Market size and forecast 2023-2028
      • Exhibit 99: Chart on China - Market size and forecast 2023-2028 ($ million)
      • Exhibit 100: Data Table on China - Market size and forecast 2023-2028 ($ million)
      • Exhibit 101: Chart on China - Year-over-year growth 2023-2028 (%)
      • Exhibit 102: Data Table on China - Year-over-year growth 2023-2028 (%)
    • 9.10 Germany - Market size and forecast 2023-2028
      • Exhibit 103: Chart on Germany - Market size and forecast 2023-2028 ($ million)
      • Exhibit 104: Data Table on Germany - Market size and forecast 2023-2028 ($ million)
      • Exhibit 105: Chart on Germany - Year-over-year growth 2023-2028 (%)
      • Exhibit 106: Data Table on Germany - Year-over-year growth 2023-2028 (%)
    • 9.11 UK - Market size and forecast 2023-2028
      • Exhibit 107: Chart on UK - Market size and forecast 2023-2028 ($ million)
      • Exhibit 108: Data Table on UK - Market size and forecast 2023-2028 ($ million)
      • Exhibit 109: Chart on UK - Year-over-year growth 2023-2028 (%)
      • Exhibit 110: Data Table on UK - Year-over-year growth 2023-2028 (%)
    • 9.12 India - Market size and forecast 2023-2028
      • Exhibit 111: Chart on India - Market size and forecast 2023-2028 ($ million)
      • Exhibit 112: Data Table on India - Market size and forecast 2023-2028 ($ million)
      • Exhibit 113: Chart on India - Year-over-year growth 2023-2028 (%)
      • Exhibit 114: Data Table on India - Year-over-year growth 2023-2028 (%)
    • 9.13 Market opportunity by geography
      • Exhibit 115: Market opportunity by geography ($ million)
      • Exhibit 116: Data Tables on Market opportunity by geography ($ million)

    10 Drivers, Challenges, and Trends

    • 10.1 Market drivers
      • 10.2 Market challenges
        • 10.3 Impact of drivers and challenges
          • Exhibit 117: Impact of drivers and challenges in 2023 and 2028
        • 10.4 Market trends

          11 Vendor Landscape

          • 11.1 Overview
            • 11.2 Vendor landscape
              • Exhibit 118: Overview on Criticality of inputs and Factors of differentiation
            • 11.3 Landscape disruption
              • Exhibit 119: Overview on factors of disruption
            • 11.4 Industry risks
              • Exhibit 120: Impact of key risks on business

            12 Vendor Analysis

            • 12.1 Vendors covered
              • Exhibit 121: Vendors covered
            • 12.2 Market positioning of vendors
              • Exhibit 122: Matrix on vendor position and classification
            • 12.3 Accepta Ltd.
              • Exhibit 123: Accepta Ltd. - Overview
              • Exhibit 124: Accepta Ltd. - Product / Service
              • Exhibit 125: Accepta Ltd. - Key offerings
            • 12.4 AquaPulse Systems
              • Exhibit 126: AquaPulse Systems - Overview
              • Exhibit 127: AquaPulse Systems - Product / Service
              • Exhibit 128: AquaPulse Systems - Key offerings
            • 12.5 Beckart Environmental International Ltd.
              • Exhibit 129: Beckart Environmental International Ltd. - Overview
              • Exhibit 130: Beckart Environmental International Ltd. - Product / Service
              • Exhibit 131: Beckart Environmental International Ltd. - Key offerings
            • 12.6 DuPont de Nemours Inc.
              • Exhibit 132: DuPont de Nemours Inc. - Overview
              • Exhibit 133: DuPont de Nemours Inc. - Business segments
              • Exhibit 134: DuPont de Nemours Inc. - Key news
              • Exhibit 135: DuPont de Nemours Inc. - Key offerings
              • Exhibit 136: DuPont de Nemours Inc. - Segment focus
            • 12.7 Ecolab Inc.
              • Exhibit 137: Ecolab Inc. - Overview
              • Exhibit 138: Ecolab Inc. - Business segments
              • Exhibit 139: Ecolab Inc. - Key news
              • Exhibit 140: Ecolab Inc. - Key offerings
              • Exhibit 141: Ecolab Inc. - Segment focus
            • 12.8 Grundfos Holding AS
              • Exhibit 142: Grundfos Holding AS - Overview
              • Exhibit 143: Grundfos Holding AS - Product / Service
              • Exhibit 144: Grundfos Holding AS - Key news
              • Exhibit 145: Grundfos Holding AS - Key offerings
            • 12.9 Kemin Industries Inc.
              • Exhibit 146: Kemin Industries Inc. - Overview
              • Exhibit 147: Kemin Industries Inc. - Product / Service
              • Exhibit 148: Kemin Industries Inc. - Key offerings
            • 12.10 Kurita Water Industries Ltd.
              • Exhibit 149: Kurita Water Industries Ltd. - Overview
              • Exhibit 150: Kurita Water Industries Ltd. - Business segments
              • Exhibit 151: Kurita Water Industries Ltd. - Key offerings
              • Exhibit 152: Kurita Water Industries Ltd. - Segment focus
            • 12.11 Lanxess AG
              • Exhibit 153: Lanxess AG - Overview
              • Exhibit 154: Lanxess AG - Business segments
              • Exhibit 155: Lanxess AG - Key offerings
              • Exhibit 156: Lanxess AG - Segment focus
            • 12.12 Lenntech BV
              • Exhibit 157: Lenntech BV - Overview
              • Exhibit 158: Lenntech BV - Product / Service
              • Exhibit 159: Lenntech BV - Key offerings
            • 12.13 ProMinent GmbH
              • Exhibit 160: ProMinent GmbH - Overview
              • Exhibit 161: ProMinent GmbH - Product / Service
              • Exhibit 162: ProMinent GmbH - Key offerings
            • 12.14 Quip Labs
              • Exhibit 163: Quip Labs - Overview
              • Exhibit 164: Quip Labs - Product / Service
              • Exhibit 165: Quip Labs - Key offerings
            • 12.15 Scotmas Group Ltd.
              • Exhibit 166: Scotmas Group Ltd. - Overview
              • Exhibit 167: Scotmas Group Ltd. - Product / Service
              • Exhibit 168: Scotmas Group Ltd. - Key offerings
            • 12.16 The Lubrizol Corp.
              • Exhibit 169: The Lubrizol Corp. - Overview
              • Exhibit 170: The Lubrizol Corp. - Product / Service
              • Exhibit 171: The Lubrizol Corp. - Key offerings
            • 12.17 Xylem Inc.
              • Exhibit 172: Xylem Inc. - Overview
              • Exhibit 173: Xylem Inc. - Business segments
              • Exhibit 174: Xylem Inc. - Key offerings
              • Exhibit 175: Xylem Inc. - Segment focus

            13 Appendix

            • 13.1 Scope of the report
              • 13.2 Inclusions and exclusions checklist
                • Exhibit 176: Inclusions checklist
                • Exhibit 177: Exclusions checklist
              • 13.3 Currency conversion rates for US$
                • Exhibit 178: Currency conversion rates for US$
              • 13.4 Research methodology
                • Exhibit 179: Research methodology
                • Exhibit 180: Validation techniques employed for market sizing
                • Exhibit 181: Information sources
              • 13.5 List of abbreviations
                • Exhibit 182: List of abbreviations

              Research Methodology

              Technavio presents a detailed picture of the market by way of study, synthesis, and summation of data from multiple sources. The analysts have presented the various facets of the market with a particular focus on identifying the key industry influencers. The data thus presented is comprehensive, reliable, and the result of extensive research, both primary and secondary.

              INFORMATION SOURCES

              Primary sources

              • Manufacturers and suppliers
              • Channel partners
              • Industry experts
              • Strategic decision makers

              Secondary sources

              • Industry journals and periodicals
              • Government data
              • Financial reports of key industry players
              • Historical data
              • Press releases

              DATA ANALYSIS

              Data Synthesis

              • Collation of data
              • Estimation of key figures
              • Analysis of derived insights

              Data Validation

              • Triangulation with data models
              • Reference against proprietary databases
              • Corroboration with industry experts

              REPORT WRITING

              Qualitative

              • Market drivers
              • Market challenges
              • Market trends
              • Five forces analysis

              Quantitative

              • Market size and forecast
              • Market segmentation
              • Geographical insights
              • Competitive landscape

              Interested in this report?

              Get your sample now to see our research methodology and insights!

              Download Now

              Frequently Asked Questions

              Chlorine Dioxide Disinfectant market growth will increase by $ 276.59 mn during 2024-2028.

              The Chlorine Dioxide Disinfectant market is expected to grow at a CAGR of 5.9% during 2024-2028.

              Chlorine Dioxide Disinfectant market is segmented by Type( Liquid, Gas, Solid) Application( Water treatment, Food and beverages, Healthcare, Others)

              Accepta Ltd., AquaPulse Systems, Beckart Environmental International Ltd., DuPont de Nemours Inc., Ecolab Inc., Feedwater Ltd., Grundfos Holding AS, Kemin Industries Inc., Kurita Water Industries Ltd., Lanxess AG, Lenntech BV, Nitto Denko Corp., ProMinent GmbH, Quip Labs, Scotmas Group Ltd., SVS Aqua Technologies, The Lubrizol Corp., VASU CHEMICALS LLP, Veolia Environnement SA, Xylem Inc. are a few of the key vendors in the Chlorine Dioxide Disinfectant market.

              North America will register the highest growth rate of 32% among the other regions. Therefore, the Chlorine Dioxide Disinfectant market in North America is expected to garner significant business opportunities for the vendors during the forecast period.

              US, China, India, Germany, UK

              • Increased government regulations regarding disinfection in hospitalsThe increasing number of cases of HAIs has led regulatory bodies to implement regulations regarding disinfection in hospitals. The regulatory bodies are the Centers for Disease Control and Prevention (CDC) of the US Department of Health and Human Services is the driving factor this market.
              • the Occupational Safety and Health Administration (OSHA) is the driving factor this market.
              • and the US EPA. These organizations urge hospital administration to use proper disinfectants to reduce the number of infections caused by HAI. Toolboxes is the driving factor this market.
              • surfaces is the driving factor this market.
              • and medical and lab equipment can all be sterilized with chlorine dioxide disinfectant. Chlorine dioxide can be used as a disinfectant. Pathogenic microorganisms such as bacteria is the driving factor this market.
              • viruses is the driving factor this market.
              • and fungi are efficiently eliminated by this potent disinfectant. According to the regulations by the Occupational Safety and Health Administration (OSHA) is the driving factor this market.
              • hospitals must ensure a clean and sanitary environment for patients to avoid contact with blood or other potentially infectious materials (OPIM). Bloodborne Pathogens Standard [29 CFR 1910.1030(d)(4)(i)] states that healthcare settings shall ensure that the worksite is clean. Based on the area's tasks or procedures is the driving factor this market.
              • the location within the facility is the driving factor this market.
              • and the surface to be cleaned is the driving factor this market.
              • the employer must decide and implement a suitable documented timetable for cleaning and decontamination. OSHA's standard 1910.1030(d)(4)(ii)(A) requires that work surfaces in hospitals must be cleaned with appropriate disinfectants. OSHA's standard 1910.1030(d)(4)(ii) states that all equipment and environmental and working surfaces shall be cleaned and decontaminated after contact with blood or other potentially infectious materials. In July 2023 is the driving factor this market.
              • the FDA recognized several consensus standards on sterilization methods to advance innovation in sterilization processes. Additionally is the driving factor this market.
              • in April and May 2023 is the driving factor this market.
              • the FDA announced sterilization master file pilot programs. Thus is the driving factor this market.
              • increasing stringent regulations on ensuring cleanliness and hygiene have increased the use of disinfectants such as chlorine dioxide by hospital administrations. Such factors are expected to drive the growth of the global chlorine dioxide disinfectant market during the forecast period. is the driving factor this market.

              The Chlorine Dioxide Disinfectant market vendors should focus on grabbing business opportunities from the Liquid segment as it accounted for the largest market share in the base year.
              RIA - Research AI Assistant
              Ask RIA