
Chronic Lymphocytic Leukemia Therapeutics Market Size 2024-2028
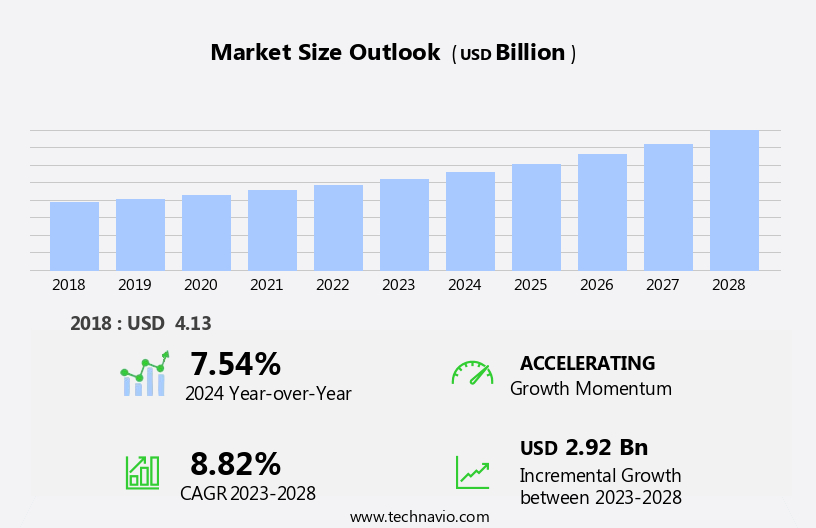
The chronic lymphocytic leukemia therapeutics market size is forecast to increase by USD 2.92 billion at a CAGR of 8.82% between 2023 and 2028.
- The CLL therapeutics market is experiencing significant growth due to several key factors. One of the primary drivers is the increasing research grants allocated towards the study of various blood cancers, including CLL. Additionally, special drug designations for CLL therapeutics have been granted by regulatory authorities, providing incentives for pharmaceutical companies to invest in research and development of medical technologies.
- However, the market also faces challenges, such as the adverse effects of chemotherapy drugs commonly used in CLL treatment. Patients often experience side effects like neutropenia, thrombocytopenia, and anemia, which can impact their quality of life and increase healthcare costs. Despite these challenges, advancements in targeted therapies and immunotherapy drugs offer promising opportunities for market growth. AbbVie Inc., a leading company offers chronic lymphocytic leukemia therapeutics product such as Venclyxto used in combination with obinutuzumab to treat adults with previously untreated CLL and Venclexta used to treat adults with CLL or small lymphocytic lymphoma.
What will be the Size of the Chronic Lymphocytic Leukemia Therapeutics Market During the Forecast Period?
- The chronic lymphocytic leukemia (CLL) therapeutics market encompasses a range of pharmacological treatments aimed at managing this malignancy of white blood cells in adults. The market is driven by the growing prevalence of CLL, particularly withIn the geriatric population, and the unmet medical need for effective and well-tolerated therapies. Novel innovative drugs, including targeted therapies such as BTK inhibitors and PI3K inhibitors, are gaining traction in the market due to their ability to selectively target specific proteins involved in CLL progression. Immunotherapies, such as monoclonal antibody drugs and CAR-T cell therapies, which harness the power of the immune system to attack cancer cells, are also making a significant impact.
- FDA-approved immunotherapies, like those targeting the CD20 antigen, have shown promising results in improving symptoms and extending survival in CLL patients. The Leukemia & Lymphoma Society reports that common symptoms of CLL include fatigue, fever, and increased risk of infections. The pipeline of new molecules in development continues to expand, offering hope for improved treatment options for those living with this chronic condition. The market trends and analysis report provides a comprehensive overview of these factors and their impact on the CLL therapeutics market.
How is this Chronic Lymphocytic Leukemia Therapeutics Industry segmented and which is the largest segment?
The chronic lymphocytic leukemia therapeutics industry research report provides comprehensive data (region-wise segment analysis), with forecasts and estimates in "USD billion" for the period 2024-2028, as well as historical data from 2018-2022 for the following segments.
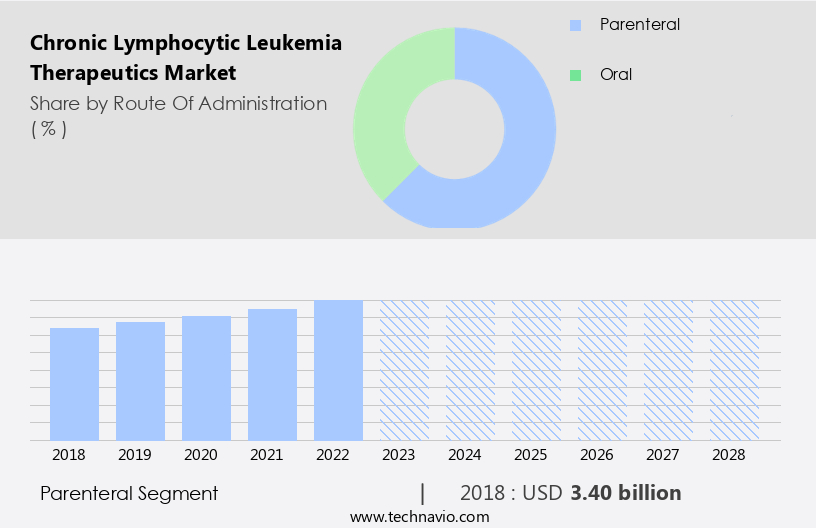
- Route Of Administration
- Parenteral
- Oral
- Therapy
- Chemotherapy
- Targeted
- Others
- Geography
- North America
- US
- Europe
- Germany
- UK
- Asia
- China
- Japan
- Rest of World (ROW)
- North America
By Route Of Administration Insights
- The parenteral segment is estimated to witness significant growth during the forecast period.
Get a glance at the Chronic Lymphocytic Leukemia Therapeutics Industry report of share of various segments Request Free Sample
The Parenteral segment was valued at USD 3.40 billion in 2018 and showed a gradual increase during the forecast period.
Regional Analysis
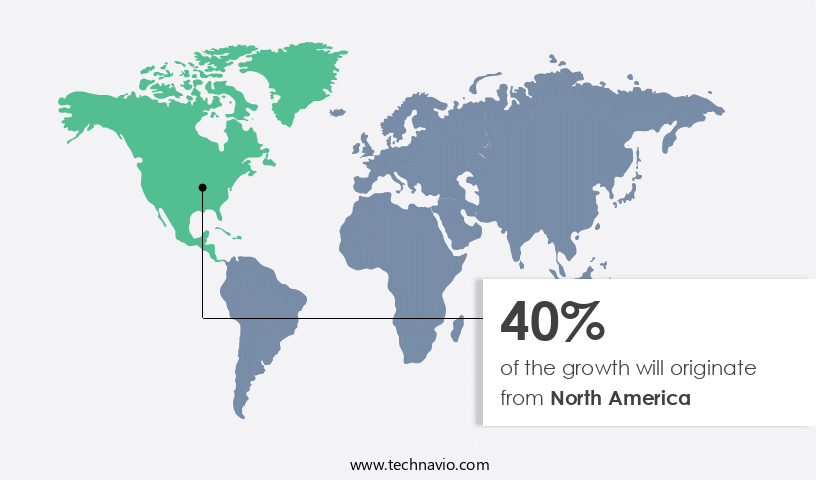
- North America is estimated to contribute 40% to the growth of the global market during the forecast period.
Technavio's analysts have elaborately explained the regional trends and drivers that shape the market during the forecast period.
For more insights on the market share of various regions, Request Free Sample
The Chronic Lymphocytic Leukemia (CLL) therapeutics market In the US is driven by the increasing prevalence of CLL and other blood cancers, leading to a higher demand for effective treatments. Notable market participants, such as AbbVie, Bristol Myers Squibb, and Pfizer, contribute significantly to the market growth through their approved CLL drugs. According to the National Institutes of Health (NIH), the incidence of blood cancer in the US has risen, resulting in a greater need for therapeutic interventions. Novel innovative drugs, including immunotherapies, targeted drugs, and monoclonal antibody therapies, are transforming CLL treatment. FDA-approved immunotherapy, CAR-T cell therapies, BTK inhibitors, and PI3K inhibitors are among the pipeline drugs showing promise.
Regenerative medicine and Personalized medicine are also emerging areas in CLL therapeutics. The geriatric population, which is disproportionately affected by CLL, further fuels market growth. Symptoms of CLL, such as fatigue, fever, infection, pain In the ribs, and weight loss, necessitate effective treatment. Despite advancements, the mortality rate for CLL remains high, underscoring the need for continued research and development.
Market Dynamics
Our researchers analyzed the data with 2023 as the base year, along with the key drivers, trends, and challenges. A holistic analysis of drivers will help companies refine their marketing strategies to gain a competitive advantage.
What are the key market drivers leading to the rise In the adoption of Chronic Lymphocytic Leukemia Therapeutics Industry?
Increasing research grants for different blood cancers is the key driver of the market.
- Chronic Lymphocytic Leukemia (CLL), a type of malignancy affecting adults, primarily targets the white blood cells In the bone marrow and lymph nodes. This condition, characterized by fatigue, fever, infection, pain In the ribs, and weight loss, is prevalent among males and females, with a higher incidence In the geriatric population. The current treatment landscape for CLL includes chemotherapy, targeted drugs, monoclonal antibody therapies, radiation therapy, and splenectomy. The FDA has approved immunotherapies, such as the monoclonal antibody drug, rituximab, and the BTK inhibitor, ibrutinib. Additionally, pipeline drugs like PI3K inhibitors, CD20 antigen-targeted therapies, and BCL-2 inhibitors are under development.
- Regenerative medicine and personalized medicine approaches, such as CAR-T cell therapies, are also under investigation. The market for CLL therapeutics is witnessing significant advancements with the development of novel drugs and innovative treatments. Immunotherapies and targeted therapies, including monoclonal antibody drugs, are gaining popularity due to their potential to improve patient outcomes and reduce side effects. However, the high cost and limited availability of these therapies pose challenges to their widespread adoption. The Leukemia & Lymphoma Society reports that the mortality rate for CLL is relatively low compared to acute leukemia. Despite this, the condition significantly impacts the quality of life of those diagnosed.
- The need for effective and accessible treatments for CLL remains a priority for patients and healthcare providers alike. In conclusion, the market for CLL therapeutics is dynamic, with a focus on the development of novel drugs and innovative treatments. The challenges posed by the rare nature of the condition and the high cost of advanced therapies necessitate continued research and collaboration between industry players, regulatory bodies, and healthcare organizations.
What are the market trends shaping the Chronic Lymphocytic Leukemia Therapeutics Industry?
Special drug designations for chronic lymphocytic leukemia therapeutics is the upcoming market trend.
- Chronic lymphocytic leukemia (CLL), a malignancy affecting adults, primarily targets white blood cells known as lymphocytes. Novel and innovative drugs, including immunotherapies and targeted therapies, are transforming CLL treatment. The geriatric population, which is disproportionately affected, benefits significantly from these advancements. FDA-approved immunotherapies, such as monoclonal antibody therapies that target the CD20 antigen, have revolutionized treatment. Additionally, pipeline drugs like BTK inhibitors and PI3K inhibitors hold promise. Regenerative medicine and personalized medicine are also emerging areas of interest. Symptoms of CLL include fatigue, fever, infection, pain In the ribs, and weight loss. Causes include genetic and environmental factors.
- Acute leukemia, a different type of leukemia, affects males and females equally, while Asian populations are more susceptible. Treatment options include drug therapy, targeted therapies, monoclonal antibody therapies, radiation therapy, and splenectomy. Mortality rate remains high, underscoring the need for continued research and development. The therapeutics landscape is evolving, with viruses and pipeline molecules, such as CAR-T cell therapies, offering potential solutions. Pharmacological treatments are a critical component of managing CLL.
What challenges does the Chronic Lymphocytic Leukemia Therapeutics Industry face during its growth?
Adverse effects of chemotherapy drugs is a key challenge affecting the industry growth.
- Chronic Lymphocytic Leukemia (CLL), a type of malignancy affecting white blood cells, primarily targets adults, with a higher prevalence among males and Asian populations. The current treatment landscape for CLL is evolving, with a focus on novel, innovative drugs and immunotherapies. These include targeted drugs like BTK inhibitors and PI3K inhibitors, monoclonal antibody therapies against the CD20 antigen, and CAR-T cell therapies. The FDA-approval of the first-in-class FDA-approved immunotherapy, ibrutinib, and the emergence of regenerative medicine and personalized medicine approaches, have brought significant advancements in CLL treatment. However, chemotherapy remains a common therapeutic approach, targeting rapidly dividing cells, leading to side effects such as fatigue, fever, infection, pain, and weight loss.
- The pipeline is rich with branded drugs and pharmacological treatments, including monoclonal antibody drugs and targeted therapy molecules like BTK inhibitors and PI3K inhibitors. Viruses, such as viral vector-based therapies, are also under investigation. The Leukemia & Lymphoma Society continues to support research and development efforts to improve patient outcomes and reduce the mortality rate associated with CLL.
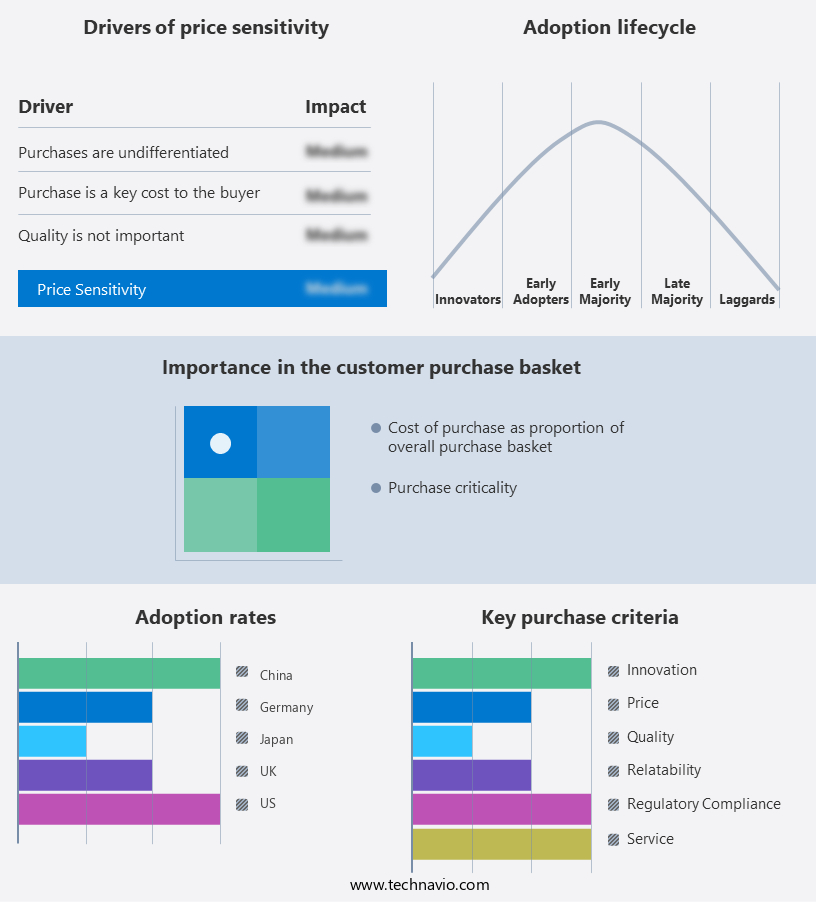
Exclusive Customer Landscape
The chronic lymphocytic leukemia therapeutics market forecasting report includes the adoption lifecycle of the market, covering from the innovator's stage to the laggard's stage. It focuses on adoption rates in different regions based on penetration. Furthermore, the chronic lymphocytic leukemia therapeutics market report also includes key purchase criteria and drivers of price sensitivity to help companies evaluate and develop their market growth analysis strategies.
Customer Landscape
Key Companies & Market Insights
Companies are implementing various strategies, such as strategic alliances, chronic lymphocytic leukemia therapeutics market forecast, partnerships, mergers and acquisitions, geographical expansion, and product/service launches, to enhance their presence In the industry.
The industry research and growth report includes detailed analyses of the competitive landscape of the market and information about key companies, including:
- AbbVie Inc.
- Amgen Inc.
- AstraZeneca PLC
- Biogen Inc.
- Bristol-Myers Squibb Company
- F. Hoffmann La Roche Ltd.
- Gilead Sciences Inc.
- GlaxoSmithKline Plc
- Novartis AG
- Pfizer Inc.
- R2T BIOPHARMA INC
- Sanofi SA
- Takeda Pharmaceutical Co. Ltd.
- Teva Pharmaceutical Industries Ltd.
Qualitative and quantitative analysis of companies has been conducted to help clients understand the wider business environment as well as the strengths and weaknesses of key industry players. Data is qualitatively analyzed to categorize companies as pure play, category-focused, industry-focused, and diversified; it is quantitatively analyzed to categorize companies as dominant, leading, strong, tentative, and weak.
Research Analyst Overview
Chronic lymphocytic leukemia (CLL) is a type of malignancy that affects the production and function of white blood cells In the bone marrow and lymph nodes. This condition is characterized by the accumulation of abnormal lymphocytes, leading to various symptoms such as fatigue, fever, infection, pain In the ribs, and weight loss. The global therapeutics market for CLL is witnessing significant growth due to the development of novel, innovative drugs and advanced treatment modalities. One of the most promising areas of research in CLL therapeutics is immunotherapies. These treatments harness the body's own immune system to target and destroy cancer cells.
FDA-approved immunotherapy options for CLL include monoclonal antibody therapies that target specific antigens, such as the CD20 antigen, and B-cell receptor signaling pathway inhibitors, like BTK inhibitors and PI3K inhibitors. Another area of focus in CLL therapeutics is targeted drugs. These treatments are designed to specifically target cancer cells while minimizing damage to healthy cells. Monoclonal antibody drugs, such as those mentioned above, are a type of targeted therapy that have shown promising results In the treatment of CLL. Regenerative medicine and personalized medicine are also emerging areas of interest In the CLL therapeutics market. Regenerative medicine aims to replace or regenerate damaged or diseased cells, tissues, or organs, while personalized medicine tailors treatment to an individual's unique genetic makeup.
Both approaches hold the potential to revolutionize the way CLL is diagnosed and treated. The geriatric population represents a significant portion of the CLL patient population, making the development of safe and effective treatments a priority. The Leukemia & Lymphoma Society and other organizations are actively funding research in this area to improve outcomes for older adults with CLL. Despite advances in CLL therapeutics, challenges remain. Mortality rate remains high, particularly in advanced stages of the disease. The pipeline drugs and molecules under development offer hope for improved treatment options and better outcomes for patients. In conclusion, the CLL therapeutics market is experiencing significant growth due to the development of innovative drugs, immunotherapies, targeted therapies, and other advanced treatment modalities. The focus on personalized medicine and regenerative medicine holds the potential to further improve outcomes for patients. The challenge of addressing the high mortality rate in advanced stages of the disease remains, but the pipeline drugs and molecules under development offer hope for improved treatment options.
|
Market Scope |
|
|
Report Coverage |
Details |
|
Page number |
155 |
|
Base year |
2023 |
|
Historic period |
2018-2022 |
|
Forecast period |
2024-2028 |
|
Growth momentum & CAGR |
Accelerate at a CAGR of 8.82% |
|
Market growth 2024-2028 |
USD 2.92 billion |
|
Market structure |
Concentrated |
|
YoY growth 2023-2024(%) |
7.54 |
|
Key countries |
US, Germany, UK, China, and Japan |
|
Competitive landscape |
Leading Companies, Market Positioning of Companies, Competitive Strategies, and Industry Risks |
What are the Key Data Covered in this Chronic Lymphocytic Leukemia Therapeutics Market Research and Growth Report?
- CAGR of the Chronic Lymphocytic Leukemia Therapeutics industry during the forecast period
- Detailed information on factors that will drive the growth and forecasting between 2024 and 2028
- Precise estimation of the size of the market and its contribution of the industry in focus to the parent market
- Accurate predictions about upcoming growth and trends and changes in consumer behaviour
- Growth of the market across North America, Europe, Asia, and Rest of World (ROW)
- Thorough analysis of the market's competitive landscape and detailed information about companies
- Comprehensive analysis of factors that will challenge the chronic lymphocytic leukemia therapeutics market growth of industry companies
We can help! Our analysts can customize this chronic lymphocytic leukemia therapeutics market research report to meet your requirements.
 RIA -
RIA - 
