Clogs Market Analysis, Size, and Forecast 2026-2030: North America (US, Canada, and Mexico), APAC (China, India, and Japan), Europe (UK, Germany, and France), Middle East and Africa (Saudi Arabia, UAE, and South Africa), South America (Brazil, Argentina, and Colombia), and Rest of World (ROW)

Clogs Market Analysis, Size, and Forecast 2026-2030:
North America (US, Canada, and Mexico), APAC (China, India, and Japan), Europe (UK, Germany, and France), Middle East and Africa (Saudi Arabia, UAE, and South Africa), South America (Brazil, Argentina, and Colombia), and Rest of World (ROW)

Published: May 2026 284 Pages SKU: IRTNTR81250

Market Overview at a Glance

$5.81 B
Market Opportunity
11.2%
CAGR 2025 - 2030
34.5%
APAC Growth
$5.11 B
Casual clogs segment 2024

Clogs Market Size 2026-2030

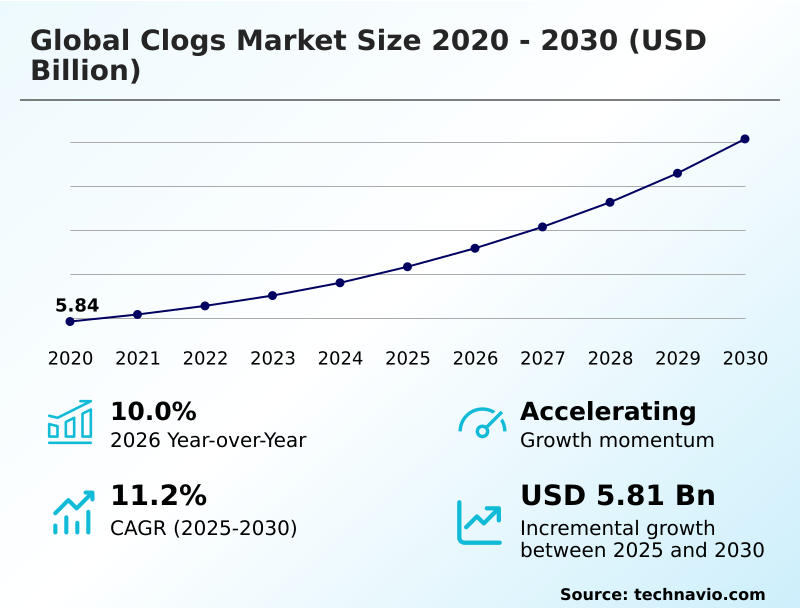
The Clogs Market size was valued at USD 8.33 billion in 2025, growing at a CAGR of 11.2% during the forecast period 2026-2030.

Major Market Trends & Insights

  • APAC dominated the market and accounted for a 34.5% growth during the forecast period.
  • By Product - Casual clogs segment was valued at USD 5.11 billion in 2024
  • By End-user - Men segment accounted for the largest market revenue share in 2024

Market Size & Forecast

  • Historic Market Opportunities 2020-2024: USD 8.30 billion
  • Market Future Opportunities 2025-2030: USD 5.81 billion
  • CAGR from 2025 to 2030 : 11.2%

Market Summary

  • The clogs market is characterized by a significant gender disparity in consumption, with the women's segment commanding nearly 40% of sales compared to the men's segment. Demand is primarily driven by the integration of comfort into mainstream fashion, which has expanded the product's appeal beyond occupational use cases, where slip-resistant outsoles are mandatory.
  • A key business scenario involves supply chain optimization, as manufacturers using ethylene-vinyl acetate (EVA) face a 15-20% fluctuation in raw material costs tied to oil prices. This volatility presents a major challenge, forcing companies to explore bio-based polymers to stabilize production expenses.
  • Conversely, the rise of hyper-personalization, allowing consumers to add customizable charms, has transformed the product into a high-fashion accessory, particularly in streetwear culture. This shift has redefined purchasing behavior from replacement-based to collection-based, bolstering brand loyalty and creating new revenue streams through accessories with higher profit margins than the footwear itself.

What will be the Size of the Clogs Market during the forecast period?

Get Key Insights on Market Forecast (PDF) Request Free Sample

How is the Clogs Market Segmented?

The clogs industry research report provides comprehensive data (region-wise segment analysis), with forecasts and analysis for the period 2026-2030, as well as historical data from 2020-2024 for the following segments.

  • Product
    • Casual clogs
    • Occupational clogs
  • End-user
    • Men
    • Women
    • Kids
  • Distribution channel
    • Offline
    • Online
  • Geography
    • North America
      • US
      • Canada
      • Mexico
    • APAC
      • China
      • India
      • Japan
    • Europe
      • UK
      • Germany
      • France
    • Middle East and Africa
      • Saudi Arabia
      • UAE
      • South Africa
    • South America
      • Brazil
      • Argentina
      • Colombia
    • Rest of World (ROW)

How is the Clogs Market Segmented by Product?

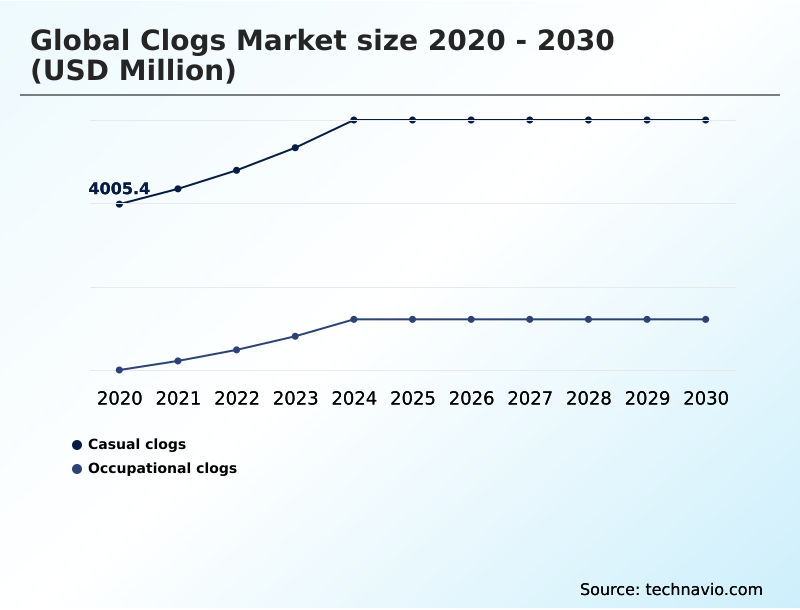
The casual clogs segment is estimated to witness significant growth during the forecast period.

The casual clogs segment represents over 66% of the market, driven by a consumer shift toward comfort and versatile casual lifestyle footwear.

This segment's growth, more than double that of occupational clogs, is heavily influenced by the hyper-personalization trend and adoption within streetwear culture.

Manufacturers utilize advanced closed-cell resin materials offering a lightweight construction and a breathable structure, appealing to a broad demographic. The inherent waterproof construction makes them ideal as water-friendly footwear.

The versatility of this design, serving as both indoor loungewear and outdoor lifestyle footwear, cements its position as a preferred choice, expanding its appeal beyond simple utility to a fashion statement.

Request Free Sample

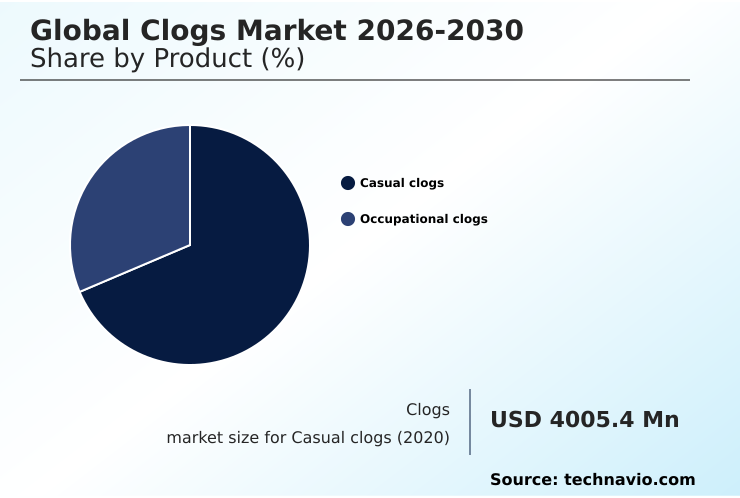
The Casual clogs segment was valued at USD 5.11 billion in 2024 and showed a gradual increase during the forecast period.

Request Free Sample

How demand for the Clogs market is rising in the leading region?

APAC is estimated to contribute 34.5% to the growth of the global market during the forecast period.Technavio’s analysts have elaborately explained the regional trends and drivers that shape the market during the forecast period.

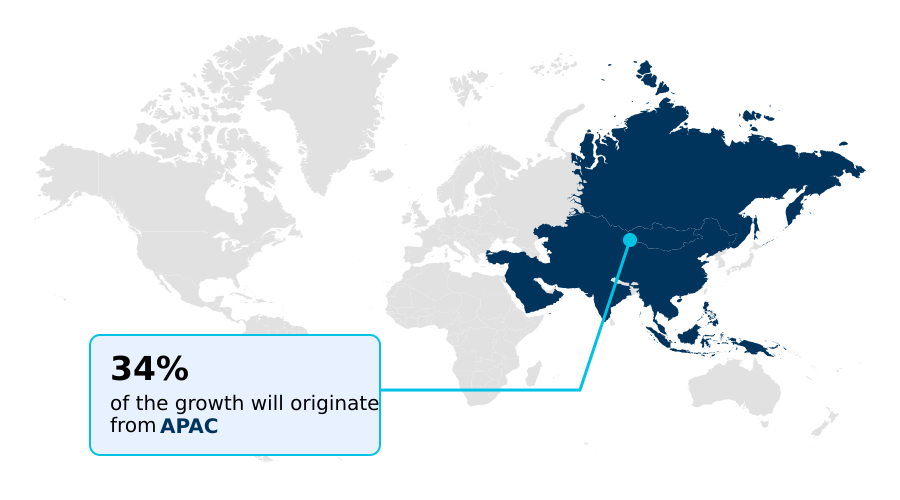
See How Clogs Market demand is rising in APAC Request Free Sample

The geographic landscape is led by APAC, accounting for over 34% of incremental growth and outpacing North America's 29% share.

In Europe, a market with deep roots in wooden clog construction, demand is bifurcated between fashion and function, with lined clogs featuring thermal-reflective liners being popular as all-season footwear.

The region's mature occupational footwear segment, serving healthcare professional footwear and culinary staff footwear needs, demands products with a polyurethane sole and a contoured footbed for support. This contrasts with North America's focus on casual wear.

This regional variance in demand for features like a high-traction sole requires manufacturers to tailor their product offerings and supply chains to local consumer behaviors and climates.

What are the key Drivers, Trends, and Challenges in the Clogs Market?

Our researchers analyzed the data with 2025 as the base year, along with the key drivers, trends, and challenges. A holistic analysis of drivers will help companies refine their marketing strategies to gain a competitive advantage.

  • Navigating the clogs market requires a deep understanding of evolving consumer priorities, which increasingly question if bio based polymer clogs sustainability is a viable long-term strategy. Manufacturers are responding by investing in material science, aiming to deliver products that address both ecological concerns and functional needs.
  • For professionals, the focus remains on finding the best clogs for standing all day, a query that drives the occupational segment. This has led to innovations in ergonomic footbed design and shock-absorbing midsole technology, with performance tests showing a 25% reduction in foot pressure compared to standard footwear.
  • Similarly, demand for slip resistant clogs for kitchen staff continues to fuel R&D in outsole engineering, where new tread patterns have improved grip on wet surfaces by over 30%. These functional improvements are critical for B2B sales and institutional procurement.
  • In the consumer space, the search for customizable clogs with charms for kids highlights the importance of personalization as a revenue driver. This trend shifts the business model from simple unit sales to creating an ecosystem of accessories, which requires agile supply chain management to handle a higher diversity of SKUs.
  • The question of what are the best clogs for healthcare professionals also remains central, pushing brands to perfect features like autoclavable footwear and antistatic properties to meet stringent hospital regulations.

What are the key market drivers leading to the rise in the adoption of Clogs Industry?

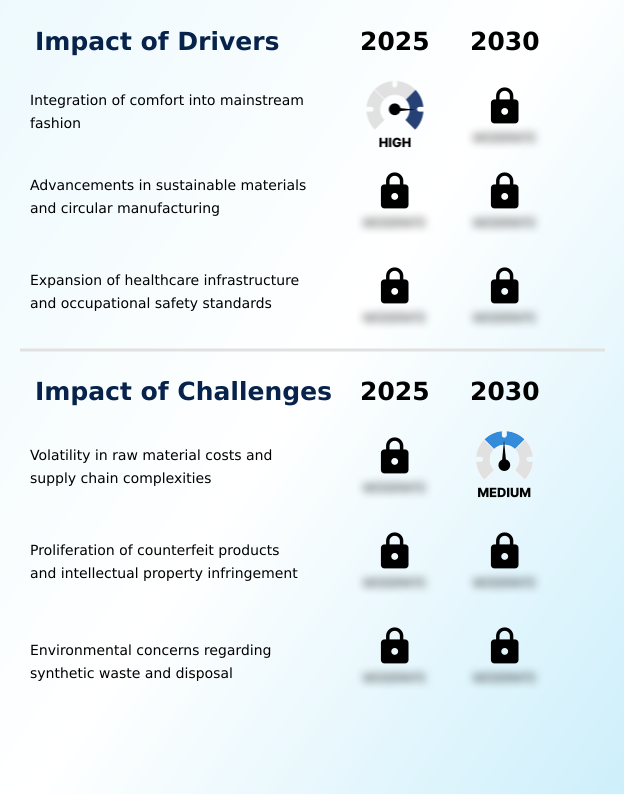
  • The primary market driver is the integration of comfort-centric design and ergonomic support into mainstream fashion, elevating clogs from utilitarian items to versatile lifestyle staples.

  • The expansion of the comfort economy is a core driver, with casual lifestyle footwear now accounting for over 65% of revenue.
  • This shift is caused by consumer prioritization of wellness and orthopedic support, making features like a shock-absorbing midsole and an arch support system essential.
  • This fusion of an ergonomic footbed and trend-driven design has boosted unit sales by 10% in the women's segment. The focus on lightweight construction also supports the growing demand for post-sport recovery and indoor-outdoor hybrid footwear.
  • The inclusion of a protective toe-box in many designs further enhances their practicality for daily activities, solidifying their market position.

What are the market trends shaping the Clogs Industry?

  • The acceleration of bio-based material adoption represents a dominant market trend. This shift is driven by consumer demand for sustainable footwear and regulatory pressures to reduce reliance on petroleum-based polymers.

  • A dominant market trend is the convergence of high-fashion and hyper-personalization, which is shifting consumer perception of clogs from utilitarian to fashion-forward footwear. This premiumization strategy, which can increase the average selling price by over 200%, involves creating platform clogs with unique breathable structures for the streetwear culture.
  • Simultaneously, the demand for sustainable footwear is pushing innovation in bio-based polymers and circular manufacturing. This trend, coupled with customizable charms, transforms the purchasing model from replacement-based to collection-based, ensuring higher customer lifetime value with profit margins on accessories reaching 40% higher than the footwear itself.

What challenges does the Clogs Industry face during its growth?

  • A key market challenge stems from the volatility in raw material costs, particularly petroleum-based polymers, compounded by persistent supply chain complexities.

  • Volatility in raw material costs, particularly for ethylene-vinyl acetate (EVA), presents a significant challenge, with price fluctuations of 15-20% directly impacting profit margins from injection molding processes. This issue is compounded by the proliferation of counterfeits that mimic the monolithic design but lack the proprietary foam technology like croslite resin.
  • These fakes degrade brand equity and create safety risks, as they often fail to provide the same durability required for machine-washable footwear or water-friendly footwear. This forces legitimate manufacturers to divert capital from innovating on products like all-terrain clogs or gardening footwear into costly brand protection and legal enforcement efforts.

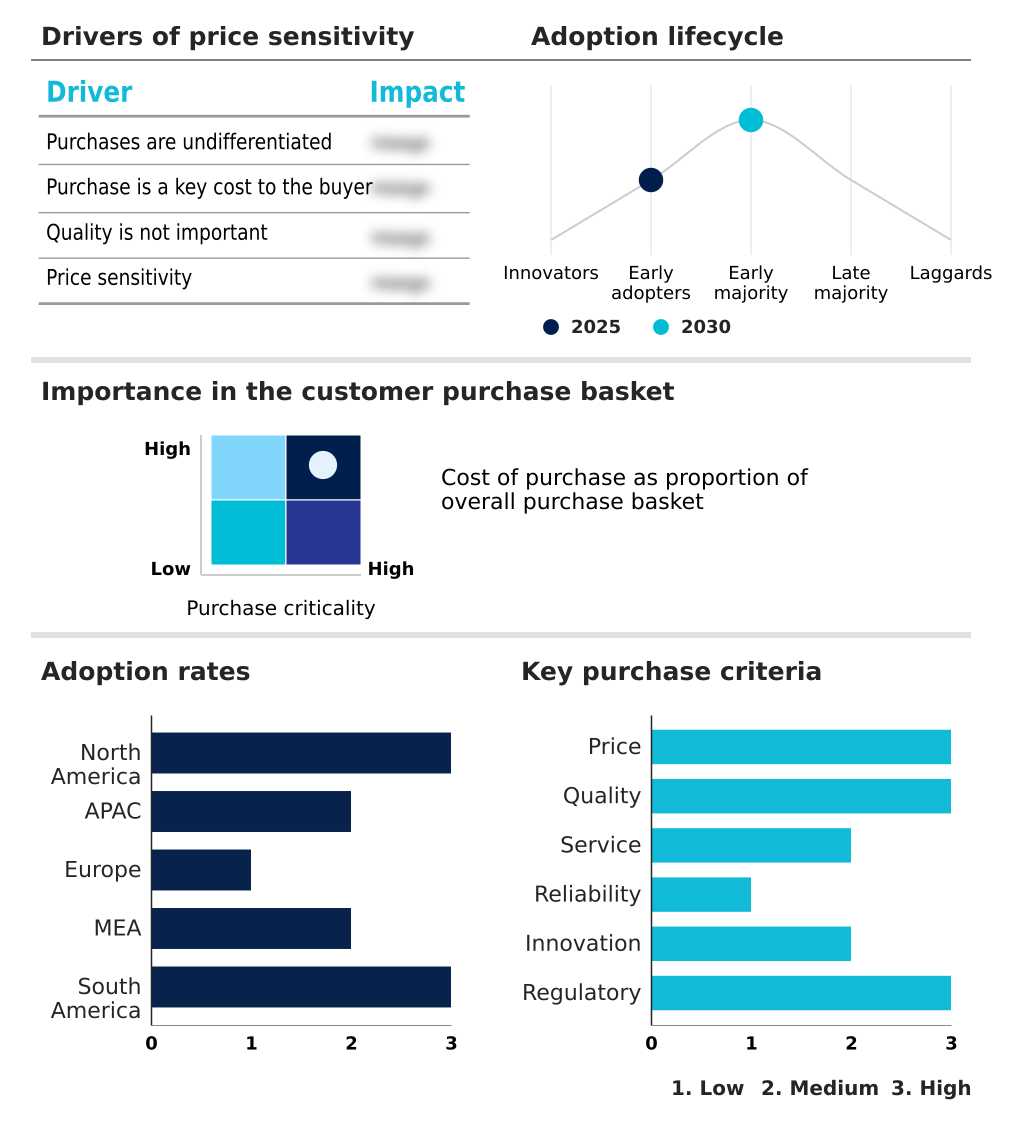
Exclusive Technavio Analysis on Customer Landscape

The clogs market forecasting report includes the adoption lifecycle of the market, covering from the innovator’s stage to the laggard’s stage. It focuses on adoption rates in different regions based on penetration. Furthermore, the clogs market report also includes key purchase criteria and drivers of price sensitivity to help companies evaluate and develop their market growth analysis strategies.

Customer Landscape of Clogs Industry

Competitive Landscape

Companies are implementing various strategies, such as strategic alliances, clogs market forecast, partnerships, mergers and acquisitions, geographical expansion, and product/service launches, to enhance their presence in the industry.

Bata Corporation - Offerings center on proprietary closed-cell resin footwear, distinguished by an iconic perforated design that delivers signature lightweight comfort and a highly recognizable silhouette.

The industry research and growth report includes detailed analyses of the competitive landscape of the market and information about key companies, including:

  • Bata Corporation
  • Birkenstock India Pvt Ltd.
  • BOGS
  • Bryr Studio
  • Calzuro
  • Cape Clogs Inc
  • Crocs Inc.
  • Dansko LLC.
  • Hunter Boot Ltd.
  • Liberty Shoes Ltd.
  • Maguba
  • Oofos Inc.
  • PUMA SE
  • Quince
  • Relaxo Footwears Ltd.
  • Rothys
  • Sanita
  • Skechers USA Inc.
  • SOREL

Qualitative and quantitative analysis of companies has been conducted to help clients understand the wider business environment as well as the strengths and weaknesses of key industry players. Data is qualitatively analyzed to categorize companies as pure play, category-focused, industry-focused, and diversified; it is quantitatively analyzed to categorize companies as dominant, leading, strong, tentative, and weak.

Market Intelligence Radar: High-Impact Developments & Growth Signals

  • In the Footwear industry, the widespread adoption of circular manufacturing principles and a regulatory push for a minimum of 20% recycled content in new products has compelled clog manufacturers to invest in bio-based polymers and proprietary foam technology. This shift directly impacts material sourcing, favoring suppliers of sugarcane-derived EVA and recycled post-consumer waste to meet new sustainability benchmarks.
  • The integration of 3D printing and body scanning technologies for mass customization has altered production workflows. This allows clog brands to offer hyper-personalization at scale, a strategy that has demonstrated a 15% increase in customer retention by enabling consumers to design unique footwear with customizable charms and ergonomic footbeds.
  • Heightened enforcement of workplace safety standards, particularly EU regulations mandating specific slip-resistance (ISO 20347) and antistatic properties in personal protective equipment, has expanded the market for occupational clogs. Manufacturers are now required to embed advanced high-traction sole designs, increasing demand for specialized clogs in the healthcare and culinary sectors by over 10%.
  • The pivot toward direct-to-consumer (DTC) e-commerce channels, which now account for over 40% of sales for leading brands, has reshaped distribution strategies. This forces investment in digital-first marketing and logistics for casual lifestyle footwear, reducing reliance on traditional brick-and-mortar retail and enabling more agile responses to fast-moving streetwear culture trends.

Dive into Technavio’s robust research methodology, blending expert interviews, extensive data synthesis, and validated models for unparalleled Clogs Market insights. See full methodology.

Market Scope
Page number 284
Base year 2025
Historic period 2020-2024
Forecast period 2026-2030
Growth momentum & CAGR Accelerate at a CAGR of 11.2%
Market growth 2026-2030 USD 5807.1 million
Market structure Fragmented
YoY growth 2025-2026(%) 10.0%
Key countries US, Canada, Mexico, China, India, Japan, South Korea, Australia, Indonesia, UK, Germany, France, Italy, The Netherlands, Spain, Saudi Arabia, UAE, South Africa, Israel, Turkey, Brazil, Argentina and Colombia
Competitive landscape Leading Companies, Market Positioning of Companies, Competitive Strategies, and Industry Risks

Request Free Sample

Research Analyst Overview

  • The clogs market ecosystem operates through a complex value chain, where over 60% of raw materials, such as ethylene-vinyl acetate (EVA) and bio-based polymers, are sourced from specialized chemical suppliers in APAC. Manufacturers, ranging from global giants to niche artisanal producers, transform these materials via injection molding and assembly, with a growing emphasis on circular manufacturing processes.
  • The distribution landscape is bifurcated, with online direct-to-consumer (DTC) channels growing by 15% annually, complementing traditional offline retail, which still captures the majority of sales. Regulatory bodies and workplace safety standards, particularly for occupational footwear, impose strict requirements for slip resistance and antistatic properties. End-users include healthcare professionals, culinary staff, and a broad consumer base driven by the comfort economy.
  • Supporting entities, including logistics providers and technology firms offering 3D scanning for hyper-personalization, are critical for enabling supply chain efficiency and product innovation.

What are the Key Data Covered in this Clogs Market Research and Growth Report?

  • What is the expected growth of the Clogs Market between 2026 and 2030?

    • The Clogs Market is expected to grow by USD 5.81 billion during 2026-2030, registering a CAGR of 11.2%. Year-over-year growth in 2026 is estimated at 10.0%%. This acceleration is shaped by integration of comfort into mainstream fashion, which is intensifying demand across multiple end-use verticals covered in the report.

  • What segmentation does the market report cover?

    • The report is segmented by Product (Casual clogs, and Occupational clogs), End-user (Men, Women, and Kids), Distribution Channel (Offline, and Online) and Geography (North America, APAC, Europe, Middle East and Africa, South America). Among these, the Casual clogs segment is estimated to witness significant growth during the forecast period, driven by rising adoption across key application areas. Each segment includes detailed qualitative and quantitative analysis, along with historical data from 2020-2024 and forecasts through 2030 with year-over-year growth rates.

  • Which regions are analyzed in the report?

    • The report covers North America, APAC, Europe, Middle East and Africa and South America. APAC is estimated to contribute 34.5% to market growth during the forecast period. Country-level analysis includes US, Canada, Mexico, China, India, Japan, South Korea, Australia, Indonesia, UK, Germany, France, Italy, The Netherlands, Spain, Saudi Arabia, UAE, South Africa, Israel, Turkey, Brazil, Argentina and Colombia, with dedicated market size tables and year-over-year growth for each.

  • What are the key growth drivers and market challenges?

    • The primary driver is integration of comfort into mainstream fashion, which is accelerating investment and industry demand. The main challenge is volatility in raw material costs and supply chain complexities, creating operational barriers for key market participants. The report quantifies the impact of each driver and challenge across 2026 and 2030 with comparative analysis.

  • Who are the major players in the Clogs Market?

    • Key vendors include Bata Corporation, Birkenstock India Pvt Ltd., BOGS, Bryr Studio, Calzuro, Cape Clogs Inc, Crocs Inc., Dansko LLC., Hunter Boot Ltd., Liberty Shoes Ltd., Maguba, Oofos Inc., PUMA SE, Quince, Relaxo Footwears Ltd., Rothys, Sanita, Skechers USA Inc. and SOREL. The report provides qualitative and quantitative analysis categorizing companies as dominant, leading, strong, tentative, and weak based on their market positioning. Company profiles include business segment analysis, SWOT assessment, key offerings, and recent strategic developments.

Market Research Insights

  • The competitive landscape of the clogs market is fragmented, with the top three players commanding over 45% of the total market share. Key vendors like Crocs Inc. and Birkenstock Group are driving innovation through high-profile collaborations and a strategic focus on material science, particularly the development of proprietary foam technology and bio-based polymers.
  • For instance, recent initiatives to expand the use of bio-circular materials aim to reduce the carbon footprint by up to 50% per pair. These actions directly address consumer demand for sustainable footwear and ergonomic support. However, the industry grapples with the proliferation of counterfeit products, which dilute brand equity and pose safety risks due to inferior materials lacking orthopedic support.
  • This forces leading companies to allocate significant resources toward intellectual property enforcement and monitoring online marketplaces to protect their market position and consumer trust.

We can help! Our analysts can customize this clogs market research report to meet your requirements.

Get in touch

1. Executive Summary

1.1 Market overview

Executive Summary - Chart on Market Overview
Executive Summary - Data Table on Market Overview
Executive Summary - Chart on Global Market Characteristics
Executive Summary - Chart on Market by Geography
Executive Summary - Chart on Market Segmentation by Product
Executive Summary - Chart on Market Segmentation by End-user
Executive Summary - Chart on Market Segmentation by Distribution Channel
Executive Summary - Chart on Incremental Growth
Executive Summary - Data Table on Incremental Growth
Executive Summary - Chart on Company Market Positioning

2. Technavio Analysis

2.1 Analysis of price sensitivity, lifecycle, customer purchase basket, adoption rates, and purchase criteria

2.2 Criticality of inputs and Factors of differentiation

Chart on Overview on criticality of inputs and factors of differentiation

2.3 Factors of disruption

Chart on Overview on factors of disruption

2.4 Impact of drivers and challenges

Chart on Impact of drivers and challenges in 2025 and 2030

3. Market Landscape

3.1 Market ecosystem

Chart on Parent Market
Data Table on - Parent Market

3.2 Market characteristics

Chart on Market characteristics analysis

3.3 Value chain analysis

Chart on Value chain analysis

4. Market Sizing

4.1 Market definition

Data Table on Offerings of companies included in the market definition

4.2 Market segment analysis

Market segments

4.3 Market size 2025

4.4 Market outlook: Forecast for 2025-2030

Chart on Global - Market size and forecast 2025-2030 ($ million)
Data Table on Global - Market size and forecast 2025-2030 ($ million)
Chart on Global Market: Year-over-year growth 2025-2030 (%)
Data Table on Global Market: Year-over-year growth 2025-2030 (%)

5. Historic Market Size

5.1 Global Clogs Market 2020 - 2024

Historic Market Size - Data Table on Global Clogs Market 2020 - 2024 ($ million)

5.2 Product segment analysis 2020 - 2024

Historic Market Size - Product Segment 2020 - 2024 ($ million)

5.3 End-user segment analysis 2020 - 2024

Historic Market Size - End-user Segment 2020 - 2024 ($ million)

5.4 Distribution Channel segment analysis 2020 - 2024

Historic Market Size - Distribution Channel Segment 2020 - 2024 ($ million)

5.5 Geography segment analysis 2020 - 2024

Historic Market Size - Geography Segment 2020 - 2024 ($ million)

5.6 Country segment analysis 2020 - 2024

Historic Market Size - Country Segment 2020 - 2024 ($ million)

6. Qualitative Analysis

6.1 Impact of AI on the Global Clogs Market

7. Five Forces Analysis

7.1 Five forces summary

Five forces analysis - Comparison between 2025 and 2030

7.2 Bargaining power of buyers

Bargaining power of buyers - Impact of key factors 2025 and 2030

7.3 Bargaining power of suppliers

Bargaining power of suppliers - Impact of key factors in 2025 and 2030

7.4 Threat of new entrants

Threat of new entrants - Impact of key factors in 2025 and 2030

7.5 Threat of substitutes

Threat of substitutes - Impact of key factors in 2025 and 2030

7.6 Threat of rivalry

Threat of rivalry - Impact of key factors in 2025 and 2030

7.7 Market condition

Chart on Market condition - Five forces 2025 and 2030

8. Market Segmentation by Product

8.1 Market segments

Chart on Product - Market share 2025-2030 (%)
Data Table on Product - Market share 2025-2030 (%)

8.2 Comparison by Product

Chart on Comparison by Product
Data Table on Comparison by Product

8.3 Casual clogs - Market size and forecast 2025-2030

Chart on Casual clogs - Market size and forecast 2025-2030 ($ million)
Data Table on Casual clogs - Market size and forecast 2025-2030 ($ million)
Chart on Casual clogs - Year-over-year growth 2025-2030 (%)
Data Table on Casual clogs - Year-over-year growth 2025-2030 (%)

8.4 Occupational clogs - Market size and forecast 2025-2030

Chart on Occupational clogs - Market size and forecast 2025-2030 ($ million)
Data Table on Occupational clogs - Market size and forecast 2025-2030 ($ million)
Chart on Occupational clogs - Year-over-year growth 2025-2030 (%)
Data Table on Occupational clogs - Year-over-year growth 2025-2030 (%)

8.5 Market opportunity by Product

Market opportunity by Product ($ million)
Data Table on Market opportunity by Product ($ million)

9. Market Segmentation by End-user

9.1 Market segments

Chart on End-user - Market share 2025-2030 (%)
Data Table on End-user - Market share 2025-2030 (%)

9.2 Comparison by End-user

Chart on Comparison by End-user
Data Table on Comparison by End-user

9.3 Men - Market size and forecast 2025-2030

Chart on Men - Market size and forecast 2025-2030 ($ million)
Data Table on Men - Market size and forecast 2025-2030 ($ million)
Chart on Men - Year-over-year growth 2025-2030 (%)
Data Table on Men - Year-over-year growth 2025-2030 (%)

9.4 Women - Market size and forecast 2025-2030

Chart on Women - Market size and forecast 2025-2030 ($ million)
Data Table on Women - Market size and forecast 2025-2030 ($ million)
Chart on Women - Year-over-year growth 2025-2030 (%)
Data Table on Women - Year-over-year growth 2025-2030 (%)

9.5 Kids - Market size and forecast 2025-2030

Chart on Kids - Market size and forecast 2025-2030 ($ million)
Data Table on Kids - Market size and forecast 2025-2030 ($ million)
Chart on Kids - Year-over-year growth 2025-2030 (%)
Data Table on Kids - Year-over-year growth 2025-2030 (%)

9.6 Market opportunity by End-user

Market opportunity by End-user ($ million)
Data Table on Market opportunity by End-user ($ million)

10. Market Segmentation by Distribution Channel

10.1 Market segments

Chart on Distribution Channel - Market share 2025-2030 (%)
Data Table on Distribution Channel - Market share 2025-2030 (%)

10.2 Comparison by Distribution Channel

Chart on Comparison by Distribution Channel
Data Table on Comparison by Distribution Channel

10.3 Offline - Market size and forecast 2025-2030

Chart on Offline - Market size and forecast 2025-2030 ($ million)
Data Table on Offline - Market size and forecast 2025-2030 ($ million)
Chart on Offline - Year-over-year growth 2025-2030 (%)
Data Table on Offline - Year-over-year growth 2025-2030 (%)

10.4 Online - Market size and forecast 2025-2030

Chart on Online - Market size and forecast 2025-2030 ($ million)
Data Table on Online - Market size and forecast 2025-2030 ($ million)
Chart on Online - Year-over-year growth 2025-2030 (%)
Data Table on Online - Year-over-year growth 2025-2030 (%)

10.5 Market opportunity by Distribution Channel

Market opportunity by Distribution Channel ($ million)
Data Table on Market opportunity by Distribution Channel ($ million)

11. Customer Landscape

11.1 Customer landscape overview

Analysis of price sensitivity, lifecycle, customer purchase basket, adoption rates, and purchase criteria

12. Geographic Landscape

12.1 Geographic segmentation

Chart on Market share by geography 2025-2030 (%)
Data Table on Market share by geography 2025-2030 (%)

12.2 Geographic comparison

Chart on Geographic comparison
Data Table on Geographic comparison

12.3 North America - Market size and forecast 2025-2030

Chart on North America - Market size and forecast 2025-2030 ($ million)
Data Table on North America - Market size and forecast 2025-2030 ($ million)
Chart on North America - Year-over-year growth 2025-2030 (%)
Data Table on North America - Year-over-year growth 2025-2030 (%)
Chart on Regional Comparison - North America
Data Table on Regional Comparison - North America

12.3.1 US - Market size and forecast 2025-2030

Chart on US - Market size and forecast 2025-2030 ($ million)
Data Table on US - Market size and forecast 2025-2030 ($ million)
Chart on US - Year-over-year growth 2025-2030 (%)
Data Table on US - Year-over-year growth 2025-2030 (%)

12.3.2 Canada - Market size and forecast 2025-2030

Chart on Canada - Market size and forecast 2025-2030 ($ million)
Data Table on Canada - Market size and forecast 2025-2030 ($ million)
Chart on Canada - Year-over-year growth 2025-2030 (%)
Data Table on Canada - Year-over-year growth 2025-2030 (%)

12.3.3 Mexico - Market size and forecast 2025-2030

Chart on Mexico - Market size and forecast 2025-2030 ($ million)
Data Table on Mexico - Market size and forecast 2025-2030 ($ million)
Chart on Mexico - Year-over-year growth 2025-2030 (%)
Data Table on Mexico - Year-over-year growth 2025-2030 (%)

12.4 APAC - Market size and forecast 2025-2030

Chart on APAC - Market size and forecast 2025-2030 ($ million)
Data Table on APAC - Market size and forecast 2025-2030 ($ million)
Chart on APAC - Year-over-year growth 2025-2030 (%)
Data Table on APAC - Year-over-year growth 2025-2030 (%)
Chart on Regional Comparison - APAC
Data Table on Regional Comparison - APAC

12.4.1 China - Market size and forecast 2025-2030

Chart on China - Market size and forecast 2025-2030 ($ million)
Data Table on China - Market size and forecast 2025-2030 ($ million)
Chart on China - Year-over-year growth 2025-2030 (%)
Data Table on China - Year-over-year growth 2025-2030 (%)

12.4.2 India - Market size and forecast 2025-2030

Chart on India - Market size and forecast 2025-2030 ($ million)
Data Table on India - Market size and forecast 2025-2030 ($ million)
Chart on India - Year-over-year growth 2025-2030 (%)
Data Table on India - Year-over-year growth 2025-2030 (%)

12.4.3 Japan - Market size and forecast 2025-2030

Chart on Japan - Market size and forecast 2025-2030 ($ million)
Data Table on Japan - Market size and forecast 2025-2030 ($ million)
Chart on Japan - Year-over-year growth 2025-2030 (%)
Data Table on Japan - Year-over-year growth 2025-2030 (%)

12.4.4 South Korea - Market size and forecast 2025-2030

Chart on South Korea - Market size and forecast 2025-2030 ($ million)
Data Table on South Korea - Market size and forecast 2025-2030 ($ million)
Chart on South Korea - Year-over-year growth 2025-2030 (%)
Data Table on South Korea - Year-over-year growth 2025-2030 (%)

12.4.5 Australia - Market size and forecast 2025-2030

Chart on Australia - Market size and forecast 2025-2030 ($ million)
Data Table on Australia - Market size and forecast 2025-2030 ($ million)
Chart on Australia - Year-over-year growth 2025-2030 (%)
Data Table on Australia - Year-over-year growth 2025-2030 (%)

12.4.6 Indonesia - Market size and forecast 2025-2030

Chart on Indonesia - Market size and forecast 2025-2030 ($ million)
Data Table on Indonesia - Market size and forecast 2025-2030 ($ million)
Chart on Indonesia - Year-over-year growth 2025-2030 (%)
Data Table on Indonesia - Year-over-year growth 2025-2030 (%)

12.5 Europe - Market size and forecast 2025-2030

Chart on Europe - Market size and forecast 2025-2030 ($ million)
Data Table on Europe - Market size and forecast 2025-2030 ($ million)
Chart on Europe - Year-over-year growth 2025-2030 (%)
Data Table on Europe - Year-over-year growth 2025-2030 (%)
Chart on Regional Comparison - Europe
Data Table on Regional Comparison - Europe

12.5.1 UK - Market size and forecast 2025-2030

Chart on UK - Market size and forecast 2025-2030 ($ million)
Data Table on UK - Market size and forecast 2025-2030 ($ million)
Chart on UK - Year-over-year growth 2025-2030 (%)
Data Table on UK - Year-over-year growth 2025-2030 (%)

12.5.2 Germany - Market size and forecast 2025-2030

Chart on Germany - Market size and forecast 2025-2030 ($ million)
Data Table on Germany - Market size and forecast 2025-2030 ($ million)
Chart on Germany - Year-over-year growth 2025-2030 (%)
Data Table on Germany - Year-over-year growth 2025-2030 (%)

12.5.3 France - Market size and forecast 2025-2030

Chart on France - Market size and forecast 2025-2030 ($ million)
Data Table on France - Market size and forecast 2025-2030 ($ million)
Chart on France - Year-over-year growth 2025-2030 (%)
Data Table on France - Year-over-year growth 2025-2030 (%)

12.5.4 Italy - Market size and forecast 2025-2030

Chart on Italy - Market size and forecast 2025-2030 ($ million)
Data Table on Italy - Market size and forecast 2025-2030 ($ million)
Chart on Italy - Year-over-year growth 2025-2030 (%)
Data Table on Italy - Year-over-year growth 2025-2030 (%)

12.5.5 The Netherlands - Market size and forecast 2025-2030

Chart on The Netherlands - Market size and forecast 2025-2030 ($ million)
Data Table on The Netherlands - Market size and forecast 2025-2030 ($ million)
Chart on The Netherlands - Year-over-year growth 2025-2030 (%)
Data Table on The Netherlands - Year-over-year growth 2025-2030 (%)

12.5.6 Spain - Market size and forecast 2025-2030

Chart on Spain - Market size and forecast 2025-2030 ($ million)
Data Table on Spain - Market size and forecast 2025-2030 ($ million)
Chart on Spain - Year-over-year growth 2025-2030 (%)
Data Table on Spain - Year-over-year growth 2025-2030 (%)

12.6 Middle East and Africa - Market size and forecast 2025-2030

Chart on Middle East and Africa - Market size and forecast 2025-2030 ($ million)
Data Table on Middle East and Africa - Market size and forecast 2025-2030 ($ million)
Chart on Middle East and Africa - Year-over-year growth 2025-2030 (%)
Data Table on Middle East and Africa - Year-over-year growth 2025-2030 (%)
Chart on Regional Comparison - Middle East and Africa
Data Table on Regional Comparison - Middle East and Africa

12.6.1 Saudi Arabia - Market size and forecast 2025-2030

Chart on Saudi Arabia - Market size and forecast 2025-2030 ($ million)
Data Table on Saudi Arabia - Market size and forecast 2025-2030 ($ million)
Chart on Saudi Arabia - Year-over-year growth 2025-2030 (%)
Data Table on Saudi Arabia - Year-over-year growth 2025-2030 (%)

12.6.2 UAE - Market size and forecast 2025-2030

Chart on UAE - Market size and forecast 2025-2030 ($ million)
Data Table on UAE - Market size and forecast 2025-2030 ($ million)
Chart on UAE - Year-over-year growth 2025-2030 (%)
Data Table on UAE - Year-over-year growth 2025-2030 (%)

12.6.3 South Africa - Market size and forecast 2025-2030

Chart on South Africa - Market size and forecast 2025-2030 ($ million)
Data Table on South Africa - Market size and forecast 2025-2030 ($ million)
Chart on South Africa - Year-over-year growth 2025-2030 (%)
Data Table on South Africa - Year-over-year growth 2025-2030 (%)

12.6.4 Israel - Market size and forecast 2025-2030

Chart on Israel - Market size and forecast 2025-2030 ($ million)
Data Table on Israel - Market size and forecast 2025-2030 ($ million)
Chart on Israel - Year-over-year growth 2025-2030 (%)
Data Table on Israel - Year-over-year growth 2025-2030 (%)

12.6.5 Turkey - Market size and forecast 2025-2030

Chart on Turkey - Market size and forecast 2025-2030 ($ million)
Data Table on Turkey - Market size and forecast 2025-2030 ($ million)
Chart on Turkey - Year-over-year growth 2025-2030 (%)
Data Table on Turkey - Year-over-year growth 2025-2030 (%)

12.7 South America - Market size and forecast 2025-2030

Chart on South America - Market size and forecast 2025-2030 ($ million)
Data Table on South America - Market size and forecast 2025-2030 ($ million)
Chart on South America - Year-over-year growth 2025-2030 (%)
Data Table on South America - Year-over-year growth 2025-2030 (%)
Chart on Regional Comparison - South America
Data Table on Regional Comparison - South America

12.7.1 Brazil - Market size and forecast 2025-2030

Chart on Brazil - Market size and forecast 2025-2030 ($ million)
Data Table on Brazil - Market size and forecast 2025-2030 ($ million)
Chart on Brazil - Year-over-year growth 2025-2030 (%)
Data Table on Brazil - Year-over-year growth 2025-2030 (%)

12.7.2 Argentina - Market size and forecast 2025-2030

Chart on Argentina - Market size and forecast 2025-2030 ($ million)
Data Table on Argentina - Market size and forecast 2025-2030 ($ million)
Chart on Argentina - Year-over-year growth 2025-2030 (%)
Data Table on Argentina - Year-over-year growth 2025-2030 (%)

12.7.3 Colombia - Market size and forecast 2025-2030

Chart on Colombia - Market size and forecast 2025-2030 ($ million)
Data Table on Colombia - Market size and forecast 2025-2030 ($ million)
Chart on Colombia - Year-over-year growth 2025-2030 (%)
Data Table on Colombia - Year-over-year growth 2025-2030 (%)

12.8 Market opportunity by geography

Market opportunity by geography ($ million)
Data Tables on Market opportunity by geography ($ million)

13. Drivers, Challenges, and Opportunity

13.1 Market drivers

Integration of comfort into mainstream fashion
Advancements in sustainable materials and circular manufacturing
Expansion of healthcare infrastructure and occupational safety standards

13.2 Market challenges

Volatility in raw material costs and supply chain complexities
Proliferation of counterfeit products and intellectual property infringement
Environmental concerns regarding synthetic waste and disposal

13.3 Impact of drivers and challenges

Impact of drivers and challenges in 2025 and 2030

13.4 Market opportunities

Acceleration of bio-based materials
Convergence of high-fashion collaborations and hyper-personalization
Expansion of ergonomic solutions in medical and industrial sectors

14. Competitive Landscape

14.1 Overview

14.2

Overview on criticality of inputs and factors of differentiation

14.3 Landscape disruption

Overview on factors of disruption

14.4 Industry risks

Impact of key risks on business

15. Competitive Analysis

15.1 Companies profiled

Companies covered

15.2 Company ranking index

15.3 Market positioning of companies

Matrix on companies position and classification

15.4 Bata Corporation

Bata Corporation - Overview
Bata Corporation - Product / Service
Bata Corporation - Key offerings
SWOT

15.5 Birkenstock India Pvt Ltd.

Birkenstock India Pvt Ltd. - Overview
Birkenstock India Pvt Ltd. - Product / Service
Birkenstock India Pvt Ltd. - Key offerings
SWOT

15.6 Calzuro

Calzuro - Overview
Calzuro - Product / Service
Calzuro - Key offerings
SWOT

15.7 Cape Clogs Inc

Cape Clogs Inc - Overview
Cape Clogs Inc - Product / Service
Cape Clogs Inc - Key offerings
SWOT

15.8 Crocs Inc.

Crocs Inc. - Overview
Crocs Inc. - Business segments
Crocs Inc. - Key offerings
Crocs Inc. - Segment focus
SWOT

15.9 Dansko LLC.

Dansko LLC. - Overview
Dansko LLC. - Product / Service
Dansko LLC. - Key offerings
SWOT

15.10 Hunter Boot Ltd.

Hunter Boot Ltd. - Overview
Hunter Boot Ltd. - Product / Service
Hunter Boot Ltd. - Key offerings
SWOT

15.11 Liberty Shoes Ltd.

Liberty Shoes Ltd. - Overview
Liberty Shoes Ltd. - Product / Service
Liberty Shoes Ltd. - Key offerings
SWOT

15.12 Maguba

Maguba - Overview
Maguba - Product / Service
Maguba - Key offerings
SWOT

15.13 Oofos Inc.

Oofos Inc. - Overview
Oofos Inc. - Product / Service
Oofos Inc. - Key offerings
SWOT

15.14 PUMA SE

PUMA SE - Overview
PUMA SE - Business segments
PUMA SE - Key news
PUMA SE - Key offerings
PUMA SE - Segment focus
SWOT

15.15 Relaxo Footwears Ltd.

Relaxo Footwears Ltd. - Overview
Relaxo Footwears Ltd. - Product / Service
Relaxo Footwears Ltd. - Key offerings
SWOT

15.16 Sanita

Sanita - Overview
Sanita - Product / Service
Sanita - Key offerings
SWOT

15.17 Skechers USA Inc.

Skechers USA Inc. - Overview
Skechers USA Inc. - Business segments
Skechers USA Inc. - Key offerings
Skechers USA Inc. - Segment focus
SWOT

15.18 SOREL

SOREL - Overview
SOREL - Product / Service
SOREL - Key offerings
SWOT

16. Appendix

16.1 Scope of the report

Market definition
Objectives
Notes and caveats

16.2 Inclusions and exclusions checklist

Inclusions checklist
Exclusions checklist

16.3 Currency conversion rates for US$

16.4 Research methodology

16.5 Data procurement

Information sources

16.6 Data validation

16.7 Validation techniques employed for market sizing

16.8 Data synthesis

16.9 360 degree market analysis

16.10 List of abbreviations

Research Methodology

Technavio presents a detailed picture of the market by way of study, synthesis, and summation of data from multiple sources. The analysts have presented the various facets of the market with a particular focus on identifying the key industry influencers. The data thus presented is comprehensive, reliable, and the result of extensive research, both primary and secondary.

INFORMATION SOURCES

Primary sources

  • Manufacturers and suppliers
  • Channel partners
  • Industry experts
  • Strategic decision makers

Secondary sources

  • Industry journals and periodicals
  • Government data
  • Financial reports of key industry players
  • Historical data
  • Press releases

DATA ANALYSIS

Data Synthesis

  • Collation of data
  • Estimation of key figures
  • Analysis of derived insights

Data Validation

  • Triangulation with data models
  • Reference against proprietary databases
  • Corroboration with industry experts

REPORT WRITING

Qualitative

  • Market drivers
  • Market challenges
  • Market trends
  • Five forces analysis

Quantitative

  • Market size and forecast
  • Market segmentation
  • Geographical insights
  • Competitive landscape

Interested in this report?

Get your sample now to see our research methodology and insights!

Download Now

Frequently Asked Questions

Clogs market growth will increase by USD 5807.1 million during 2026-2030.

The Clogs market is expected to grow at a CAGR of 11.2% during 2026-2030.

Clogs market is segmented by Product (Casual clogs, Occupational clogs) End-user (Men, Women, Kids) Distribution channel (Offline, Online)

Bata Corporation, Birkenstock India Pvt Ltd., BOGS, Bryr Studio, Calzuro, Cape Clogs Inc, Crocs Inc., Dansko LLC., Hunter Boot Ltd., Liberty Shoes Ltd., Maguba, Oofos Inc., PUMA SE, Quince, Relaxo Footwears Ltd., Rothys, Sanita, Skechers USA Inc., SOREL are a few of the key vendors in the Clogs market.

APAC will register the highest growth rate of 34.5% among the other regions. Therefore, the Clogs market in APAC is expected to garner significant business opportunities for the vendors during the forecast period.

US, Canada, Mexico, China, India, Japan, South Korea, Australia, Indonesia, UK, Germany, France, Italy, The Netherlands, Spain, Saudi Arabia, UAE, South Africa, Israel, Turkey, Brazil, Argentina, Colombia

  • Integration of comfort into mainstream fashion is the driving factor this market.

The Clogs market vendors should focus on grabbing business opportunities from the Product segment as it accounted for the largest market share in the base year.
RIA - Research AI Assistant
Ask RIA