CNC Machine Tools Market Size 2026-2030
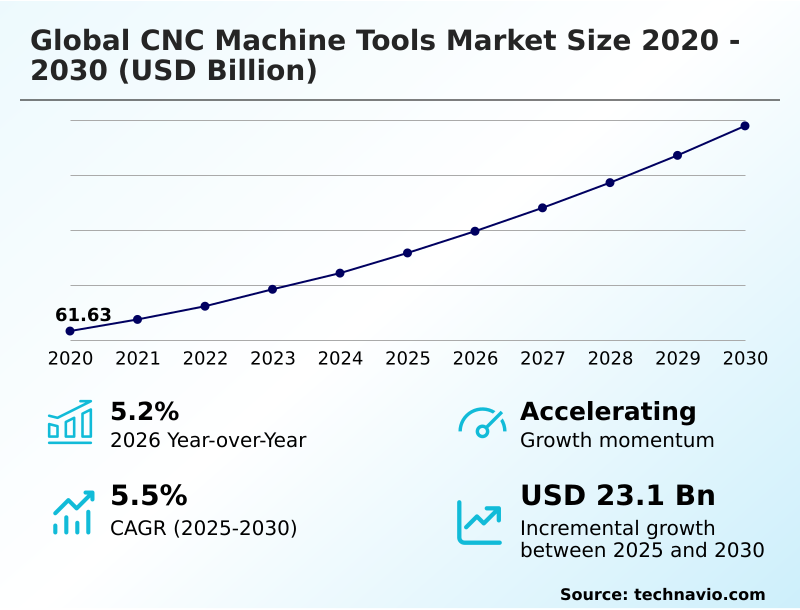
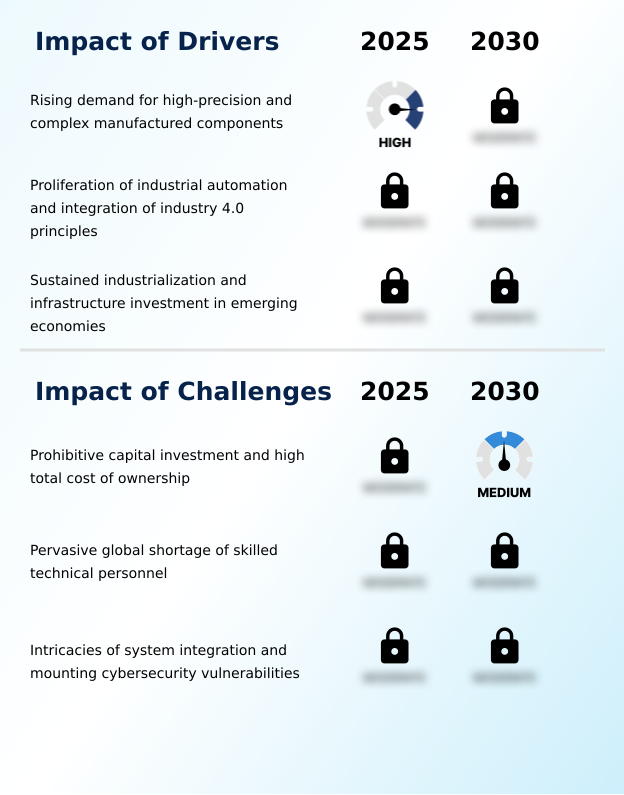
The cnc machine tools market size is valued to increase by USD 23.10 billion, at a CAGR of 5.5% from 2025 to 2030. Rising demand for high-precision and complex manufactured components will drive the cnc machine tools market.
Major Market Trends & Insights
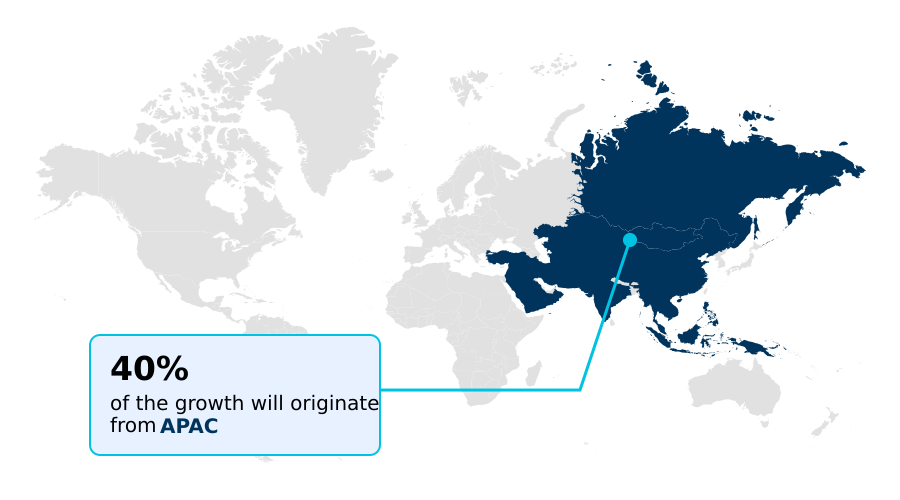
- APAC dominated the market and accounted for a 39.6% growth during the forecast period.
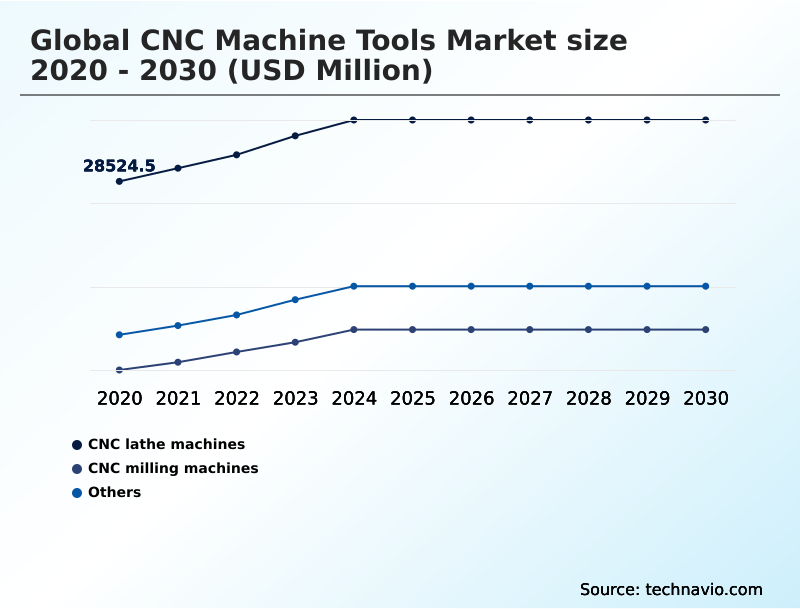
- By Product - CNC lathe machines segment was valued at USD 32.82 billion in 2024
- By End-user - Automotive segment accounted for the largest market revenue share in 2024
Market Size & Forecast
- Market Opportunities: USD 37.30 billion
- Market Future Opportunities: USD 23.10 billion
- CAGR from 2025 to 2030 : 5.5%
Market Summary
- The CNC Machine Tools Market is undergoing a significant transformation, driven by the convergence of digital technology and advanced mechanical engineering. The escalating demand for components with intricate geometries and tight tolerances from sectors like aerospace, medical devices, and automotive propels the adoption of sophisticated multi-axis systems.
- A key trend is the integration of Industry 4.0 principles, turning standalone machines into intelligent, networked assets capable of predictive maintenance and real-time process optimization. For instance, an aerospace manufacturer can leverage connected machining centers to produce monolithic structural parts, using sensor data to adjust cutting parameters adaptively.
- This not only improves dimensional accuracy but also reduces material waste and minimizes the risk of costly rework, directly enhancing supply chain efficiency. Concurrently, the industry grapples with the high capital investment for these technologies and a pervasive shortage of skilled personnel to operate them.
- The development of more intuitive user interfaces and AI-driven CAM software aims to mitigate these challenges, making advanced manufacturing capabilities more accessible and ensuring sustained relevance in an increasingly competitive industrial landscape.
What will be the Size of the CNC Machine Tools Market during the forecast period?
Get Key Insights on Market Forecast (PDF) Get Free Sample
How is the CNC Machine Tools Market Segmented?
The cnc machine tools industry research report provides comprehensive data (region-wise segment analysis), with forecasts and estimates in "USD million" for the period 2026-2030, as well as historical data from 2020-2024 for the following segments.
- Product
- CNC lathe machines
- CNC milling machines
- Others
- End-user
- Automotive
- Industrial machinery
- Precision engineering
- Transportation
- Others
- Type
- 3-axis machines
- 5-axis machines
- 4-axis machines
- 6-axis and above
- Geography
- APAC
- China
- Japan
- South Korea
- Europe
- Germany
- Italy
- France
- North America
- US
- Canada
- Mexico
- South America
- Brazil
- Argentina
- Colombia
- Middle East and Africa
- Saudi Arabia
- UAE
- South Africa
- Rest of World (ROW)
- APAC
By Product Insights
The cnc lathe machines segment is estimated to witness significant growth during the forecast period.
The CNC lathe machines segment remains foundational to the market, driven by relentless demand from automotive manufacturing and for aerospace components. These machines, governed by computer numerical control, are essential for producing axially symmetric parts.
The evolution is toward turn-mill centers that enable process consolidation and done-in-one machining, significantly boosting operational efficiency. This shift requires advanced toolpath optimization and sophisticated g-code programming.
Innovations in machine tool technology, especially in spindle technology, allow for higher speeds and improved finishes, addressing increasing part complexity.
Firms leveraging these advanced systems have reported a reduction in cycle times for complex components by over 30%, showcasing a clear return on investment.
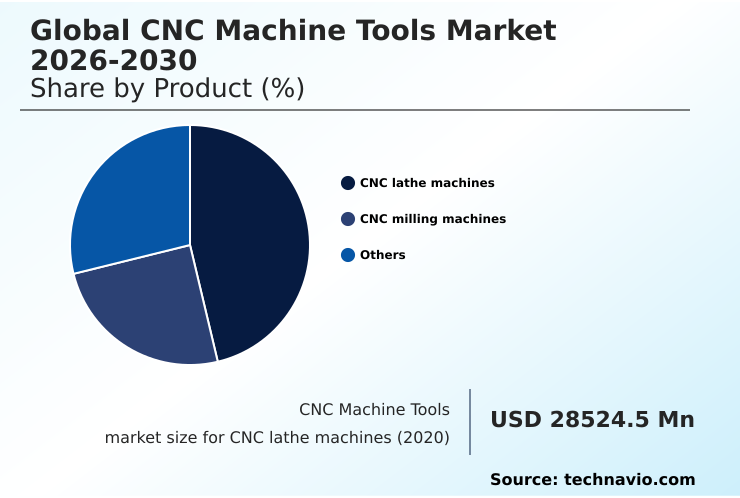
The CNC lathe machines segment was valued at USD 32.82 billion in 2024 and showed a gradual increase during the forecast period.
Regional Analysis
APAC is estimated to contribute 39.6% to the growth of the global market during the forecast period.Technavio’s analysts have elaborately explained the regional trends and drivers that shape the market during the forecast period.
See How CNC Machine Tools Market Demand is Rising in APAC Get Free Sample
The geographic landscape of the market is led by APAC, which accounts for nearly 40% of incremental growth, fueled by its expansive automotive manufacturing base and thriving electronics sector.
This region's demand is for a high volume of multi-axis CNC machines and vertical machining centers. In contrast, Europe's market, known for its precision engineering heritage, focuses on high-value equipment like grinding machines and electrical discharge machining systems.
North America's market is driven by reshoring initiatives and a strong focus on aerospace components, creating demand for advanced waterjet cutting and laser cutting technologies to process specialized materials.
The system integration complexity of these advanced systems is a common challenge across all mature markets, where a 15% improvement in integration efficiency can significantly impact project timelines.
This regional specialization underscores a global market where technological needs are increasingly tailored to specific industrial strengths.
Market Dynamics
Our researchers analyzed the data with 2025 as the base year, along with the key drivers, trends, and challenges. A holistic analysis of drivers will help companies refine their marketing strategies to gain a competitive advantage.
- Strategic adoption of advanced CNC technology requires a nuanced assessment beyond initial capital outlay, focusing on long-term ROI calculation for multi-axis CNC. For instance, choosing a 5-axis CNC for aerospace parts over a traditional 3-axis setup can reduce setup time with turn-mill centers and improve part quality, justifying the higher investment.
- The decision to invest in a CNC machine for complex geometries should also factor in the capabilities of CAM software for 5-axis toolpaths, which is critical for execution. As factories become more connected, cybersecurity for connected CNC machines is no longer optional but a core operational necessity.
- The impact of the skilled labor shortage on CNC operations can be mitigated by integrating robotics with CNC machines and utilizing AI in CNC predictive maintenance to maximize uptime. Furthermore, exploring hybrid additive and subtractive manufacturing opens new revenue streams, especially for CNC machining for medical implants. An energy-efficient CNC machine design contributes to sustainability goals and lowers operational costs.
- The use of G-code optimization for high-speed machining and proper workholding solutions for 5-axis machining are essential for maximizing productivity. The benefits of done-in-one machining are clear, with some firms achieving more than a 50% reduction in lead times compared to multi-machine workflows.
- Ultimately, from precision engineering with Swiss-type lathes to automating CNC machines for mass production in the industrial machinery sector, a holistic approach is vital for success.
What are the key market drivers leading to the rise in the adoption of CNC Machine Tools Industry?
- The rising demand for high-precision and complex manufactured components from key industries such as aerospace and automotive is a primary driver for market expansion.
- The market's primary driver is the escalating demand for components with higher dimensional accuracy and complexity, particularly from the precision engineering and aerospace sectors. This is fueling the shift from traditional CNC milling machines to advanced 5-axis machining centers.
- The proliferation of industrial automation and Industry 4.0 integration is another critical factor. By implementing robotic automation and lights-out manufacturing, firms can boost asset utilization by more than 35%.
- This move toward smart factories enables the high-speed machining of monolithic components, a task impossible with manual methods.
- Automating for mass production not only enhances productivity but also ensures consistent quality, with integrated systems reducing part-to-part variability by over 50%, a crucial requirement for global supply chains.
What are the market trends shaping the CNC Machine Tools Industry?
- The emergence of hybrid manufacturing systems that integrate additive and subtractive processes is a transformative trend. These platforms redefine part creation by combining material deposition with high-precision removal in a single setup.
- Key market trends are reshaping manufacturing capabilities, led by the rise of hybrid manufacturing systems that merge additive manufacturing and subtractive manufacturing. These platforms excel at producing near-net-shape parts, which can reduce material waste by over 80% for certain components. Concurrently, the infusion of AI and machine learning algorithms is enabling smart factory solutions.
- For instance, predictive maintenance powered by digital twin technology can decrease unplanned machine downtime by up to 30%. Furthermore, real-time process optimization with adaptive control improves surface finish quality, cutting down rework and scrap rates by 15%.
- This focus on intelligent, sustainable manufacturing is driving demand for machines with enhanced energy efficiency and more sophisticated control systems, pushing the industry toward a new era of autonomous and resource-conscious production.
What challenges does the CNC Machine Tools Industry face during its growth?
- The prohibitive capital investment required for advanced systems and the high total cost of ownership present a significant challenge affecting broad industry adoption and growth.
- Significant challenges constrain market growth, primarily the high total cost of ownership and the large initial capital investment required for advanced CNC machine tools.
- This financial barrier is compounded by the pervasive skilled labor shortage, where a lack of personnel proficient in modern CAM software can lead to equipment underutilization, with some advanced systems operating at less than 65% of their potential capacity. Furthermore, the increasing connectivity of machinery introduces system integration complexity and significant cybersecurity vulnerabilities.
- A single cyberattack can halt production, leading to financial losses that can exceed the cost of security implementation by tenfold. These issues create a difficult environment for smaller firms engaged in high-mix manufacturing, slowing the adoption of more productive technologies and creating a competitive divide in the industry.
Exclusive Technavio Analysis on Customer Landscape
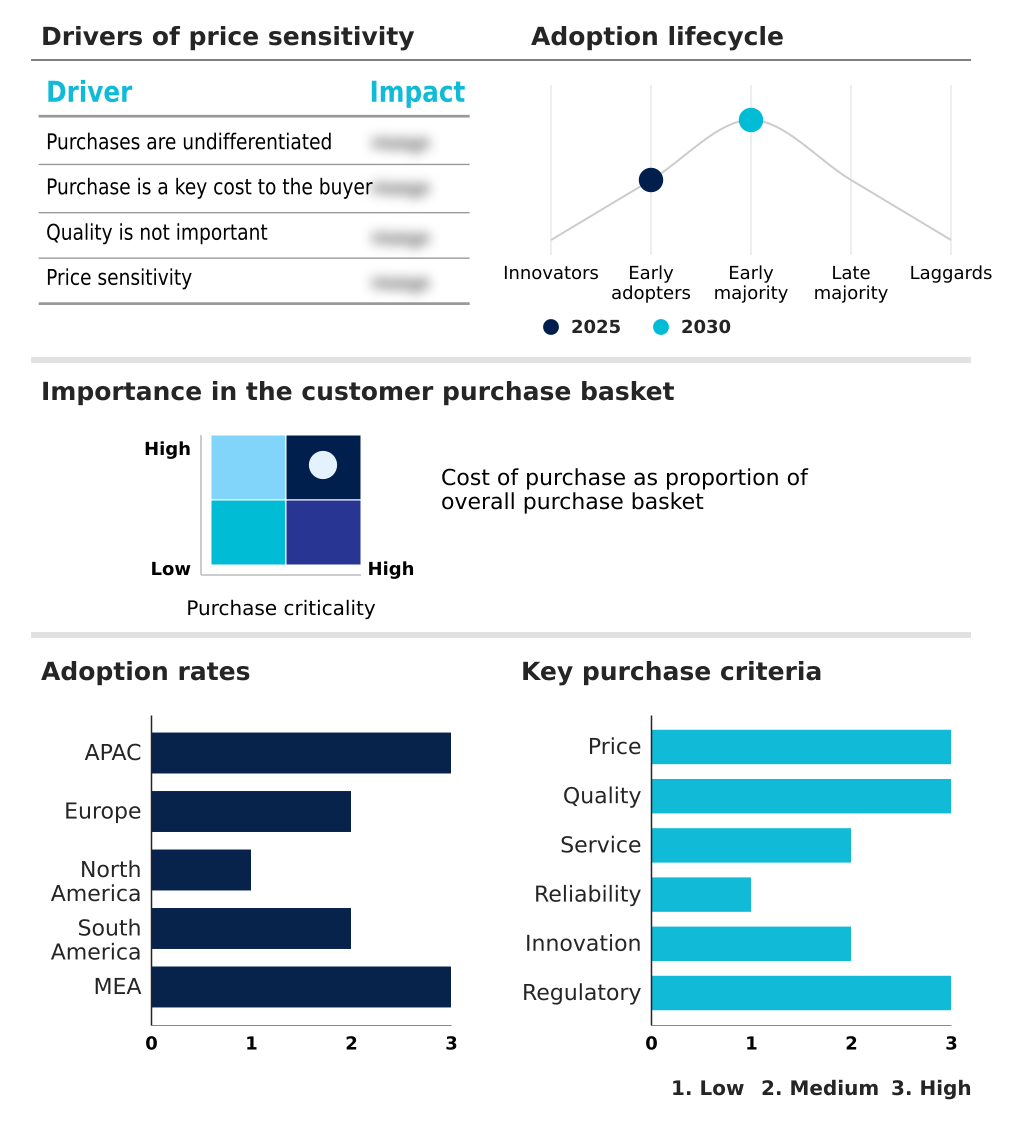
The cnc machine tools market forecasting report includes the adoption lifecycle of the market, covering from the innovator’s stage to the laggard’s stage. It focuses on adoption rates in different regions based on penetration. Furthermore, the cnc machine tools market report also includes key purchase criteria and drivers of price sensitivity to help companies evaluate and develop their market growth analysis strategies.
Customer Landscape of CNC Machine Tools Industry
Competitive Landscape
Companies are implementing various strategies, such as strategic alliances, cnc machine tools market forecast, partnerships, mergers and acquisitions, geographical expansion, and product/service launches, to enhance their presence in the industry.
Amada Co. Ltd. - Key offerings include advanced CNC machine tools, such as high-precision grinders and laser cutters, engineered for a wide array of demanding metalworking and manufacturing applications.
The industry research and growth report includes detailed analyses of the competitive landscape of the market and information about key companies, including:
- Amada Co. Ltd.
- ANCA Pty Ltd.
- Awea Mechantronic Co. Ltd
- DMG MORI Co. Ltd.
- EMAG GmbH and Co. KG
- FANUC Corp.
- Haas Automation Inc.
- Heller Maschinenfabrik
- Hurco Companies Inc.
- Hwacheon Machine Tool Co Ltd
- INDEX Werke GmbH and Co.
- Jyoti CNC Automation Ltd.
- Kitamura Machinery Co. Ltd.
- Makino Inc.
- Mills CNC Ltd.
- Mitsui Seiki Kogyo Co. Ltd.
- Okuma Corp.
- Phillips Machine Tools India
- Yamazaki Mazak Corp.
Qualitative and quantitative analysis of companies has been conducted to help clients understand the wider business environment as well as the strengths and weaknesses of key industry players. Data is qualitatively analyzed to categorize companies as pure play, category-focused, industry-focused, and diversified; it is quantitatively analyzed to categorize companies as dominant, leading, strong, tentative, and weak.
Recent Development and News in Cnc machine tools market
- In September 2024, DMG MORI Co. Ltd. launched its DMU 85 monoBLOCK 2nd Generation machining center, underscoring its focus on continuous innovation and automated manufacturing solutions.
- In January 2024, Jyoti CNC Automation Ltd. completed its Initial Public Offering, securing capital to enhance its competitive position and expand its global manufacturing footprint.
- In February 2025, the European Union sanctioned a significant grant to the European Manufacturing Competitiveness Institute to establish a technology platform focused on advancing CNC machine tool technologies and bolstering the competitiveness of European manufacturers.
- In May 2025, Embraer inaugurated a new production line featuring advanced multi-axis CNC turn-mill centers from Mazak Corp. to manufacture complex landing gear components, enhancing its vertical integration and production capacity.
Dive into Technavio’s robust research methodology, blending expert interviews, extensive data synthesis, and validated models for unparalleled CNC Machine Tools Market insights. See full methodology.
| Market Scope | |
|---|---|
| Page number | 312 |
| Base year | 2025 |
| Historic period | 2020-2024 |
| Forecast period | 2026-2030 |
| Growth momentum & CAGR | Accelerate at a CAGR of 5.5% |
| Market growth 2026-2030 | USD 23102.7 million |
| Market structure | Fragmented |
| YoY growth 2025-2026(%) | 5.2% |
| Key countries | China, Japan, South Korea, India, Taiwan, Indonesia, Germany, Italy, France, UK, Switzerland, The Netherlands, US, Canada, Mexico, Brazil, Argentina, Colombia, Saudi Arabia, UAE, South Africa, Turkey and Israel |
| Competitive landscape | Leading Companies, Market Positioning of Companies, Competitive Strategies, and Industry Risks |
Research Analyst Overview
- The CNC machine tools market is advancing beyond simple automation, driven by the pursuit of higher precision and efficiency. The adoption of sophisticated machine tool technology, including advanced spindle technology and multi-axis CNC machines, is becoming standard for high-value manufacturing.
- The integration of robotic automation and Industry 4.0 principles is shifting the focus from standalone equipment to interconnected ecosystems, where real-time process optimization and adaptive control are critical. For boardroom consideration, investing in these digitally-enabled machining centers is not just a capital expenditure but a strategic decision impacting cybersecurity resilience and operational continuity.
- The implementation of predictive maintenance protocols, leveraging in-process measurement and thermal compensation, can increase asset uptime by over 25%. This evolution necessitates advanced CAM software for toolpath optimization and robust workholding fixtures. From vertical machining centers to complex gantry-type and turn-mill centers, the core objective remains the same: enabling the production of increasingly complex components with unparalleled accuracy and efficiency.
What are the Key Data Covered in this CNC Machine Tools Market Research and Growth Report?
-
What is the expected growth of the CNC Machine Tools Market between 2026 and 2030?
-
USD 23.10 billion, at a CAGR of 5.5%
-
-
What segmentation does the market report cover?
-
The report is segmented by Product (CNC lathe machines, CNC milling machines, and Others), End-user (Automotive, Industrial machinery, Precision engineering, Transportation, and Others), Type (3-axis machines, 5-axis machines, 4-axis machines, and 6-axis and above) and Geography (APAC, Europe, North America, South America, Middle East and Africa)
-
-
Which regions are analyzed in the report?
-
APAC, Europe, North America, South America and Middle East and Africa
-
-
What are the key growth drivers and market challenges?
-
Rising demand for high-precision and complex manufactured components, Prohibitive capital investment and high total cost of ownership
-
-
Who are the major players in the CNC Machine Tools Market?
-
Amada Co. Ltd., ANCA Pty Ltd., Awea Mechantronic Co. Ltd, DMG MORI Co. Ltd., EMAG GmbH and Co. KG, FANUC Corp., Haas Automation Inc., Heller Maschinenfabrik, Hurco Companies Inc., Hwacheon Machine Tool Co Ltd, INDEX Werke GmbH and Co., Jyoti CNC Automation Ltd., Kitamura Machinery Co. Ltd., Makino Inc., Mills CNC Ltd., Mitsui Seiki Kogyo Co. Ltd., Okuma Corp., Phillips Machine Tools India and Yamazaki Mazak Corp.
-
Market Research Insights
- The dynamics of the CNC machine tools market are shaped by a strategic push toward greater operational efficiency and precision. The adoption of smart factory solutions is accelerating, with firms reporting that integrated systems can reduce unplanned downtime by over 20%.
- This industrial automation is a direct response to the skilled labor shortage and the high total cost of ownership associated with complex machinery. The demand for enhanced dimensional accuracy in sectors like precision engineering and automotive manufacturing is non-negotiable.
- Advanced hybrid manufacturing systems, which combine different processes, can improve part quality and reduce material scrap rates by up to 40% compared to conventional methods. This focus on process consolidation and achieving higher surface finish quality is central to maintaining a competitive edge.
We can help! Our analysts can customize this cnc machine tools market research report to meet your requirements.
 RIA -
RIA - 
