Japan Coal Market Size 2024-2028
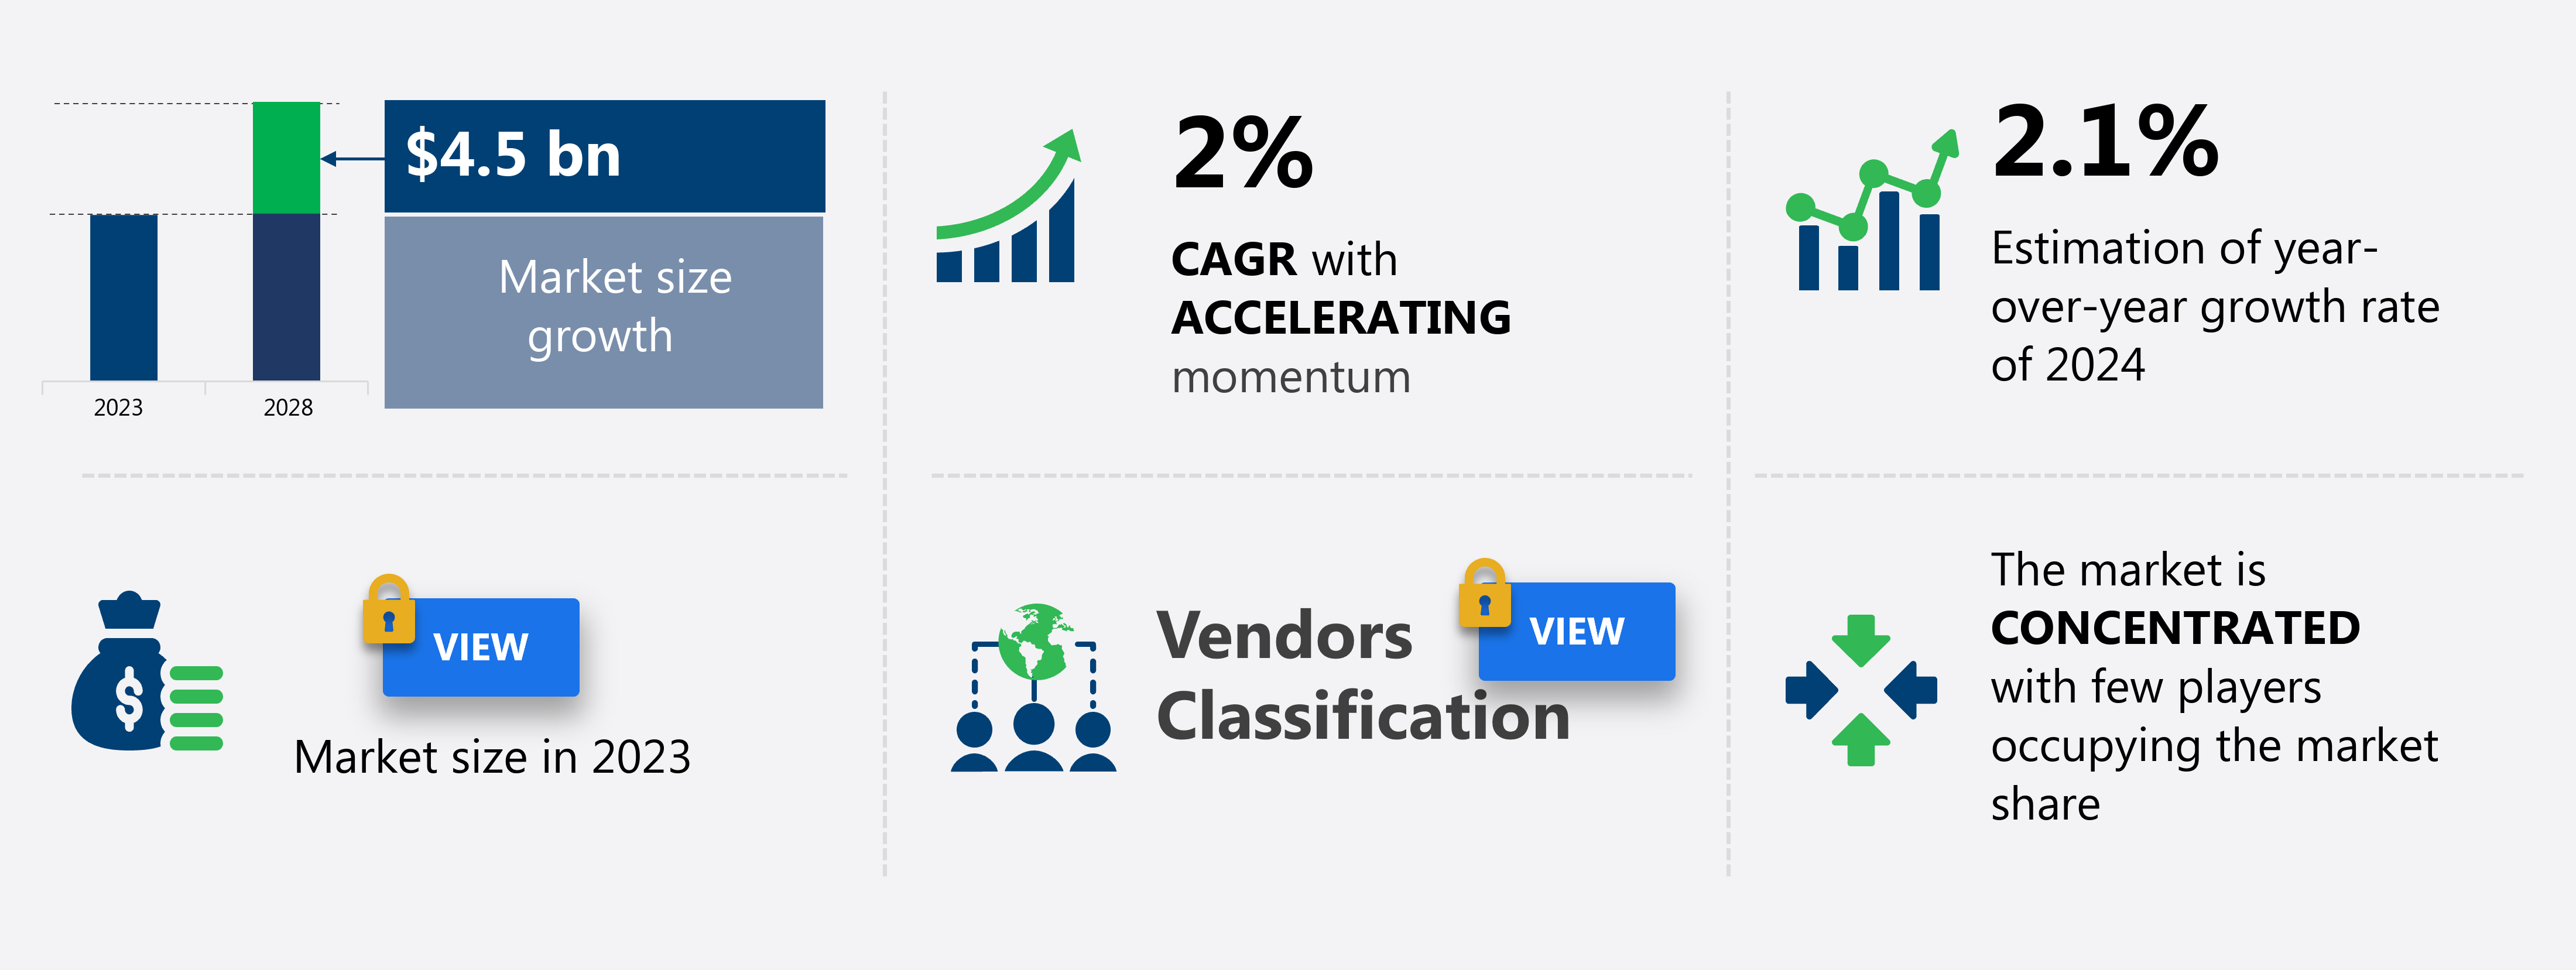
The Japan coal market size is forecast to increase by USD 4.5 billion, at a CAGR of 2% between 2023 and 2028.
- The market is experiencing significant growth due to the adoption of advanced electricity generation technologies that increase efficiency and reduce the environmental impact of coal usage. Another key trend is the shift towards the utilization of liquid forms of coal as fuel and for electricity production. However, the market faces challenges such as the uncertainty in demand and pricing of coal, which can impact the profitability of coal producers and utilities. These factors, among others, are shaping the market growth.
What will be the Size of the Market During the Forecast Period?
- The market plays a significant role in the global energy sector, supplying a substantial portion of the world's electricity. However, the energy landscape is undergoing a transformation, driven by various factors shaping the future of the power sector. Governments worldwide are formulating energy strategies and policies to promote sustainable development and reduce greenhouse gas emissions, with the shift towards renewable energy sources and energy efficiency gaining momentum. The industrial sector remains a major energy consumer, with thermal power plants contributing significantly to coal demand. However, energy efficiency and automation trends are leading to decreased energy intensity, thereby reducing the demand for coal. Environmental concerns regarding coal consumption are driving the transition towards cleaner energy sources, and the global push for carbon neutrality aligns with sustainable development goals.
- Energy security and independence are vital for many countries, with coal production and imports playing a role. However, the renewable energy sector is growing due to favorable policies and competitive pricing. The coal industry is investing in carbon capture technologies to reduce emissions, while energy conservation and off-grid solutions are promoting efficiency. Research and technological advancements in energy storage and grid modernization further support the transition to renewable energy, reducing reliance on coal. As the energy sector transitions to a low-carbon future, the coal market faces challenges, requiring a well-planned roadmap to navigate this shift. The energy sector is at a crossroads, with the future focusing on cleaner, more sustainable energy.
How is this market segmented and which is the largest segment?
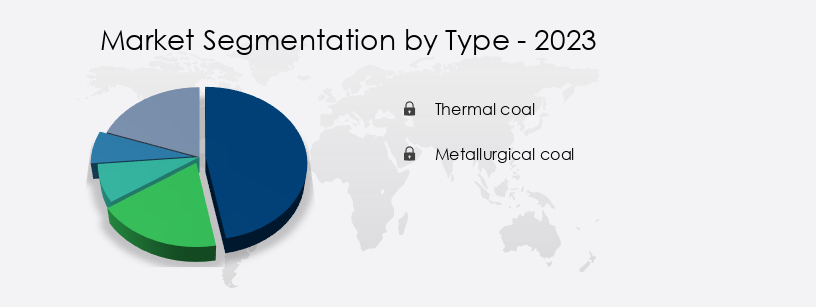
The market research report provides comprehensive data (region-wise segment analysis), with forecasts and estimates in "USD billion" for the period 2024-2028, as well as historical data from 2018-2022 for the following segments.
- Type
- Thermal coal
- Metallurgical coal
- Source
- Import
- Domestic
- Geography
- Japan
By Type Insights
- The thermal coal segment is estimated to witness significant growth during the forecast period.
Coal continues to be a significant and cost-effective energy source for power generation in various economies. In 2023, coal-fueled power generation accounted for over 30% of Japan's total electricity production. Thermal coal is the primary fuel used in power plants to generate electricity. To enhance the thermal efficiency of power generation and decrease emissions, countries are transitioning to high-efficiency, low-emission (HELE) coal-fired power plants. Innovative combustion technologies, such as ultra-supercritical (USC) and advanced ultra-supercritical (AUSC), are being developed and implemented. As a result, the demand for thermal coal is projected to rise during the forecast period due to its affordability as an energy source and the anticipated reduction in carbon dioxide emissions through the adoption of advanced technologies.
Get a glance at the market report of share of various segments Request Free Sample
Market Dynamics
Our market researchers analyzed the data with 2023 as the base year, along with the key drivers, trends, and challenges. A holistic analysis of drivers will help companies refine their marketing strategies to gain a competitive advantage.
What are the key market drivers leading to the rise in the market?
Better electricity generation technology is the key driver of the market.
- The market is a significant contributor to global power production, with coal-fired power stations being the primary source of electricity for many countries. However, the use of coal in power generation raises concerns regarding air pollution and the associated health disorders. To mitigate these issues, there is a growing emphasis on renewable energy generation, such as solar power, as an alternative energy source. The solar park scheme and supportive policies for renewable energy capacity expansion are gaining traction in various sectors, including telecom, hospitality, and industrial growth in emerging economies. Coal imports remain a crucial aspect of the coal market, particularly for industries with high energy demand, such as heavy industries, sugar mills, construction spending, and specialty chemical manufacturing.
- The coal industry continues to be a major raw material source for electricity production and industrial growth, particularly in urbanizing areas. However, the focus on improving thermal efficiency and reducing CO2 emissions has led to the adoption of advanced technologies like cyclone furnaces and pulverized coal in coal-fired power plants. The International Energy Agency (IEA) and other international bodies are encouraging the use of subcritical boiler technology in coal-fired power stations, which helps in reducing CO2 emissions while maintaining thermal efficiency. The shift towards renewable energy sources and the adoption of energy-efficient technologies are expected to impact the coal market's future growth trajectory.
- Gas turbines and other low-emission technologies are also gaining popularity in power production, offering a viable alternative to coal-fired power stations. In conclusion, the coal market is undergoing significant changes as countries strive to reduce CO2 emissions and energy consumption to minimize costs. The shift towards renewable energy sources and energy-efficient technologies, along with supportive policies and advancements in coal-fired power plant technology, are shaping the future of the coal market.
What are the market trends shaping the Japan Coal Market?
Usage of liquid form of coal as fuel and electricity is the upcoming trend in the market.
- Coal plays a crucial role in power generation, particularly in thermal power stations that rely on coal-fired boilers for electricity production. However, the increasing concerns over air pollution have led to supportive policies encouraging the shift towards renewable energy sources such as solar power and wind energy. Renewable energy generation from solar parks and other schemes is on the rise, with installed capacity increasing significantly in recent years. Coal reserves remain a substantial energy source for heavy industries, hospitality, and other sectors. Despite the push towards renewables, coal continues to be a significant contributor to power production, particularly in emerging economies.
- Coal-fired power plants use coal as a raw material for combustion to generate electricity. However, the combustion process produces harmful pollutants, contributing to health disorders and environmental degradation. Lignite resources, a type of low-grade coal, are also used in the production of synthetic fuels, including liquids and gases. These synthetic fuels can act as alternatives to conventional oil products, particularly in the transportation sector. Coal-derived liquids produce fewer air pollutants than burning coal directly and are sulfur-free, making them a more environmentally friendly alternative. The energy demand from sectors such as telecom, construction spending, industrial growth, and specialty chemical manufacturing continues to increase, driving the need for reliable and affordable energy sources.
- Coal remains a critical energy source for these industries, particularly in regions where renewable energy capacity is not yet fully developed. Gas turbines are also used in power production, offering higher thermal efficiency and lower emissions compared to coal-fired power plants. The gas turbine service industry has seen significant growth in recent years, driven by the increasing demand for cleaner and more efficient energy sources. In conclusion, coal remains an essential energy source for power generation, particularly in industries that require large amounts of energy. However, the increasing concerns over air pollution and health disorders have led to supportive policies encouraging the shift towards renewable energy sources.
What challenges does the market face during the growth?
Uncertainty in demand and price of coal is a key challenge affecting the market growth.
- The market faces uncertainty due to the shifting energy landscape and volatile coal demand. Japan's commitment to reducing carbon emissions and transitioning to renewable energy sources, such as solar power and wind, has led to increased volatility in coal demand for electricity generation. The country's reliance on coal for power production, particularly in thermal power stations, remains significant, but supportive policies for renewable energy generation through initiatives like the solar park scheme are gaining momentum. Global coal prices are influenced by various factors, including supply from major coal-exporting countries like Australia, Indonesia, and Russia, geopolitical tensions, and energy policies.
- These fluctuations add to the price instability in the coal market, making it challenging for coal-fired power plants, including cyclone furnaces and those using pulverized coal, to maintain consistent operations. Moreover, the increasing adoption of cleaner energy sources like natural gas and gas turbines in industries such as telecom, heavy industries, hospitality, sugar mills, construction, and specialty chemical manufacturing, further impacts the coal market. The economic growth in emerging economies and the growing demand for electricity production and electricity generation in urban areas also contribute to the energy demand, which can shift away from coal towards more sustainable energy sources.
- The health concerns associated with coal combustion, including health disorders, also add to the pressure on the coal market. As the world moves towards more sustainable energy sources, the coal industry must adapt to remain competitive. The market, like many others, is subject to these global trends and challenges.
Exclusive Customer Landscape
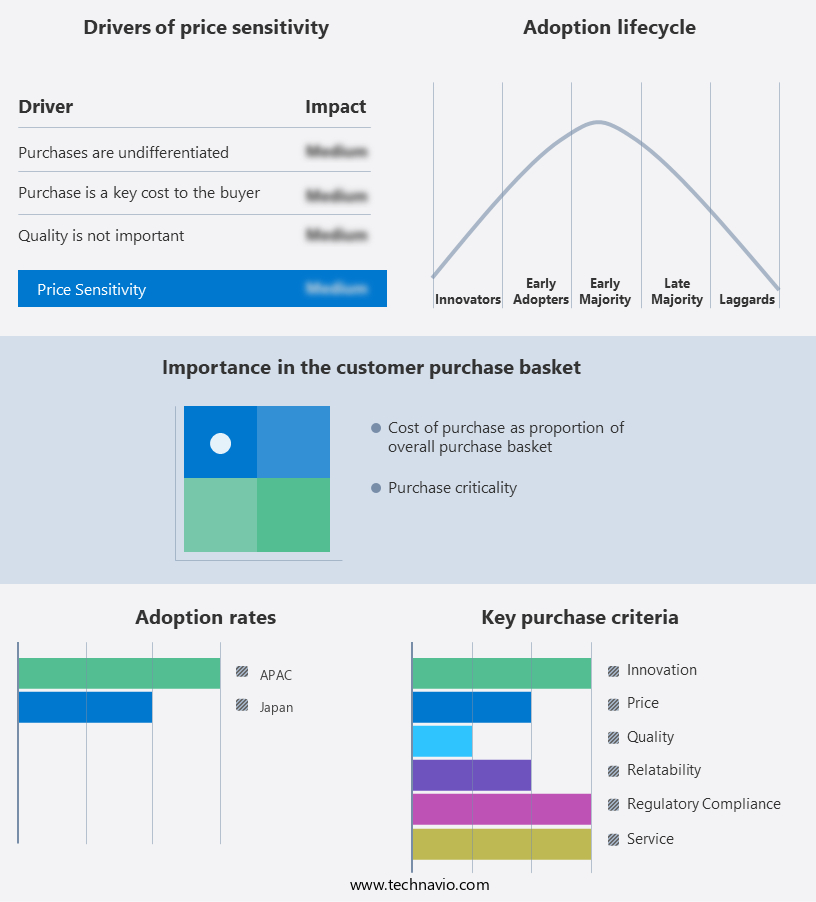
The market forecasting report includes the adoption lifecycle of the market, covering from the innovator's stage to the laggard's stage. It focuses on adoption rates in different regions based on penetration. Furthermore, the market report also includes key purchase criteria and drivers of price sensitivity to help companies evaluate and develop their market growth analysis strategies.
Customer Landscape
Key Companies & Market Insights
Companies are implementing various strategies, such as strategic alliances, market forecast , partnerships, mergers and acquisitions, geographical expansion, and product/service launches, to enhance their presence in the market.
Banpu Public Co. Ltd. - The company offers thermal coal to the domestic and export markets.
The market research and growth report includes detailed analyses of the competitive landscape of the market and information about key companies, including:
- BHP Group Ltd.
- Bloomfield Group
- Chiyoda Corp.
- ITOCHU Corp.
- Jellinbah Group Pty Ltd.
- J-POWER Electric Power Development Co. Ltd.
- L3Harris Technologies Inc.
- Mitsubishi Heavy Industries Ltd.
- Mitsui and Co. Ltd.
- QCoal Pty Ltd.
- Shandong Energy Group Co. Ltd.
Qualitative and quantitative analysis of companies has been conducted to help clients understand the wider business environment as well as the strengths and weaknesses of key market players. Data is qualitatively analyzed to categorize companies as pure play, category-focused, industry-focused, and diversified; it is quantitatively analyzed to categorize companies as dominant, leading, strong, tentative, and weak.
Research Analyst Overview
The market continues to be a significant player in the global energy landscape, supplying a substantial portion of the world's power generation needs. However, the market is experiencing various dynamics that are shaping its future. Coal imports have been a critical aspect of the coal market, with several countries relying on international trade to meet their energy demands. The demand for coal imports is driven by the need for a reliable and affordable energy source, especially in emerging economies undergoing rapid industrial growth. Air pollution, however, is a growing concern in the coal market. The combustion of coal in power stations, particularly coal-fired power plants, contributes significantly to air pollution, leading to health disorders such as respiratory diseases and cardiovascular conditions. This has resulted in supportive policies being implemented to promote the use of renewable energy sources and improve the thermal efficiency of existing coal-fired power plants. Renewable energy, particularly solar power, is gaining popularity as an alternative to coal.
In addition, solar parks and schemes are being established in various parts of the world to increase renewable energy generation capacity. The installed generation capacity of solar power has been increasing steadily, with several countries setting ambitious targets to meet their energy demands through renewable sources. Power stations, including thermal power stations, are undergoing technological advancements to improve their efficiency and reduce their carbon footprint. Gas turbines are being used increasingly in power production, with gas turbine services becoming an essential part of the power generation industry. Heavy industries, such as telecom, hospitality, and specialty chemical manufacturing, continue to rely on coal as a raw material. However, the increasing awareness of the environmental impact of coal usage is leading to the adoption of cleaner technologies and the exploration of alternative energy sources.
Further, the coal industry is facing challenges from various sectors, including urbanization, economic growth, and energy demand. Urbanization is leading to an increase in disposable income and the demand for electricity, putting pressure on the power supply. Economic growth in emerging economies is driving the demand for energy, leading to an increase in coal usage. Energy demand is also increasing due to the growth of industries such as construction spending and sugar mills. Coal reserves are a significant resource for several countries, and their usage is essential for power generation. However, the depletion of high-grade coal reserves and the increasing availability of low-grade coal are posing challenges for the coal industry. The coal industry is also facing competition from other energy sources, such as natural gas and renewable energy.
|
Market Scope |
|
|
Report Coverage |
Details |
|
Page number |
130 |
|
Base year |
2023 |
|
Historic period |
2018-2022 |
|
Forecast period |
2024-2028 |
|
Growth momentum & CAGR |
Accelerate at a CAGR of 2% |
|
Market Growth 2024-2028 |
USD 4.5 billion |
|
Market structure |
Concentrated |
|
YoY growth 2023-2024(%) |
2.1 |
|
Competitive landscape |
Leading Companies, Market Positioning of Companies, Competitive Strategies, and Industry Risks |
What are the Key Data Covered in this Market Research and Growth Report?
- CAGR of the market during the forecast period
- Detailed information on factors that will drive the market growth and forecasting between 2024 and 2028
- Precise estimation of the size of the market and its contribution of the market in focus to the parent market
- Accurate predictions about upcoming market growth and trends and changes in consumer behaviour
- Growth of the market across Japan
- Thorough analysis of the market's competitive landscape and detailed information about companies
- Comprehensive analysis of factors that will challenge the growth of market companies
We can help! Our analysts can customize this market research report to meet your requirements.
 RIA -
RIA - 
