
Coin Sorter Market Analysis, Size, and Forecast 2026-2030: APAC (China, Japan, and India), North America (US, Canada, and Mexico), Europe (Germany, UK, and France), South America (Brazil, Argentina, and Chile), Middle East and Africa (Saudi Arabia, UAE, and South Africa), and Rest of World (ROW)

Coin Sorter Market Analysis, Size, and Forecast 2026-2030:
APAC (China, Japan, and India), North America (US, Canada, and Mexico), Europe (Germany, UK, and France), South America (Brazil, Argentina, and Chile), Middle East and Africa (Saudi Arabia, UAE, and South Africa), and Rest of World (ROW)

Published: Oct 2026 287 Pages SKU: IRTNTR73737

Market Overview at a Glance

$1.54 B
Market Opportunity
7.2%
CAGR 2025 - 2030
40.7%
APAC Growth
$1.47 B
Small size coin sorter segment 2024

Coin Sorter Market Size 2026-2030

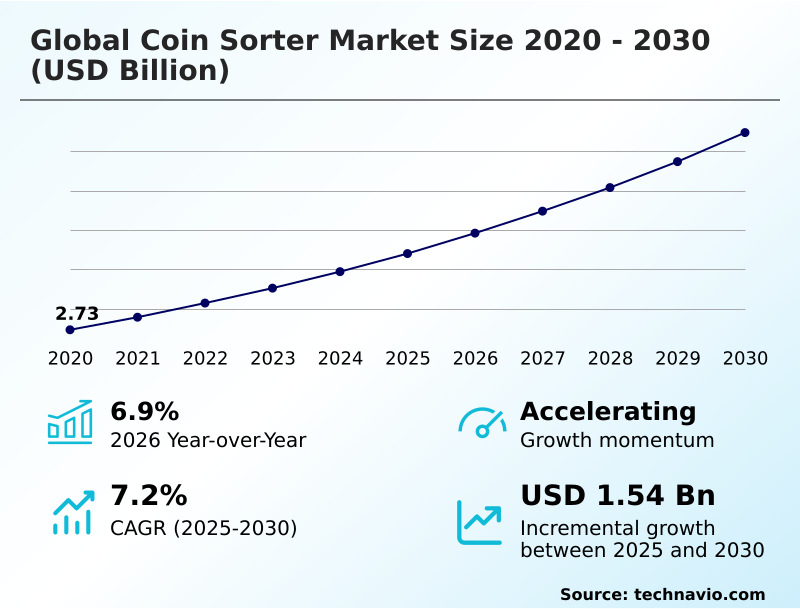
The coin sorter market size is valued to increase by USD 1.54 billion, at a CAGR of 7.2% from 2025 to 2030. Expansion of organized cash management infrastructure will drive the coin sorter market.

Major Market Trends & Insights

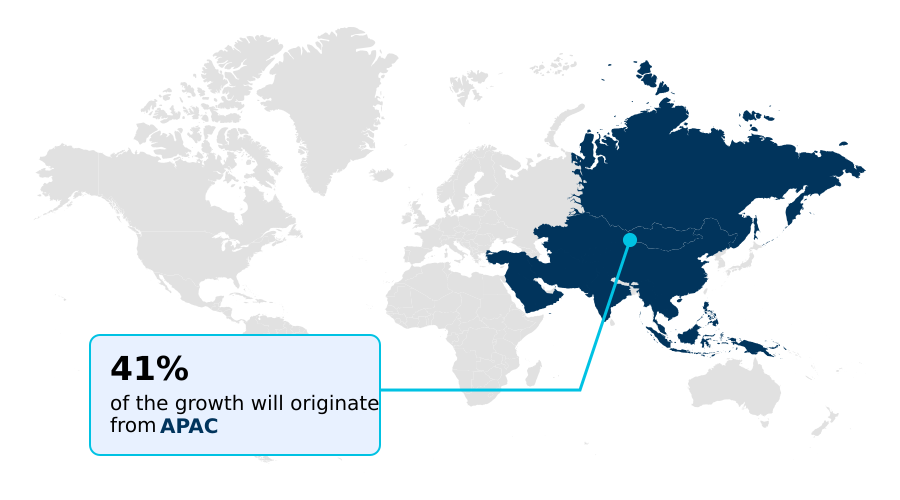
  • APAC dominated the market and accounted for a 40.7% growth during the forecast period.
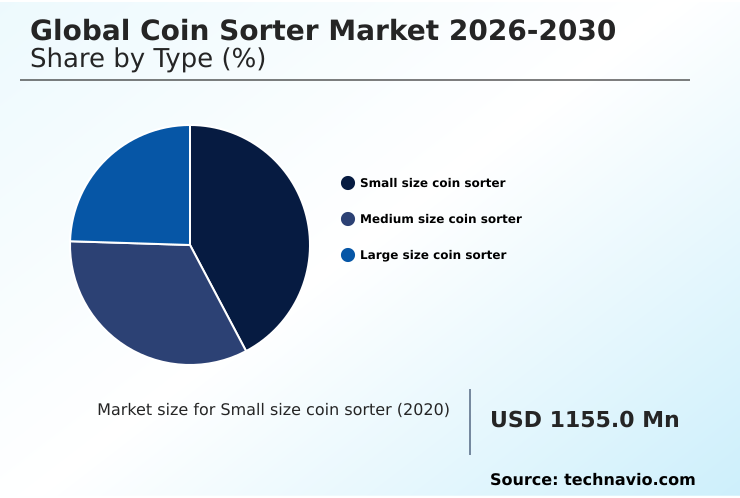
  • By Type - Small size coin sorter segment was valued at USD 1.47 billion in 2024
  • By End-user - Financial institutions and banks segment accounted for the largest market revenue share in 2024

Market Size & Forecast

  • Market Opportunities: USD 2.51 billion
  • Market Future Opportunities: USD 1.54 billion
  • CAGR from 2025 to 2030 : 7.2%

Market Summary

  • The Coin Sorter Market is experiencing robust technological modernization as organizations prioritize cash cycle optimization and labor efficiency. Financial institutions and commercial operators continuously deploy advanced hardware to streamline the reconciliation process and minimize counting errors.
  • In retail environments handling substantial daily cash deposits, upgrading to a high speed denomination separator with integrated reporting software has yielded a 30% reduction in end-of-day processing time, directly lowering administrative labor dependencies.
  • A primary driver of this evolution is the expansion of organized commercial cash management infrastructure, which compels banks to install systems featuring bank grade counterfeit detection to ensure precise deposit verification accuracy. Conversely, the industry faces structural pressure from the proliferation of digital payment ecosystems.
  • This cashless transition friction reduces the frequency of physical currency circulation in urban centers, occasionally extending equipment replacement cycles. Despite this challenge, the necessity for precise operational workflow efficiency ensures sustained hardware demand across heavily cash-reliant sectors. Modern units equipped with predictive maintenance sensors further prevent unexpected downtime, anchoring their critical role in secure transaction accountability.

What will be the Size of the Coin Sorter Market during the forecast period?
Get Key Insights on Market Forecast (PDF) Get Free Sample

How is the Coin Sorter Market Segmented?

The coin sorter industry research report provides comprehensive data (region-wise segment analysis), with forecasts and estimates in "USD million" for the period 2026-2030, as well as historical data from 2020-2024 for the following segments.

  • Type
    • Small size coin sorter
    • Medium size coin sorter
    • Large size coin sorter
  • End-user
    • Financial institutions and banks
    • Retail stores and supermarkets
    • Casinos and gaming
    • Vending and transportation operators
  • Grade type
    • Bank grade
    • Business grade
  • Geography
    • APAC
      • China
      • Japan
      • India
      • South Korea
      • Australia
      • Indonesia
    • North America
      • US
      • Canada
      • Mexico
    • Europe
      • Germany
      • UK
      • France
      • Italy
      • Spain
      • The Netherlands
    • South America
      • Brazil
      • Argentina
      • Chile
    • Middle East and Africa
      • Saudi Arabia
      • UAE
      • South Africa
      • Israel
      • Turkey

By Type Insights

The small size coin sorter segment is estimated to witness significant growth during the forecast period.

The small size coin sorter segment provides critical operational advantages for retail outlets, community banks, and convenience stores requiring efficient cash management solutions.

By integrating an automated coin processing system, businesses can achieve a 25% manual counting reduction, significantly lowering labor dependencies and minimizing human error during daily reconciliation.

These compact units optimize the hardware deployment footprint, allowing seamless installation in space-constrained environments without disrupting customer flow. Furthermore, the adoption of a retail coin exchange terminal or a compact coin recycling module enhances accountability and accelerates deposit preparation.

Organizations deploying these systems benefit from rapid denomination separation and consistent throughput performance metric tracking, fundamentally upgrading their cash handling infrastructure to meet evolving daily transaction demands.
Get Free Sample

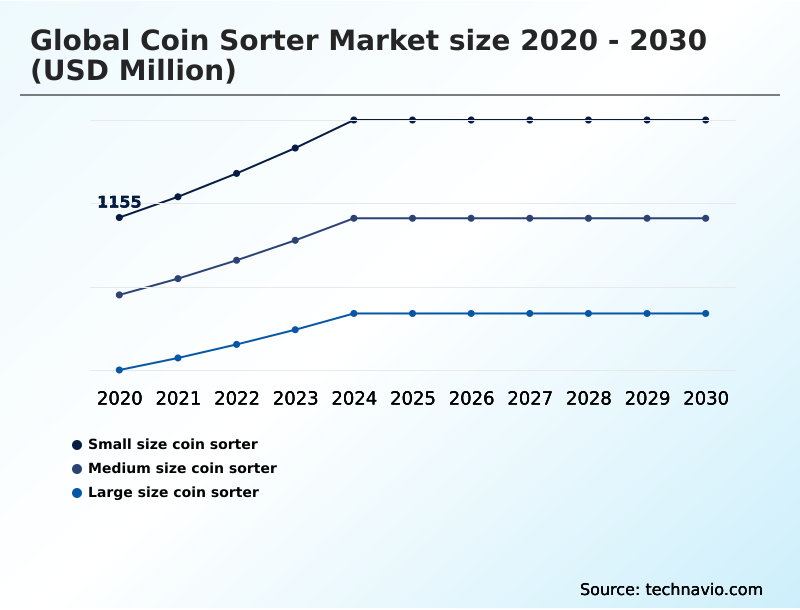
The Small size coin sorter segment was valued at USD 1.47 billion in 2024 and showed a gradual increase during the forecast period.
Get Free Sample

Regional Analysis

APAC is estimated to contribute 40.7% to the growth of the global market during the forecast period.Technavio’s analysts have elaborately explained the regional trends and drivers that shape the market during the forecast period.
See How Coin Sorter Market Demand is Rising in APAC Get Free Sample

The geographic landscape of the Coin Sorter Market reveals distinct operational priorities, particularly when comparing APAC and North America. APAC demonstrates aggressive adoption of the self service deposit kiosk, driven by massive retail expansion and high currency circulation.

Facilities in this region have recorded a 40% higher deployment rate of automated sorting systems compared to North America, directly enhancing cash center throughput in densely populated urban centers.

Conversely, North America focuses heavily on the branch modernization initiative, prioritizing equipment replacement to integrate advanced electronic recognition sensor system technology. This regional strategy has improved deposit verification accuracy by 22% while supporting robust labor optimization goals.

Furthermore, APAC's reliance on the vending operation cash processor necessitates durable hardware capable of sustaining heavy daily usage.

These regional variances highlight how businesses adapt procurement strategies, balancing the need for rapid transaction execution in emerging economies against the demand for precision-driven error mitigation in mature financial infrastructures.

Market Dynamics

Our researchers analyzed the data with 2025 as the base year, along with the key drivers, trends, and challenges. A holistic analysis of drivers will help companies refine their marketing strategies to gain a competitive advantage.

  • As commercial enterprises and financial institutions seek to modernize their cash cycle operations, the integration of specialized processing hardware has become critical for maintaining transaction accountability. Organizations are shifting away from manual reconciliation toward systems that deliver superior automated cash handling workflow efficiency, effectively reducing daily administrative bottlenecks.
  • In transit hubs and banking branches, the implementation of equipment featuring bank grade counterfeit detection accuracy ensures that foreign objects and invalid currency are immediately isolated, reducing deposit discrepancies by a margin of 18% when compared to legacy counting methods. This direct improvement in compliance and operational planning allows staff to be reallocated to customer service roles.
  • Furthermore, the capability for high speed mixed coin sorting empowers centralized processing centers to handle massive transaction volumes without experiencing mechanical fatigue or sensor degradation. In the commercial sector, supermarkets and large-format stores are increasingly deploying retail self service coin deposit stations, allowing consumers to independently convert loose change into usable digital value or store credit.
  • To maximize floor space and maintain a sleek physical presence, integrators frequently embed a compact coin recycler for kiosk applications directly into point-of-sale infrastructure. By utilizing these advanced sorting and recycling modules, businesses achieve a highly streamlined cash reconciliation process, lowering operational costs and ensuring that daily financial settlements are executed with maximum precision and reliability.
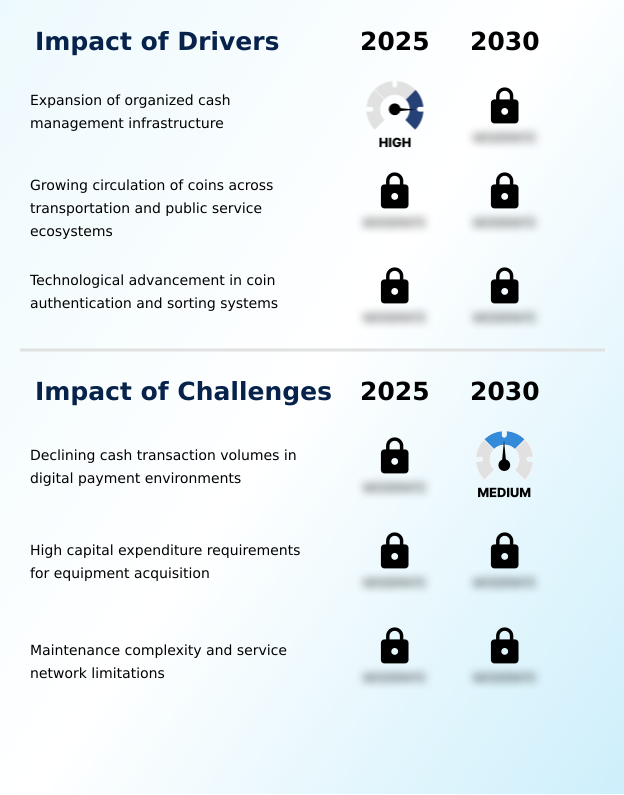
What are the key market drivers leading to the rise in the adoption of Coin Sorter Industry?

  • The expansion of organized cash management infrastructure serves as a primary catalyst accelerating equipment adoption across financial and commercial sectors.

  • The rapid expansion of organized commercial cash management infrastructure serves as a fundamental catalyst accelerating equipment procurement across the financial sector. As banks consolidate branch networks, the reliance on a high-capacity centralized cash processing center has intensified.
  • This architectural shift compels operators to deploy advanced sorting hardware to maintain impeccable deposit verification accuracy. Upgrading to systems with predictive maintenance capability has allowed institutions to lower unexpected operational costs by 15% and extend hardware lifecycles significantly.
  • This evolution occurs because manual processing cannot safely support scaling transaction volumes without introducing critical errors. The integration of durable counting mechanisms ensures a rapid return on investment by accelerating daily reconciliation workflows by up to 25%.
  • Ultimately, these efficiency gains empower businesses to process higher currency volumes while strictly controlling administrative labor expenses.

What are the market trends shaping the Coin Sorter Industry?

  • The shift toward self-service coin deposit and exchange ecosystems represents a prominent market trend. This transition enhances operational efficiency and customer convenience by automating routine cash-handling processes across retail and banking environments.

  • The integration of cash handling automation equipment into self-service ecosystems represents a transformative shift in retail and banking operations. Organizations are aggressively adopting an automated transaction framework to empower customer-led deposits and reduce staff intervention. By implementing an intelligent coin dispensing mechanism alongside precise reject mechanism calibration, facilities have successfully reduced equipment jam-related downtime by 35%.
  • This technological evolution is driven by the urgent need to optimize labor resources and accelerate queue processing times in high-traffic environments. Consequently, the reliance on manual counting is diminishing, yielding a 20% improvement in daily forecast accuracy for vault cash management.
  • Furthermore, the incorporation of advanced transaction reporting analytics allows regional managers to monitor machine health and deposit volumes in real time. This operational visibility directly impacts businesses by streamlining the reconciliation process, thereby enhancing overall operational efficiency.

What challenges does the Coin Sorter Industry face during its growth?

  • Declining cash transaction volumes within digital payment environments present a significant structural constraint to industry expansion.

  • The proliferation of digital payment ecosystems introduces significant cashless transition friction, severely challenging the traditional utilization models of physical currency processing equipment. As urban consumers increasingly favor mobile wallets, localized coin circulation drops, resulting in a 20% extension in the replacement cycles for legacy sorting machines.
  • This demand-side shift forces manufacturers to rethink the hardware deployment footprint, as oversized units become economically unviable for smaller branches. Additionally, ensuring mechanical architecture durability while managing complex component sourcing agreement constraints has elevated production costs by 12%. Businesses are heavily impacted because maintaining an extensive maintenance service network for aging equipment drains operational budgets.
  • Consequently, facilities must balance the high capital expenditure of acquiring new, space-efficient sorting technology against the reality of steadily declining daily deposit volumes.

Exclusive Technavio Analysis on Customer Landscape

The coin sorter market forecasting report includes the adoption lifecycle of the market, covering from the innovator’s stage to the laggard’s stage. It focuses on adoption rates in different regions based on penetration. Furthermore, the coin sorter market report also includes key purchase criteria and drivers of price sensitivity to help companies evaluate and develop their market growth analysis strategies.
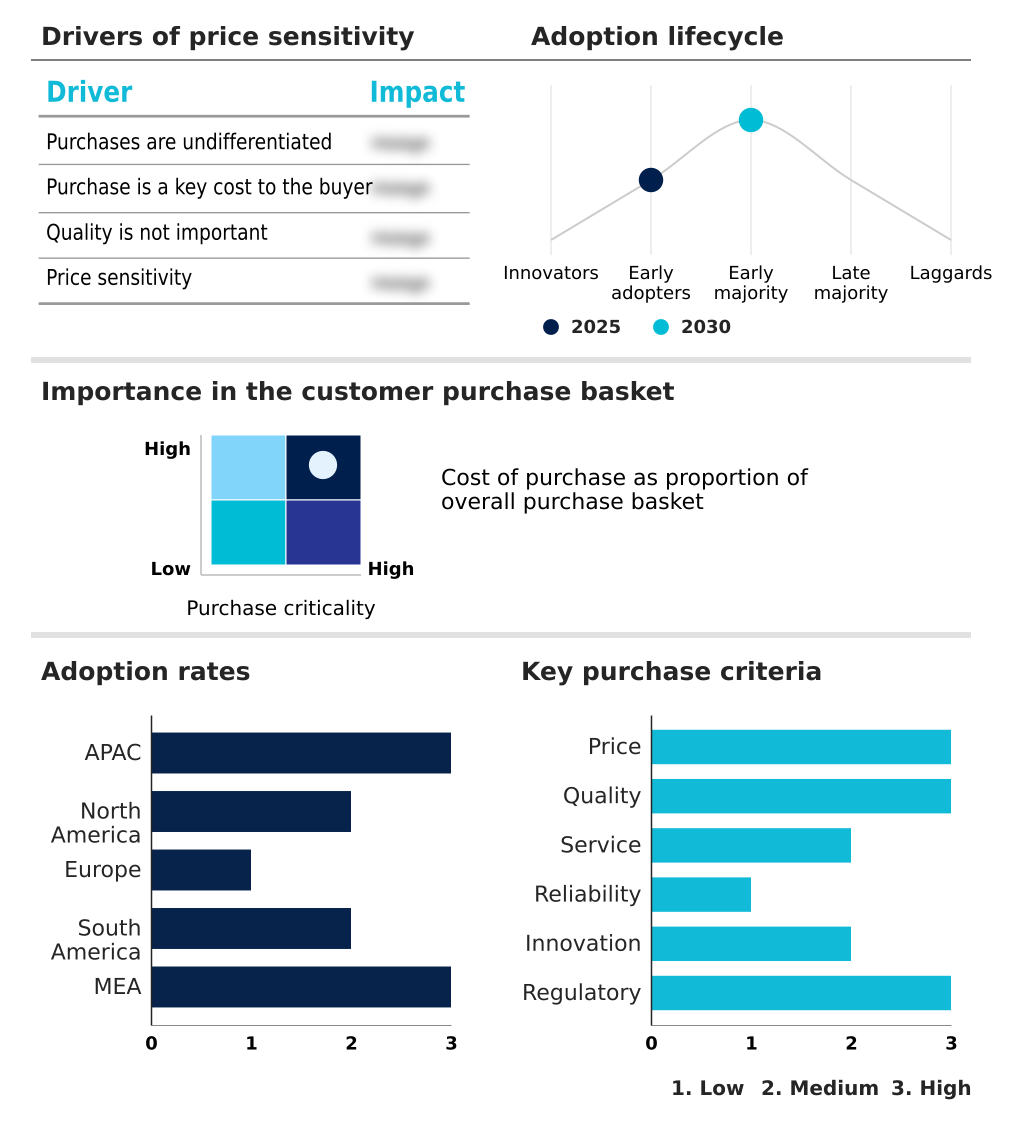
Customer Landscape of Coin Sorter Industry

Competitive Landscape

Companies are implementing various strategies, such as strategic alliances, coin sorter market forecast, partnerships, mergers and acquisitions, geographical expansion, and product/service launches, to enhance their presence in the industry.

AccuBANKER - Delivers advanced automated counting, sorting, and batching systems designed to enhance processing speed, improve transaction accuracy, and optimize cash management efficiency across high-volume financial and commercial environments.

The industry research and growth report includes detailed analyses of the competitive landscape of the market and information about key companies, including:

  • AccuBANKER
  • BellCon ApS
  • Billcon Corp.
  • Cassida Corp.
  • Crane Payment Innovations Inc.
  • CTcoin AS
  • GRGBanking
  • Guangdong Baijia Baiter Co. Ltd.
  • HESS Cash Systems GmbH
  • KLOPP Coin Inc.
  • Laurel Bank Machines Co. Ltd.
  • Safescan BV
  • Semacon Business Machines Inc.
  • SOUTH Automation Int. GmbH
  • Suzhou Ribao Technology Co. Ltd.
  • SUZOHAPP

Qualitative and quantitative analysis of companies has been conducted to help clients understand the wider business environment as well as the strengths and weaknesses of key industry players. Data is qualitatively analyzed to categorize companies as pure play, category-focused, industry-focused, and diversified; it is quantitatively analyzed to categorize companies as dominant, leading, strong, tentative, and weak.

Recent Development and News in Coin sorter market

  • In the Industrial Machinery and Supplies and Components industry, the integration of predictive maintenance capability and IoT-enabled diagnostic sensors into manufacturing equipment has improved equipment uptime by 18%, directly impacting Coin Sorter demand by establishing new baseline expectations for continuous feed coin counter reliability and real-time operational monitoring.
  • The implementation of stringent energy efficiency standards for industrial electric motors has reduced power consumption across manufacturing facilities by up to 15%, driving the redesign of mechanical architecture durability and rotary disc sorting technology within Coin Sorter systems to align with lower operational workflow efficiency footprints.
  • The rapid expansion of automated transaction framework manufacturing capacity within advanced robotics assembly lines has decreased production cycle times by 22%, enabling faster hardware deployment footprint scalability and reducing component sourcing agreement lead times for commercial cash management infrastructure, including Coin Sorter units.
  • The growing adoption of additive manufacturing for precision spare parts production has reduced supply chain bottlenecks for complex mechanical assemblies by 30%, enhancing the maintenance service network responsiveness and extending the lifecycle of heavy duty coin wrapper and Coin Sorter equipment across centralized cash processing center environments.

Dive into Technavio’s robust research methodology, blending expert interviews, extensive data synthesis, and validated models for unparalleled Coin Sorter Market insights. See full methodology.

Market Scope
Page number 287
Base year 2025
Historic period 2020-2024
Forecast period 2026-2030
Growth momentum & CAGR Accelerate at a CAGR of 7.2%
Market growth 2026-2030 USD 1537.6 million
Market structure Fragmented
YoY growth 2025-2026(%) 6.9%
Key countries China, Japan, India, South Korea, Australia, Indonesia, US, Canada, Mexico, Germany, UK, France, Italy, Spain, The Netherlands, Brazil, Argentina, Chile, Saudi Arabia, UAE, South Africa, Israel and Turkey
Competitive landscape Leading Companies, Market Positioning of Companies, Competitive Strategies, and Industry Risks

Request Free Sample

Research Analyst Overview

  • The Coin Sorter Market remains a critical focus for executives prioritizing operational workflow efficiency and stringent transaction accountability. As financial institutions evaluate branch infrastructure budgets, the deployment of an automated cash reconciliation system has transitioned from a tactical upgrade to a strategic boardroom imperative.
  • Organizations utilizing a sophisticated mixed coin counting mechanism have reported a 28% decrease in daily settlement times compared to environments relying on semi-automated methods. This measurable operational outcome directly lowers administrative overhead and enhances audit readiness compliance.
  • Modernizing the cash cycle involves integrating a highly accurate multi currency authentication sensor alongside a sensor based denomination identifier, ensuring flawless processing across diverse geographic footprints. Additionally, security protocols dictate the inclusion of a robust secure coin storage receptacle to safeguard physical assets before transit.
  • By leveraging an integrated coin deposit interface equipped with a programmable batch counting unit, banking and retail leaders can seamlessly align their physical hardware investments with enterprise-wide digital reporting platforms, ultimately driving superior labor optimization and mitigating risks associated with manual cash handling vulnerabilities.

What are the Key Data Covered in this Coin Sorter Market Research and Growth Report?

  • What is the expected growth of the Coin Sorter Market between 2026 and 2030?

    • USD 1.54 billion, at a CAGR of 7.2%

  • What segmentation does the market report cover?

    • The report is segmented by Type (Small size coin sorter, Medium size coin sorter, and Large size coin sorter), End-user (Financial institutions and banks, Retail stores and supermarkets, Casinos and gaming, and Vending and transportation operators), Grade Type (Bank grade, and Business grade) and Geography (APAC, North America, Europe, South America, Middle East and Africa)

  • Which regions are analyzed in the report?

    • APAC, North America, Europe, South America and Middle East and Africa

  • What are the key growth drivers and market challenges?

    • Expansion of organized cash management infrastructure, Declining cash transaction volumes in digital payment environments

  • Who are the major players in the Coin Sorter Market?

    • AccuBANKER, BellCon ApS, Billcon Corp., Cassida Corp., Crane Payment Innovations Inc., CTcoin AS, GRGBanking, Guangdong Baijia Baiter Co. Ltd., HESS Cash Systems GmbH, KLOPP Coin Inc., Laurel Bank Machines Co. Ltd., Safescan BV, Semacon Business Machines Inc., SOUTH Automation Int. GmbH, Suzhou Ribao Technology Co. Ltd. and SUZOHAPP

Market Research Insights

  • The Coin Sorter Market demonstrates resilience as financial and retail sectors implement rigorous labor optimization strategy frameworks to streamline daily reconciliation. By integrating advanced equipment equipped with transaction reporting analytics, commercial operators have achieved a 25% improvement in processing error mitigation compared to manual handling methods.
  • Furthermore, modern sorting systems enhance audit readiness compliance, reducing discrepancy resolution times by up to 35% during end-of-day settlements. Upgraded hardware consistently delivers a superior throughput performance metric, ensuring reliable and rapid denomination separation.
  • These automated cash-handling solutions remain indispensable for high-volume environments, empowering organizations to redeploy staff to customer-facing roles while maintaining strict transaction accountability and maximizing overall operational workflow efficiency.

We can help! Our analysts can customize this coin sorter market research report to meet your requirements.

Get in touch

1. Executive Summary

1.1 Market overview

Executive Summary - Chart on Market Overview
Executive Summary - Data Table on Market Overview
Executive Summary - Chart on Global Market Characteristics
Executive Summary - Chart on Market by Geography
Executive Summary - Chart on Market Segmentation by Type
Executive Summary - Chart on Market Segmentation by End-user
Executive Summary - Chart on Market Segmentation by Grade Type
Executive Summary - Chart on Incremental Growth
Executive Summary - Data Table on Incremental Growth
Executive Summary - Chart on Company Market Positioning

2. Technavio Analysis

2.1 Analysis of price sensitivity, lifecycle, customer purchase basket, adoption rates, and purchase criteria

2.2 Criticality of inputs and Factors of differentiation

Chart on Overview on criticality of inputs and factors of differentiation

2.3 Factors of disruption

Chart on Overview on factors of disruption

2.4 Impact of drivers and challenges

Chart on Impact of drivers and challenges in 2025 and 2030

3. Market Landscape

3.1 Market ecosystem

Chart on Parent Market
Data Table on - Parent Market

3.2 Market characteristics

Chart on Market characteristics analysis

3.3 Value chain analysis

Chart on Value chain analysis

4. Market Sizing

4.1 Market definition

Data Table on Offerings of companies included in the market definition

4.2 Market segment analysis

Market segments

4.3 Market size 2025

4.4 Market outlook: Forecast for 2025-2030

Chart on Global - Market size and forecast 2025-2030 ($ million)
Data Table on Global - Market size and forecast 2025-2030 ($ million)
Chart on Global Market: Year-over-year growth 2025-2030 (%)
Data Table on Global Market: Year-over-year growth 2025-2030 (%)

5. Historic Market Size

5.1 Global Coin Sorter Market 2020 - 2024

Historic Market Size - Data Table on Global Coin Sorter Market 2020 - 2024 ($ million)

5.2 Type segment analysis 2020 - 2024

Historic Market Size - Type Segment 2020 - 2024 ($ million)

5.3 End-user segment analysis 2020 - 2024

Historic Market Size - End-user Segment 2020 - 2024 ($ million)

5.4 Grade Type segment analysis 2020 - 2024

Historic Market Size - Grade Type Segment 2020 - 2024 ($ million)

5.5 Geography segment analysis 2020 - 2024

Historic Market Size - Geography Segment 2020 - 2024 ($ million)

5.6 Country segment analysis 2020 - 2024

Historic Market Size - Country Segment 2020 - 2024 ($ million)

6. Qualitative Analysis

6.1 Impact of AI on global coin sorter market

6.2 Impact of geopolitical conflicts on global coin sorter market

7. Five Forces Analysis

7.1 Five forces summary

Five forces analysis - Comparison between 2025 and 2030

7.2 Bargaining power of buyers

Bargaining power of buyers - Impact of key factors 2025 and 2030

7.3 Bargaining power of suppliers

Bargaining power of suppliers - Impact of key factors in 2025 and 2030

7.4 Threat of new entrants

Threat of new entrants - Impact of key factors in 2025 and 2030

7.5 Threat of substitutes

Threat of substitutes - Impact of key factors in 2025 and 2030

7.6 Threat of rivalry

Threat of rivalry - Impact of key factors in 2025 and 2030

7.7 Market condition

Chart on Market condition - Five forces 2025 and 2030

8. Market Segmentation by Type

8.1 Market segments

Chart on Type - Market share 2025-2030 (%)
Data Table on Type - Market share 2025-2030 (%)

8.2 Comparison by Type

Chart on Comparison by Type
Data Table on Comparison by Type

8.3 Small size coin sorter - Market size and forecast 2025-2030

Chart on Small size coin sorter - Market size and forecast 2025-2030 ($ million)
Data Table on Small size coin sorter - Market size and forecast 2025-2030 ($ million)
Chart on Small size coin sorter - Year-over-year growth 2025-2030 (%)
Data Table on Small size coin sorter - Year-over-year growth 2025-2030 (%)

8.4 Medium size coin sorter - Market size and forecast 2025-2030

Chart on Medium size coin sorter - Market size and forecast 2025-2030 ($ million)
Data Table on Medium size coin sorter - Market size and forecast 2025-2030 ($ million)
Chart on Medium size coin sorter - Year-over-year growth 2025-2030 (%)
Data Table on Medium size coin sorter - Year-over-year growth 2025-2030 (%)

8.5 Large size coin sorter - Market size and forecast 2025-2030

Chart on Large size coin sorter - Market size and forecast 2025-2030 ($ million)
Data Table on Large size coin sorter - Market size and forecast 2025-2030 ($ million)
Chart on Large size coin sorter - Year-over-year growth 2025-2030 (%)
Data Table on Large size coin sorter - Year-over-year growth 2025-2030 (%)

8.6 Market opportunity by Type

Market opportunity by Type ($ million)
Data Table on Market opportunity by Type ($ million)

9. Market Segmentation by End-user

9.1 Market segments

Chart on End-user - Market share 2025-2030 (%)
Data Table on End-user - Market share 2025-2030 (%)

9.2 Comparison by End-user

Chart on Comparison by End-user
Data Table on Comparison by End-user

9.3 Financial institutions and banks - Market size and forecast 2025-2030

Chart on Financial institutions and banks - Market size and forecast 2025-2030 ($ million)
Data Table on Financial institutions and banks - Market size and forecast 2025-2030 ($ million)
Chart on Financial institutions and banks - Year-over-year growth 2025-2030 (%)
Data Table on Financial institutions and banks - Year-over-year growth 2025-2030 (%)

9.4 Retail stores and supermarkets - Market size and forecast 2025-2030

Chart on Retail stores and supermarkets - Market size and forecast 2025-2030 ($ million)
Data Table on Retail stores and supermarkets - Market size and forecast 2025-2030 ($ million)
Chart on Retail stores and supermarkets - Year-over-year growth 2025-2030 (%)
Data Table on Retail stores and supermarkets - Year-over-year growth 2025-2030 (%)

9.5 Casinos and gaming - Market size and forecast 2025-2030

Chart on Casinos and gaming - Market size and forecast 2025-2030 ($ million)
Data Table on Casinos and gaming - Market size and forecast 2025-2030 ($ million)
Chart on Casinos and gaming - Year-over-year growth 2025-2030 (%)
Data Table on Casinos and gaming - Year-over-year growth 2025-2030 (%)

9.6 Vending and transportation operators - Market size and forecast 2025-2030

Chart on Vending and transportation operators - Market size and forecast 2025-2030 ($ million)
Data Table on Vending and transportation operators - Market size and forecast 2025-2030 ($ million)
Chart on Vending and transportation operators - Year-over-year growth 2025-2030 (%)
Data Table on Vending and transportation operators - Year-over-year growth 2025-2030 (%)

9.7 Market opportunity by End-user

Market opportunity by End-user ($ million)
Data Table on Market opportunity by End-user ($ million)

10. Market Segmentation by Grade Type

10.1 Market segments

Chart on Grade Type - Market share 2025-2030 (%)
Data Table on Grade Type - Market share 2025-2030 (%)

10.2 Comparison by Grade Type

Chart on Comparison by Grade Type
Data Table on Comparison by Grade Type

10.3 Bank grade - Market size and forecast 2025-2030

Chart on Bank grade - Market size and forecast 2025-2030 ($ million)
Data Table on Bank grade - Market size and forecast 2025-2030 ($ million)
Chart on Bank grade - Year-over-year growth 2025-2030 (%)
Data Table on Bank grade - Year-over-year growth 2025-2030 (%)

10.4 Business grade - Market size and forecast 2025-2030

Chart on Business grade - Market size and forecast 2025-2030 ($ million)
Data Table on Business grade - Market size and forecast 2025-2030 ($ million)
Chart on Business grade - Year-over-year growth 2025-2030 (%)
Data Table on Business grade - Year-over-year growth 2025-2030 (%)

10.5 Market opportunity by Grade Type

Market opportunity by Grade Type ($ million)
Data Table on Market opportunity by Grade Type ($ million)

11. Customer Landscape

11.1 Customer landscape overview

Analysis of price sensitivity, lifecycle, customer purchase basket, adoption rates, and purchase criteria

12. Geographic Landscape

12.1 Geographic segmentation

Chart on Market share by geography 2025-2030 (%)
Data Table on Market share by geography 2025-2030 (%)

12.2 Geographic comparison

Chart on Geographic comparison
Data Table on Geographic comparison

12.3 APAC - Market size and forecast 2025-2030

Chart on APAC - Market size and forecast 2025-2030 ($ million)
Data Table on APAC - Market size and forecast 2025-2030 ($ million)
Chart on APAC - Year-over-year growth 2025-2030 (%)
Data Table on APAC - Year-over-year growth 2025-2030 (%)
Chart on Regional Comparison - APAC
Data Table on Regional Comparison - APAC

12.3.1 China - Market size and forecast 2025-2030

Chart on China - Market size and forecast 2025-2030 ($ million)
Data Table on China - Market size and forecast 2025-2030 ($ million)
Chart on China - Year-over-year growth 2025-2030 (%)
Data Table on China - Year-over-year growth 2025-2030 (%)

12.3.2 Japan - Market size and forecast 2025-2030

Chart on Japan - Market size and forecast 2025-2030 ($ million)
Data Table on Japan - Market size and forecast 2025-2030 ($ million)
Chart on Japan - Year-over-year growth 2025-2030 (%)
Data Table on Japan - Year-over-year growth 2025-2030 (%)

12.3.3 India - Market size and forecast 2025-2030

Chart on India - Market size and forecast 2025-2030 ($ million)
Data Table on India - Market size and forecast 2025-2030 ($ million)
Chart on India - Year-over-year growth 2025-2030 (%)
Data Table on India - Year-over-year growth 2025-2030 (%)

12.3.4 South Korea - Market size and forecast 2025-2030

Chart on South Korea - Market size and forecast 2025-2030 ($ million)
Data Table on South Korea - Market size and forecast 2025-2030 ($ million)
Chart on South Korea - Year-over-year growth 2025-2030 (%)
Data Table on South Korea - Year-over-year growth 2025-2030 (%)

12.3.5 Australia - Market size and forecast 2025-2030

Chart on Australia - Market size and forecast 2025-2030 ($ million)
Data Table on Australia - Market size and forecast 2025-2030 ($ million)
Chart on Australia - Year-over-year growth 2025-2030 (%)
Data Table on Australia - Year-over-year growth 2025-2030 (%)

12.3.6 Indonesia - Market size and forecast 2025-2030

Chart on Indonesia - Market size and forecast 2025-2030 ($ million)
Data Table on Indonesia - Market size and forecast 2025-2030 ($ million)
Chart on Indonesia - Year-over-year growth 2025-2030 (%)
Data Table on Indonesia - Year-over-year growth 2025-2030 (%)

12.4 North America - Market size and forecast 2025-2030

Chart on North America - Market size and forecast 2025-2030 ($ million)
Data Table on North America - Market size and forecast 2025-2030 ($ million)
Chart on North America - Year-over-year growth 2025-2030 (%)
Data Table on North America - Year-over-year growth 2025-2030 (%)
Chart on Regional Comparison - North America
Data Table on Regional Comparison - North America

12.4.1 US - Market size and forecast 2025-2030

Chart on US - Market size and forecast 2025-2030 ($ million)
Data Table on US - Market size and forecast 2025-2030 ($ million)
Chart on US - Year-over-year growth 2025-2030 (%)
Data Table on US - Year-over-year growth 2025-2030 (%)

12.4.2 Canada - Market size and forecast 2025-2030

Chart on Canada - Market size and forecast 2025-2030 ($ million)
Data Table on Canada - Market size and forecast 2025-2030 ($ million)
Chart on Canada - Year-over-year growth 2025-2030 (%)
Data Table on Canada - Year-over-year growth 2025-2030 (%)

12.4.3 Mexico - Market size and forecast 2025-2030

Chart on Mexico - Market size and forecast 2025-2030 ($ million)
Data Table on Mexico - Market size and forecast 2025-2030 ($ million)
Chart on Mexico - Year-over-year growth 2025-2030 (%)
Data Table on Mexico - Year-over-year growth 2025-2030 (%)

12.5 Europe - Market size and forecast 2025-2030

Chart on Europe - Market size and forecast 2025-2030 ($ million)
Data Table on Europe - Market size and forecast 2025-2030 ($ million)
Chart on Europe - Year-over-year growth 2025-2030 (%)
Data Table on Europe - Year-over-year growth 2025-2030 (%)
Chart on Regional Comparison - Europe
Data Table on Regional Comparison - Europe

12.5.1 Germany - Market size and forecast 2025-2030

Chart on Germany - Market size and forecast 2025-2030 ($ million)
Data Table on Germany - Market size and forecast 2025-2030 ($ million)
Chart on Germany - Year-over-year growth 2025-2030 (%)
Data Table on Germany - Year-over-year growth 2025-2030 (%)

12.5.2 UK - Market size and forecast 2025-2030

Chart on UK - Market size and forecast 2025-2030 ($ million)
Data Table on UK - Market size and forecast 2025-2030 ($ million)
Chart on UK - Year-over-year growth 2025-2030 (%)
Data Table on UK - Year-over-year growth 2025-2030 (%)

12.5.3 France - Market size and forecast 2025-2030

Chart on France - Market size and forecast 2025-2030 ($ million)
Data Table on France - Market size and forecast 2025-2030 ($ million)
Chart on France - Year-over-year growth 2025-2030 (%)
Data Table on France - Year-over-year growth 2025-2030 (%)

12.5.4 Italy - Market size and forecast 2025-2030

Chart on Italy - Market size and forecast 2025-2030 ($ million)
Data Table on Italy - Market size and forecast 2025-2030 ($ million)
Chart on Italy - Year-over-year growth 2025-2030 (%)
Data Table on Italy - Year-over-year growth 2025-2030 (%)

12.5.5 Spain - Market size and forecast 2025-2030

Chart on Spain - Market size and forecast 2025-2030 ($ million)
Data Table on Spain - Market size and forecast 2025-2030 ($ million)
Chart on Spain - Year-over-year growth 2025-2030 (%)
Data Table on Spain - Year-over-year growth 2025-2030 (%)

12.5.6 The Netherlands - Market size and forecast 2025-2030

Chart on The Netherlands - Market size and forecast 2025-2030 ($ million)
Data Table on The Netherlands - Market size and forecast 2025-2030 ($ million)
Chart on The Netherlands - Year-over-year growth 2025-2030 (%)
Data Table on The Netherlands - Year-over-year growth 2025-2030 (%)

12.6 South America - Market size and forecast 2025-2030

Chart on South America - Market size and forecast 2025-2030 ($ million)
Data Table on South America - Market size and forecast 2025-2030 ($ million)
Chart on South America - Year-over-year growth 2025-2030 (%)
Data Table on South America - Year-over-year growth 2025-2030 (%)
Chart on Regional Comparison - South America
Data Table on Regional Comparison - South America

12.6.1 Brazil - Market size and forecast 2025-2030

Chart on Brazil - Market size and forecast 2025-2030 ($ million)
Data Table on Brazil - Market size and forecast 2025-2030 ($ million)
Chart on Brazil - Year-over-year growth 2025-2030 (%)
Data Table on Brazil - Year-over-year growth 2025-2030 (%)

12.6.2 Argentina - Market size and forecast 2025-2030

Chart on Argentina - Market size and forecast 2025-2030 ($ million)
Data Table on Argentina - Market size and forecast 2025-2030 ($ million)
Chart on Argentina - Year-over-year growth 2025-2030 (%)
Data Table on Argentina - Year-over-year growth 2025-2030 (%)

12.6.3 Chile - Market size and forecast 2025-2030

Chart on Chile - Market size and forecast 2025-2030 ($ million)
Data Table on Chile - Market size and forecast 2025-2030 ($ million)
Chart on Chile - Year-over-year growth 2025-2030 (%)
Data Table on Chile - Year-over-year growth 2025-2030 (%)

12.7 Middle East and Africa - Market size and forecast 2025-2030

Chart on Middle East and Africa - Market size and forecast 2025-2030 ($ million)
Data Table on Middle East and Africa - Market size and forecast 2025-2030 ($ million)
Chart on Middle East and Africa - Year-over-year growth 2025-2030 (%)
Data Table on Middle East and Africa - Year-over-year growth 2025-2030 (%)
Chart on Regional Comparison - Middle East and Africa
Data Table on Regional Comparison - Middle East and Africa

12.7.1 Saudi Arabia - Market size and forecast 2025-2030

Chart on Saudi Arabia - Market size and forecast 2025-2030 ($ million)
Data Table on Saudi Arabia - Market size and forecast 2025-2030 ($ million)
Chart on Saudi Arabia - Year-over-year growth 2025-2030 (%)
Data Table on Saudi Arabia - Year-over-year growth 2025-2030 (%)

12.7.2 UAE - Market size and forecast 2025-2030

Chart on UAE - Market size and forecast 2025-2030 ($ million)
Data Table on UAE - Market size and forecast 2025-2030 ($ million)
Chart on UAE - Year-over-year growth 2025-2030 (%)
Data Table on UAE - Year-over-year growth 2025-2030 (%)

12.7.3 South Africa - Market size and forecast 2025-2030

Chart on South Africa - Market size and forecast 2025-2030 ($ million)
Data Table on South Africa - Market size and forecast 2025-2030 ($ million)
Chart on South Africa - Year-over-year growth 2025-2030 (%)
Data Table on South Africa - Year-over-year growth 2025-2030 (%)

12.7.4 Israel - Market size and forecast 2025-2030

Chart on Israel - Market size and forecast 2025-2030 ($ million)
Data Table on Israel - Market size and forecast 2025-2030 ($ million)
Chart on Israel - Year-over-year growth 2025-2030 (%)
Data Table on Israel - Year-over-year growth 2025-2030 (%)

12.7.5 Turkey - Market size and forecast 2025-2030

Chart on Turkey - Market size and forecast 2025-2030 ($ million)
Data Table on Turkey - Market size and forecast 2025-2030 ($ million)
Chart on Turkey - Year-over-year growth 2025-2030 (%)
Data Table on Turkey - Year-over-year growth 2025-2030 (%)

12.8 Market opportunity by geography

Market opportunity by geography ($ million)
Data Tables on Market opportunity by geography ($ million)

13. Drivers, Challenges, and Opportunity

13.1 Market drivers

Expansion of organized cash management infrastructure
Growing circulation of coins across transportation and public service ecosystems
Technological advancement in coin authentication and sorting systems

13.2 Market challenges

Declining cash transaction volumes in digital payment environments
High capital expenditure requirements for equipment acquisition
Maintenance complexity and service network limitations

13.3 Impact of drivers and challenges

Impact of drivers and challenges in 2025 and 2030

13.4 Market opportunities

Shift toward self-service coin deposit and exchange ecosystems
Increasing customization on coin sorter for industry specific applications
Expansion of compact and space efficient equipment deployment

14. Competitive Landscape

14.1 Overview

14.2

Overview on criticality of inputs and factors of differentiation

14.3 Landscape disruption

Overview on factors of disruption

14.4 Industry risks

Impact of key risks on business

15. Competitive Analysis

15.1 Companies profiled

Companies covered

15.2 Company ranking index

15.3 Market positioning of companies

Matrix on companies position and classification

15.4 AccuBANKER

AccuBANKER - Overview
AccuBANKER - Product / Service
AccuBANKER - Key offerings
SWOT

15.5 BellCon ApS

BellCon ApS - Overview
BellCon ApS - Product / Service
BellCon ApS - Key offerings
SWOT

15.6 Billcon Corp.

Billcon Corp. - Overview
Billcon Corp. - Product / Service
Billcon Corp. - Key offerings
SWOT

15.7 Cassida Corp.

Cassida Corp. - Overview
Cassida Corp. - Product / Service
Cassida Corp. - Key offerings
SWOT

15.8 Crane Payment Innovations Inc.

Crane Payment Innovations Inc. - Overview
Crane Payment Innovations Inc. - Product / Service
Crane Payment Innovations Inc. - Key offerings
SWOT

15.9 CTcoin AS

CTcoin AS - Overview
CTcoin AS - Product / Service
CTcoin AS - Key offerings
SWOT

15.10 GRGBanking

GRGBanking - Overview
GRGBanking - Product / Service
GRGBanking - Key offerings
SWOT

15.11 Guangdong Baijia Baiter Co. Ltd.

Guangdong Baijia Baiter Co. Ltd. - Overview
Guangdong Baijia Baiter Co. Ltd. - Product / Service
Guangdong Baijia Baiter Co. Ltd. - Key offerings
SWOT

15.12 HESS Cash Systems GmbH

HESS Cash Systems GmbH - Overview
HESS Cash Systems GmbH - Product / Service
HESS Cash Systems GmbH - Key offerings
SWOT

15.13 Laurel Bank Machines Co. Ltd.

Laurel Bank Machines Co. Ltd. - Overview
Laurel Bank Machines Co. Ltd. - Product / Service
Laurel Bank Machines Co. Ltd. - Key offerings
SWOT

15.14 Safescan BV

Safescan BV - Overview
Safescan BV - Product / Service
Safescan BV - Key offerings
SWOT

15.15 Semacon Business Machines Inc.

Semacon Business Machines Inc. - Overview
Semacon Business Machines Inc. - Product / Service
Semacon Business Machines Inc. - Key offerings
SWOT

15.16 SOUTH Automation Int. GmbH

SOUTH Automation Int. GmbH - Overview
SOUTH Automation Int. GmbH - Product / Service
SOUTH Automation Int. GmbH - Key offerings
SWOT

15.17 Suzhou Ribao Technology Co. Ltd.

Suzhou Ribao Technology Co. Ltd. - Overview
Suzhou Ribao Technology Co. Ltd. - Product / Service
Suzhou Ribao Technology Co. Ltd. - Key offerings
SWOT

15.18 SUZOHAPP

SUZOHAPP - Overview
SUZOHAPP - Product / Service
SUZOHAPP - Key offerings
SWOT

16. Appendix

16.1 Scope of the report

Market definition
Objectives
Notes and caveats

16.2 Inclusions and exclusions checklist

Inclusions checklist
Exclusions checklist

16.3 Currency conversion rates for US$

16.4 Research methodology

16.5 Data procurement

Information sources

16.6 Data validation

16.7 Validation techniques employed for market sizing

16.8 Data synthesis

16.9 360 degree market analysis

16.10 List of abbreviations

Research Methodology

Technavio presents a detailed picture of the market by way of study, synthesis, and summation of data from multiple sources. The analysts have presented the various facets of the market with a particular focus on identifying the key industry influencers. The data thus presented is comprehensive, reliable, and the result of extensive research, both primary and secondary.

INFORMATION SOURCES

Primary sources

  • Manufacturers and suppliers
  • Channel partners
  • Industry experts
  • Strategic decision makers

Secondary sources

  • Industry journals and periodicals
  • Government data
  • Financial reports of key industry players
  • Historical data
  • Press releases

DATA ANALYSIS

Data Synthesis

  • Collation of data
  • Estimation of key figures
  • Analysis of derived insights

Data Validation

  • Triangulation with data models
  • Reference against proprietary databases
  • Corroboration with industry experts

REPORT WRITING

Qualitative

  • Market drivers
  • Market challenges
  • Market trends
  • Five forces analysis

Quantitative

  • Market size and forecast
  • Market segmentation
  • Geographical insights
  • Competitive landscape

Interested in this report?

Get your sample now to see our research methodology and insights!

Download Now

Frequently Asked Questions

Coin Sorter market growth will increase by USD 1537.6 million during 2026-2030.

The Coin Sorter market is expected to grow at a CAGR of 7.2% during 2026-2030.

Coin Sorter market is segmented by Type (Small size coin sorter, Medium size coin sorter, Large size coin sorter) End-user (Financial institutions and banks, Retail stores and supermarkets, Casinos and gaming, Vending and transportation operators) Grade type (Bank grade, Business grade)

AccuBANKER, BellCon ApS, Billcon Corp., Cassida Corp., Crane Payment Innovations Inc., CTcoin AS, GRGBanking, Guangdong Baijia Baiter Co. Ltd., HESS Cash Systems GmbH, KLOPP Coin Inc., Laurel Bank Machines Co. Ltd., Safescan BV, Semacon Business Machines Inc., SOUTH Automation Int. GmbH, Suzhou Ribao Technology Co. Ltd., SUZOHAPP are a few of the key vendors in the Coin Sorter market.

APAC will register the highest growth rate of 40.7% among the other regions. Therefore, the Coin Sorter market in APAC is expected to garner significant business opportunities for the vendors during the forecast period.

China, Japan, India, South Korea, Australia, Indonesia, US, Canada, Mexico, Germany, UK, France, Italy, Spain, The Netherlands, Brazil, Argentina, Chile, Saudi Arabia, UAE, South Africa, Israel, Turkey

  • Expansion of organized cash management infrastructure is the driving factor this market.

The Coin Sorter market vendors should focus on grabbing business opportunities from the Type segment as it accounted for the largest market share in the base year.
RIA - Research AI Assistant
Ask RIA
