Commercial Cooking Equipment Market Analysis, Size, and Forecast 2026-2030: APAC (China, Japan, and India), North America (US, Canada, and Mexico), Europe (Germany, UK, and France), South America (Brazil, Argentina, and Chile), Middle East and Africa (Saudi Arabia, UAE, and South Africa), and Rest of World (ROW)

Commercial Cooking Equipment Market Analysis, Size, and Forecast 2026-2030:
APAC (China, Japan, and India), North America (US, Canada, and Mexico), Europe (Germany, UK, and France), South America (Brazil, Argentina, and Chile), Middle East and Africa (Saudi Arabia, UAE, and South Africa), and Rest of World (ROW)

Published: Oct 2026 302 Pages SKU: IRTNTR44189

Market Overview at a Glance

$5.14 B
Market Opportunity
6.3%
CAGR 2025 - 2030
38.7%
APAC Growth
$6.64 B
Quick-service restaurants segment 2024

Commercial Cooking Equipment Market Size 2026-2030

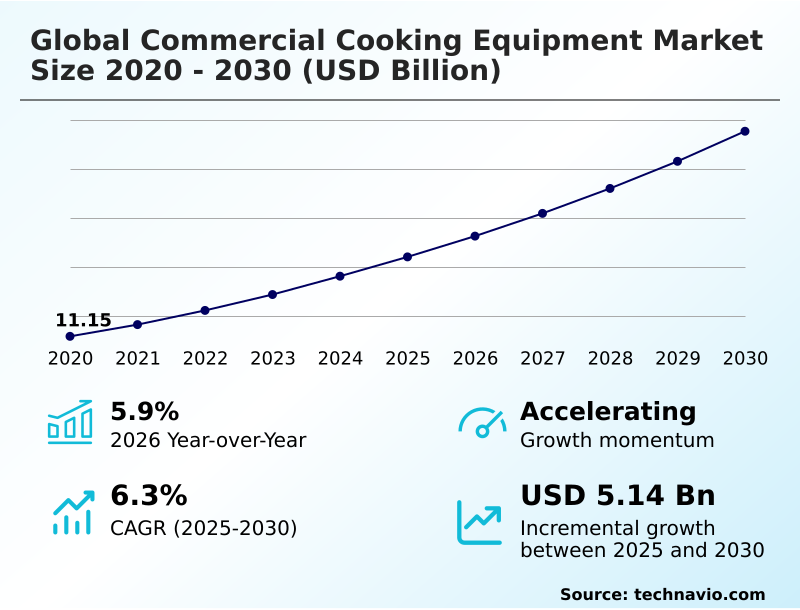
The commercial cooking equipment market size is valued to increase by USD 5.14 billion, at a CAGR of 6.3% from 2025 to 2030. Increasing number of food service establishments will drive the commercial cooking equipment market.

Major Market Trends & Insights

  • APAC dominated the market and accounted for a 38.7% growth during the forecast period.
  • By End-user - Quick-service restaurants segment was valued at USD 6.64 billion in 2024
  • By Product - Cookers segment accounted for the largest market revenue share in 2024

Market Size & Forecast

  • Market Opportunities: USD 8.39 billion
  • Market Future Opportunities: USD 5.14 billion
  • CAGR from 2025 to 2030 : 6.3%

Market Summary

  • The Commercial Cooking Equipment Market demonstrates robust momentum driven by an intensified focus on operational efficiency and rapid culinary output. Facility operators continuously upgrade heating systems to maintain high utilization rates in fast-paced dining environments. By implementing advanced steam convection ovens, organizations optimize their supply chain consistency, ensuring standardized ingredient processing across multi-site locations.
  • This technological modernization yields a 20% improvement in batch processing speed compared to conventional thermal appliances. The increasing number of food service establishments acts as a primary driver, compelling operators to invest heavily in reliable infrastructure that handles surging customer volumes.
  • Conversely, escalating raw material costs present a significant challenge, directly compressing manufacturing margins and forcing procurement teams to seek alternative metallurgical supplies. Adapting to these financial pressures necessitates continuous design optimization, allowing resilient operators to safeguard profitability while maintaining rigorous performance standards.

What will be the Size of the Commercial Cooking Equipment Market during the forecast period?
Get Key Insights on Market Forecast (PDF) Get Free Sample

How is the Commercial Cooking Equipment Market Segmented?

The commercial cooking equipment industry research report provides comprehensive data (region-wise segment analysis), with forecasts and estimates in "USD million" for the period 2026-2030, as well as historical data from 2020-2024 for the following segments.

  • End-user
    • Quick-service restaurants
    • Full-service restaurants
    • Catering
  • Product
    • Cookers
    • Ranges
    • Fryers
    • Ovens
    • Others
  • Technology
    • Gas
    • Electric
    • Induction
  • Geography
    • APAC
      • China
      • Japan
      • India
      • South Korea
      • Australia
      • Indonesia
    • North America
      • US
      • Canada
      • Mexico
    • Europe
      • Germany
      • UK
      • France
      • Italy
      • Spain
      • The Netherlands
    • South America
      • Brazil
      • Argentina
      • Chile
    • Middle East and Africa
      • Saudi Arabia
      • UAE
      • South Africa
      • Israel
      • Turkey

By End-user Insights

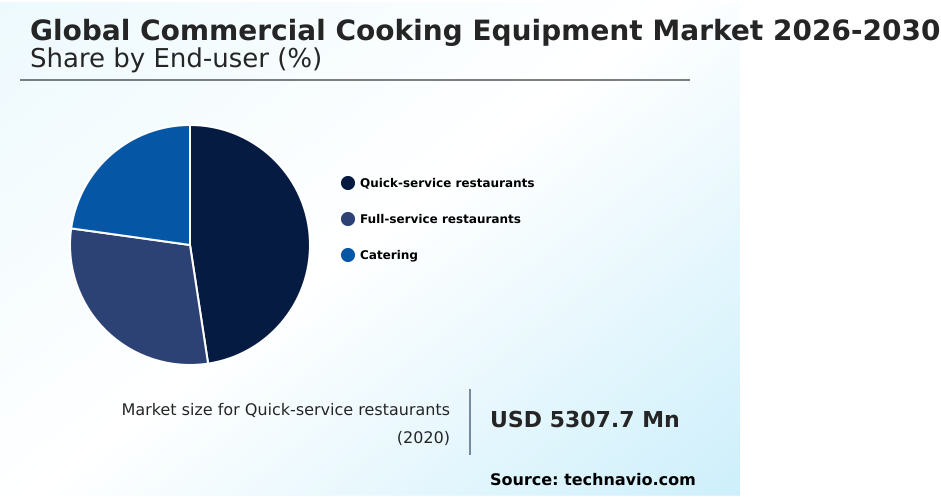
The quick-service restaurants segment is estimated to witness significant growth during the forecast period.

Quick-service restaurants demand robust operational frameworks, driving rapid adoption of high-performance Commercial Cooking Equipment. Facility managers prioritize workflow velocity, integrating an infrared broiler element alongside an open pot fryer design to maximize throughput during peak hours.

By embedding solid state microwave heating within smart energy management frameworks, fast-food operators achieve a 15% reduction in cycle times compared to legacy systems.

This continuous equipment evolution directly supports rapid menu turnover, ensuring precise temperature holding accuracy for diverse items. Upgrading to a commercial griddle surface enhances heat recovery, allowing a seamless conveyor belt cooking speed that matches high consumer volume.

Additionally, strict adherence to a cross contamination prevention mechanism ensures consistent safety compliance across centralized food processing hubs without slowing production.
Get Free Sample

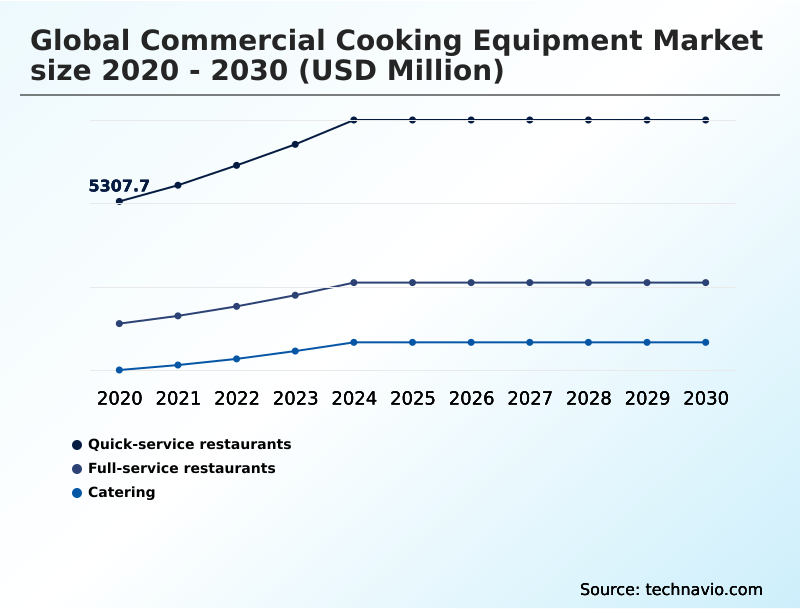
The Quick-service restaurants segment was valued at USD 6.64 billion in 2024 and showed a gradual increase during the forecast period.
Get Free Sample

Regional Analysis

APAC is estimated to contribute 38.7% to the growth of the global market during the forecast period.Technavio’s analysts have elaborately explained the regional trends and drivers that shape the market during the forecast period.
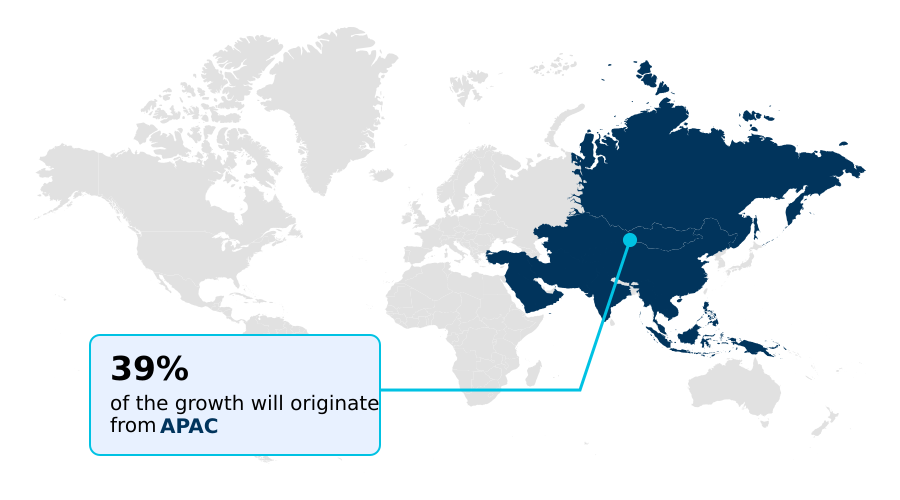
See How Commercial Cooking Equipment Market Demand is Rising in APAC Get Free Sample

Geographic variations in the Commercial Cooking Equipment landscape reveal distinct technological adoption strategies. Operators in North America achieve a 22% higher regional penetration in fire suppression system integration compared to APAC, driven by stricter food safety compliance standards.

European facilities prioritize sustainable output, deploying a thermaline induction cooking plate alongside variable fan speed convection systems to lower energy costs by 18%.

Conversely, rapidly expanding Asian urban hubs focus on spatial efficiency, heavily investing in a modular kitchen cooking station constructed with heavy duty stainless steel construction. This configuration maximizes throughput in confined layouts.

Meanwhile, integrating remote diagnostic capability via a touchscreen interface control enables Western facilities to streamline multi stage cooking phase operations.

By utilizing customizable menu programming, regional managers successfully reduce kitchen downtime by 15%, ensuring consistent culinary precision across decentralized operational networks.

Market Dynamics

Our researchers analyzed the data with 2025 as the base year, along with the key drivers, trends, and challenges. A holistic analysis of drivers will help companies refine their marketing strategies to gain a competitive advantage.

  • Implementing advanced culinary infrastructure directly enhances operational scalability within high-traffic hospitality environments. Forward-thinking facility managers consistently integrate smart connected commercial kitchen appliances to streamline complex food preparation sequences across decentralized supply chains. Utilizing automated temperature controlled frying systems ensures precise culinary execution, actively reducing edible oil degradation and minimizing ingredient waste by nearly 20% compared to traditional manual frying configurations.
  • This distinct performance advantage empowers procurement planners to optimize bulk ingredient purchasing while strictly adhering to standardized hygiene protocols. To further accelerate service delivery, institutional catering directors rely on energy efficient rapid cook ovens that drastically decrease thermal processing cycles.
  • Balancing this rapid output requires robust foundational hardware; hence, operators deploy heavy duty modular induction ranges to guarantee stable, continuous heat generation during peak operational windows. A critical component of maximizing this hardware lifecycle involves integrating IoT enabled preventative maintenance systems which preemptively identify component degradation, thereby avoiding catastrophic equipment failure.
  • Consequently, organizations utilizing remote telemetry achieve a 15% improvement in overarching asset uptime, allowing continuous, unhindered production. This strategic technological deployment fundamentally shifts operational planning from reactive crisis management to proactive efficiency scaling, fundamentally supporting long-term profitability and sustained capacity expansion in the Commercial Cooking Equipment sector.
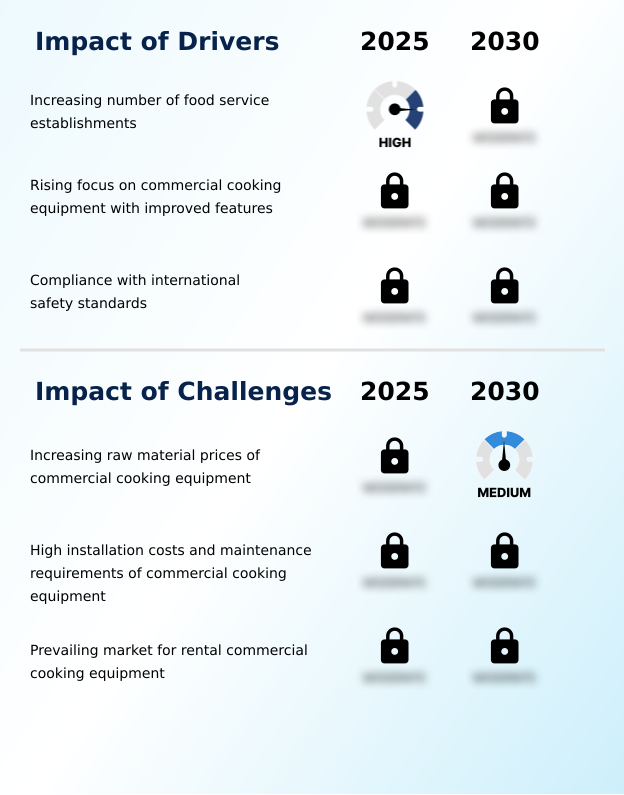
What are the key market drivers leading to the rise in the adoption of Commercial Cooking Equipment Industry?

  • The increasing number of food service establishments serves as a principal driver accelerating industry expansion and infrastructural demand.

  • Escalating demand for accelerated meal delivery directly propels rigorous hardware modernization within Commercial Cooking Equipment. Organizations integrating digital workflow integration achieve a 25% improvement in processing efficiency over conventional preparation methods.
  • The transition toward a sustainable foodservice operation drives operators to deploy an intelligent oil filtration system alongside high capacity pressure frying, cutting edible resource waste by 18%.
  • Implementing compact ventless oven technology combined with a rapid cook impingement mechanism enables high-speed thermal processing in constrained urban footprints. Utilizing a commercial induction cooktop and automated stir frying robotics radically diminishes dependency on manual labor, ensuring unparalleled consistency.
  • Through an ergonomic appliance configuration and IoT enabled appliance monitoring, facility directors actively preempt component failure, slashing maintenance latency by 20% and guaranteeing uninterrupted operational continuity during peak hours.

What are the market trends shaping the Commercial Cooking Equipment Industry?

  • An increasing focus on improving new technologies is emerging as a significant trend. This shift enables enhanced operational efficiency and precision across modern professional workflows.

  • Technological innovation significantly accelerates capacity scaling across the Commercial Cooking Equipment sector. Facility managers actively integrate smart kitchen connectivity to supervise high volume food preparation, yielding a 30% reduction in unplanned equipment downtime compared to analog monitoring.
  • By deploying an advanced steam convection apparatus equipped with automated temperature regulation, culinary directors establish a precise thermostatic control environment that guarantees consistent product output. This shift toward digital precision is essential for cloud kitchen optimization, where rapid turnaround dictates profitability.
  • Furthermore, the widespread adoption of energy efficient induction heating components directly drives a 22% energy consumption reduction across large-scale catering operations. Operators leverage space saving modular design concepts alongside a programmable cooking cycle to enhance multi-station workflow fluidity. Consequently, modern culinary facilities dramatically lower operational overhead while simultaneously increasing overarching service velocity and strict adherence to food safety protocols.

What challenges does the Commercial Cooking Equipment Industry face during its growth?

  • Escalating raw material prices present a substantial challenge that directly constrains manufacturing margins and overall industry expansion.

  • Escalating component complexity and stringent infrastructural prerequisites present substantial operational limitations across the Commercial Cooking Equipment ecosystem. Facility managers face acute integration hurdles when embedding an automated moisture control sensor into a self cleaning combi oven, often increasing initial installation latency by 15% compared to legacy setups.
  • Maximizing electromagnetic coil heat transfer requires substantial electrical grid upgrades, straining capital budgets for independent operators. Similarly, optimizing ventilation hood exhaust efficiency to accommodate a high efficiency gas burner demands extensive retrofitting, which frequently delays facility launch timelines. Furthermore, incorporating sophisticated blast chilling integration and high speed baking technology necessitates rigorous personnel retraining to prevent costly mishandling.
  • While deploying a water recycling dishwasher alongside heat recovery ventilation drastically improves ecological compliance, the absence of a standardized predictive maintenance diagnostic protocol often inflates long-term servicing expenditures by 20%.

Exclusive Technavio Analysis on Customer Landscape

The commercial cooking equipment market forecasting report includes the adoption lifecycle of the market, covering from the innovator’s stage to the laggard’s stage. It focuses on adoption rates in different regions based on penetration. Furthermore, the commercial cooking equipment market report also includes key purchase criteria and drivers of price sensitivity to help companies evaluate and develop their market growth analysis strategies.
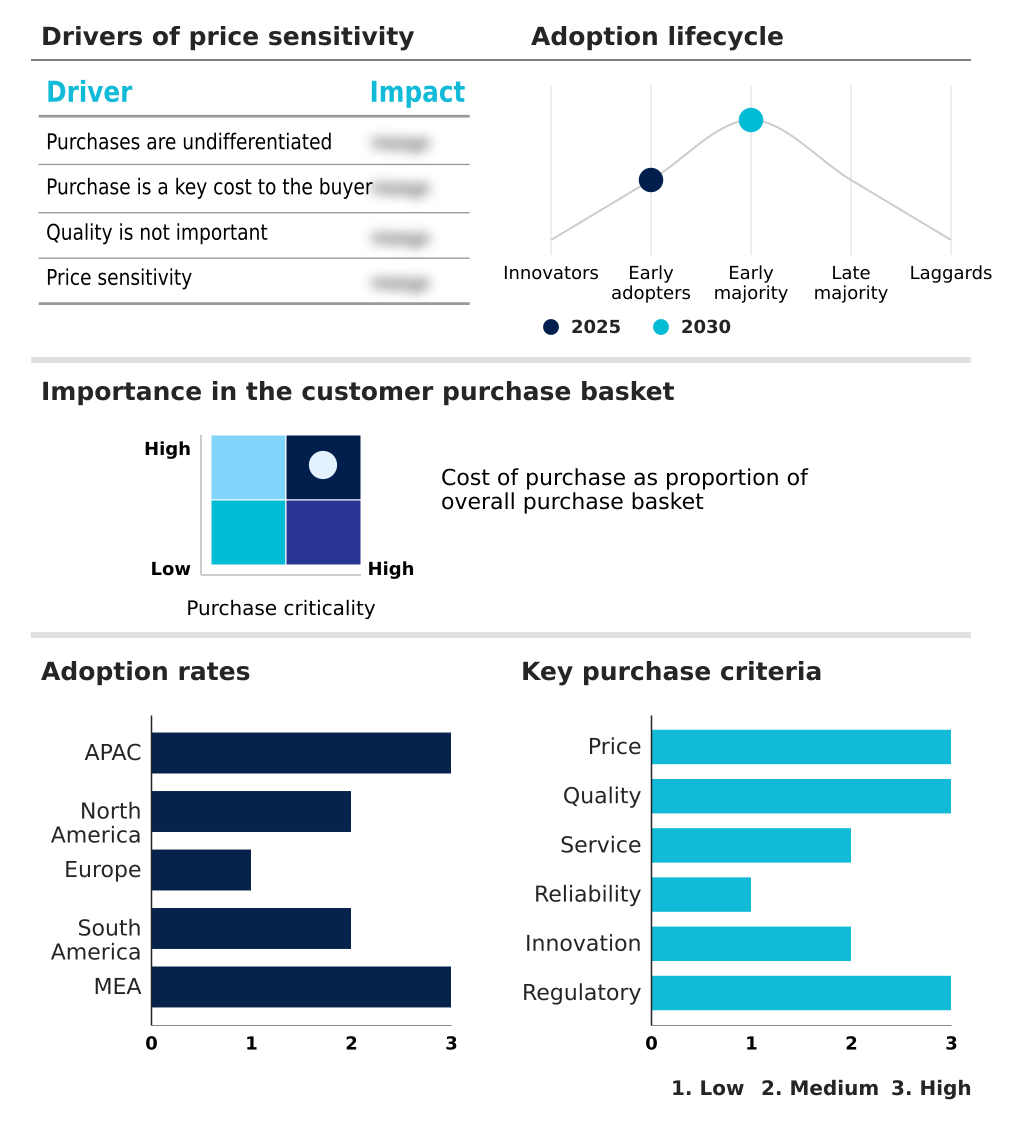
Customer Landscape of Commercial Cooking Equipment Industry

Competitive Landscape

Companies are implementing various strategies, such as strategic alliances, commercial cooking equipment market forecast, partnerships, mergers and acquisitions, geographical expansion, and product/service launches, to enhance their presence in the industry.

Ali Group Srl - Manufacturers deliver advanced thermal processing solutions and automated frying systems tailored for high-volume hospitality operations, ensuring superior temperature control and rigorous food safety compliance.

The industry research and growth report includes detailed analyses of the competitive landscape of the market and information about key companies, including:

  • Ali Group Srl
  • Alto Shaam Inc.
  • Bakers Pride Oven Co
  • Blue Seal Ltd.
  • Duke Manufacturing
  • Electrolux Professional AB
  • Falcon Foodservice Equipment
  • Frymaster LLC
  • FUJIMAK Corp.
  • Garland group
  • Hobart Corp.
  • ITW Food Equipment Group
  • Moretti Forni Spa
  • Ovention Inc.
  • Star Manufacturing International
  • The Middleby Corp.
  • The Vollrath Co. LLC
  • TurboChef Technologies Inc.
  • WELBILT Inc.
  • XLT Inc.

Qualitative and quantitative analysis of companies has been conducted to help clients understand the wider business environment as well as the strengths and weaknesses of key industry players. Data is qualitatively analyzed to categorize companies as pure play, category-focused, industry-focused, and diversified; it is quantitatively analyzed to categorize companies as dominant, leading, strong, tentative, and weak.

Recent Development and News in Commercial cooking equipment market

  • In the Industrial Machinery and Supplies and Components industry, the widespread integration of predictive maintenance diagnostics has reduced unplanned equipment downtime by 20%, directly increasing demand for IoT-enabled appliance monitoring in Commercial Cooking Equipment.
  • Stringent global energy directives mandating a 15% reduction in industrial facility power consumption have accelerated the shift toward solid-state microwave heating components, propelling the adoption of energy-efficient induction heating within the Commercial Cooking Equipment sector.
  • Heavy-duty stainless steel construction standards implemented within high-volume food preparation machinery have improved material longevity by 25%, establishing new durability benchmarks that drive replacement cycles in the Commercial Cooking Equipment market.
  • The rapid deployment of smart kitchen connectivity modules across global manufacturing hubs has improved heat recovery ventilation efficiency by 18%, significantly lowering operational carbon footprints and influencing purchasing decisions for Commercial Cooking Equipment.

Dive into Technavio’s robust research methodology, blending expert interviews, extensive data synthesis, and validated models for unparalleled Commercial Cooking Equipment Market insights. See full methodology.

Market Scope
Page number 302
Base year 2025
Historic period 2020-2024
Forecast period 2026-2030
Growth momentum & CAGR Accelerate at a CAGR of 6.3%
Market growth 2026-2030 USD 5140.7 million
Market structure Fragmented
YoY growth 2025-2026(%) 5.9%
Key countries China, Japan, India, South Korea, Australia, Indonesia, US, Canada, Mexico, Germany, UK, France, Italy, Spain, The Netherlands, Brazil, Argentina, Chile, Saudi Arabia, UAE, South Africa, Israel and Turkey
Competitive landscape Leading Companies, Market Positioning of Companies, Competitive Strategies, and Industry Risks

Request Free Sample

Research Analyst Overview

  • Navigating the complex architecture of modern professional kitchens requires robust infrastructure and continuous technological refinement in Commercial Cooking Equipment. Facility directors are rapidly transitioning toward highly automated ecosystems to mitigate labor dependencies and streamline compliance frameworks.
  • Integrating an intelligent oil filtration system alongside advanced steam convection units proactively targets strict environmental mandates, allowing corporate budgeting departments to achieve a 25% reduction in recurring consumable expenditures compared to legacy models. Implementing a programmable cooking cycle ensures rigorous adherence to standardized nutritional profiles across multi-site catering networks.
  • Furthermore, the deployment of compact ventless oven technology enables spatial optimization in restrictive urban real estate without compromising extraction safety. Incorporating an automated moisture control sensor directly into a self cleaning combi oven radically diminishes manual intervention requirements. Leveraging a predictive maintenance diagnostic protocol ensures that component degradation is preemptively addressed before critical system failure occurs.
  • Ultimately, these targeted infrastructural upgrades empower operational leaders to maintain peak throughput, ensuring continuous culinary precision and robust asset reliability across demanding commercial foodservice networks.

What are the Key Data Covered in this Commercial Cooking Equipment Market Research and Growth Report?

  • What is the expected growth of the Commercial Cooking Equipment Market between 2026 and 2030?

    • USD 5.14 billion, at a CAGR of 6.3%

  • What segmentation does the market report cover?

    • The report is segmented by End-user (Quick-service restaurants, Full-service restaurants, and Catering), Product (Cookers, Ranges, Fryers, Ovens, and Others), Technology (Gas, Electric, and Induction) and Geography (APAC, North America, Europe, South America, Middle East and Africa)

  • Which regions are analyzed in the report?

    • APAC, North America, Europe, South America and Middle East and Africa

  • What are the key growth drivers and market challenges?

    • Increasing number of food service establishments, Increasing raw material prices of commercial cooking equipment

  • Who are the major players in the Commercial Cooking Equipment Market?

    • Ali Group Srl, Alto Shaam Inc., Bakers Pride Oven Co, Blue Seal Ltd., Duke Manufacturing, Electrolux Professional AB, Falcon Foodservice Equipment, Frymaster LLC, FUJIMAK Corp., Garland group, Hobart Corp., ITW Food Equipment Group, Moretti Forni Spa, Ovention Inc., Star Manufacturing International, The Middleby Corp., The Vollrath Co. LLC, TurboChef Technologies Inc., WELBILT Inc. and XLT Inc.

Market Research Insights

  • The Commercial Cooking Equipment sector exhibits continuous technological refinement tailored for high volume food preparation and sustainable foodservice operation. Upgrading to cloud kitchen optimization platforms yields a 25% improvement in order fulfillment speed compared to legacy manual processes. Furthermore, deploying advanced energy consumption reduction protocols across digital workflow integration systems successfully decreases utility overheads by 18%.
  • Integrating a precise thermostatic control mechanism into active cooking lines directly enhances output consistency, preventing costly food waste. These strategic enhancements ensure rigorous adherence to food safety compliance standards while driving long-term profitability. Consequently, facility managers consistently prioritize intelligent infrastructure to maximize daily operational capacity and long-term asset reliability.

We can help! Our analysts can customize this commercial cooking equipment market research report to meet your requirements.

Get in touch

1. Executive Summary

1.1 Market overview

Executive Summary - Chart on Market Overview
Executive Summary - Data Table on Market Overview
Executive Summary - Chart on Global Market Characteristics
Executive Summary - Chart on Market by Geography
Executive Summary - Chart on Market Segmentation by End-user
Executive Summary - Chart on Market Segmentation by Product
Executive Summary - Chart on Market Segmentation by Technology
Executive Summary - Chart on Incremental Growth
Executive Summary - Data Table on Incremental Growth
Executive Summary - Chart on Company Market Positioning

2. Technavio Analysis

2.1 Analysis of price sensitivity, lifecycle, customer purchase basket, adoption rates, and purchase criteria

2.2 Criticality of inputs and Factors of differentiation

Chart on Overview on criticality of inputs and factors of differentiation

2.3 Factors of disruption

Chart on Overview on factors of disruption

2.4 Impact of drivers and challenges

Chart on Impact of drivers and challenges in 2025 and 2030

3. Market Landscape

3.1 Market ecosystem

Chart on Parent Market
Data Table on - Parent Market

3.2 Market characteristics

Chart on Market characteristics analysis

3.3 Value chain analysis

Chart on Value chain analysis

4. Market Sizing

4.1 Market definition

Data Table on Offerings of companies included in the market definition

4.2 Market segment analysis

Market segments

4.3 Market size 2025

4.4 Market outlook: Forecast for 2025-2030

Chart on Global - Market size and forecast 2025-2030 ($ million)
Data Table on Global - Market size and forecast 2025-2030 ($ million)
Chart on Global Market: Year-over-year growth 2025-2030 (%)
Data Table on Global Market: Year-over-year growth 2025-2030 (%)

5. Historic Market Size

5.1 Global Commercial Cooking Equipment Market 2020 - 2024

Historic Market Size - Data Table on Global Commercial Cooking Equipment Market 2020 - 2024 ($ million)

5.2 End-user segment analysis 2020 - 2024

Historic Market Size - End-user Segment 2020 - 2024 ($ million)

5.3 Product segment analysis 2020 - 2024

Historic Market Size - Product Segment 2020 - 2024 ($ million)

5.4 Technology segment analysis 2020 - 2024

Historic Market Size - Technology Segment 2020 - 2024 ($ million)

5.5 Geography segment analysis 2020 - 2024

Historic Market Size - Geography Segment 2020 - 2024 ($ million)

5.6 Country segment analysis 2020 - 2024

Historic Market Size - Country Segment 2020 - 2024 ($ million)

6. Qualitative Analysis

6.1 Impact of AI on Global Commercial Cooking Equipment Market

6.2 Impact of Geopolitical Conflicts on Global Commercial Cooking Equipment Market

7. Five Forces Analysis

7.1 Five forces summary

Five forces analysis - Comparison between 2025 and 2030

7.2 Bargaining power of buyers

Bargaining power of buyers - Impact of key factors 2025 and 2030

7.3 Bargaining power of suppliers

Bargaining power of suppliers - Impact of key factors in 2025 and 2030

7.4 Threat of new entrants

Threat of new entrants - Impact of key factors in 2025 and 2030

7.5 Threat of substitutes

Threat of substitutes - Impact of key factors in 2025 and 2030

7.6 Threat of rivalry

Threat of rivalry - Impact of key factors in 2025 and 2030

7.7 Market condition

Chart on Market condition - Five forces 2025 and 2030

8. Market Segmentation by End-user

8.1 Market segments

Chart on End-user - Market share 2025-2030 (%)
Data Table on End-user - Market share 2025-2030 (%)

8.2 Comparison by End-user

Chart on Comparison by End-user
Data Table on Comparison by End-user

8.3 Quick-service restaurants - Market size and forecast 2025-2030

Chart on Quick-service restaurants - Market size and forecast 2025-2030 ($ million)
Data Table on Quick-service restaurants - Market size and forecast 2025-2030 ($ million)
Chart on Quick-service restaurants - Year-over-year growth 2025-2030 (%)
Data Table on Quick-service restaurants - Year-over-year growth 2025-2030 (%)

8.4 Full-service restaurants - Market size and forecast 2025-2030

Chart on Full-service restaurants - Market size and forecast 2025-2030 ($ million)
Data Table on Full-service restaurants - Market size and forecast 2025-2030 ($ million)
Chart on Full-service restaurants - Year-over-year growth 2025-2030 (%)
Data Table on Full-service restaurants - Year-over-year growth 2025-2030 (%)

8.5 Catering - Market size and forecast 2025-2030

Chart on Catering - Market size and forecast 2025-2030 ($ million)
Data Table on Catering - Market size and forecast 2025-2030 ($ million)
Chart on Catering - Year-over-year growth 2025-2030 (%)
Data Table on Catering - Year-over-year growth 2025-2030 (%)

8.6 Market opportunity by End-user

Market opportunity by End-user ($ million)
Data Table on Market opportunity by End-user ($ million)

9. Market Segmentation by Product

9.1 Market segments

Chart on Product - Market share 2025-2030 (%)
Data Table on Product - Market share 2025-2030 (%)

9.2 Comparison by Product

Chart on Comparison by Product
Data Table on Comparison by Product

9.3 Cookers - Market size and forecast 2025-2030

Chart on Cookers - Market size and forecast 2025-2030 ($ million)
Data Table on Cookers - Market size and forecast 2025-2030 ($ million)
Chart on Cookers - Year-over-year growth 2025-2030 (%)
Data Table on Cookers - Year-over-year growth 2025-2030 (%)

9.4 Ranges - Market size and forecast 2025-2030

Chart on Ranges - Market size and forecast 2025-2030 ($ million)
Data Table on Ranges - Market size and forecast 2025-2030 ($ million)
Chart on Ranges - Year-over-year growth 2025-2030 (%)
Data Table on Ranges - Year-over-year growth 2025-2030 (%)

9.5 Fryers - Market size and forecast 2025-2030

Chart on Fryers - Market size and forecast 2025-2030 ($ million)
Data Table on Fryers - Market size and forecast 2025-2030 ($ million)
Chart on Fryers - Year-over-year growth 2025-2030 (%)
Data Table on Fryers - Year-over-year growth 2025-2030 (%)

9.6 Ovens - Market size and forecast 2025-2030

Chart on Ovens - Market size and forecast 2025-2030 ($ million)
Data Table on Ovens - Market size and forecast 2025-2030 ($ million)
Chart on Ovens - Year-over-year growth 2025-2030 (%)
Data Table on Ovens - Year-over-year growth 2025-2030 (%)

9.7 Others - Market size and forecast 2025-2030

Chart on Others - Market size and forecast 2025-2030 ($ million)
Data Table on Others - Market size and forecast 2025-2030 ($ million)
Chart on Others - Year-over-year growth 2025-2030 (%)
Data Table on Others - Year-over-year growth 2025-2030 (%)

9.8 Market opportunity by Product

Market opportunity by Product ($ million)
Data Table on Market opportunity by Product ($ million)

10. Market Segmentation by Technology

10.1 Market segments

Chart on Technology - Market share 2025-2030 (%)
Data Table on Technology - Market share 2025-2030 (%)

10.2 Comparison by Technology

Chart on Comparison by Technology
Data Table on Comparison by Technology

10.3 Gas - Market size and forecast 2025-2030

Chart on Gas - Market size and forecast 2025-2030 ($ million)
Data Table on Gas - Market size and forecast 2025-2030 ($ million)
Chart on Gas - Year-over-year growth 2025-2030 (%)
Data Table on Gas - Year-over-year growth 2025-2030 (%)

10.4 Electric - Market size and forecast 2025-2030

Chart on Electric - Market size and forecast 2025-2030 ($ million)
Data Table on Electric - Market size and forecast 2025-2030 ($ million)
Chart on Electric - Year-over-year growth 2025-2030 (%)
Data Table on Electric - Year-over-year growth 2025-2030 (%)

10.5 Induction - Market size and forecast 2025-2030

Chart on Induction - Market size and forecast 2025-2030 ($ million)
Data Table on Induction - Market size and forecast 2025-2030 ($ million)
Chart on Induction - Year-over-year growth 2025-2030 (%)
Data Table on Induction - Year-over-year growth 2025-2030 (%)

10.6 Market opportunity by Technology

Market opportunity by Technology ($ million)
Data Table on Market opportunity by Technology ($ million)

11. Customer Landscape

11.1 Customer landscape overview

Analysis of price sensitivity, lifecycle, customer purchase basket, adoption rates, and purchase criteria

12. Geographic Landscape

12.1 Geographic segmentation

Chart on Market share by geography 2025-2030 (%)
Data Table on Market share by geography 2025-2030 (%)

12.2 Geographic comparison

Chart on Geographic comparison
Data Table on Geographic comparison

12.3 APAC - Market size and forecast 2025-2030

Chart on APAC - Market size and forecast 2025-2030 ($ million)
Data Table on APAC - Market size and forecast 2025-2030 ($ million)
Chart on APAC - Year-over-year growth 2025-2030 (%)
Data Table on APAC - Year-over-year growth 2025-2030 (%)
Chart on Regional Comparison - APAC
Data Table on Regional Comparison - APAC

12.3.1 China - Market size and forecast 2025-2030

Chart on China - Market size and forecast 2025-2030 ($ million)
Data Table on China - Market size and forecast 2025-2030 ($ million)
Chart on China - Year-over-year growth 2025-2030 (%)
Data Table on China - Year-over-year growth 2025-2030 (%)

12.3.2 Japan - Market size and forecast 2025-2030

Chart on Japan - Market size and forecast 2025-2030 ($ million)
Data Table on Japan - Market size and forecast 2025-2030 ($ million)
Chart on Japan - Year-over-year growth 2025-2030 (%)
Data Table on Japan - Year-over-year growth 2025-2030 (%)

12.3.3 India - Market size and forecast 2025-2030

Chart on India - Market size and forecast 2025-2030 ($ million)
Data Table on India - Market size and forecast 2025-2030 ($ million)
Chart on India - Year-over-year growth 2025-2030 (%)
Data Table on India - Year-over-year growth 2025-2030 (%)

12.3.4 South Korea - Market size and forecast 2025-2030

Chart on South Korea - Market size and forecast 2025-2030 ($ million)
Data Table on South Korea - Market size and forecast 2025-2030 ($ million)
Chart on South Korea - Year-over-year growth 2025-2030 (%)
Data Table on South Korea - Year-over-year growth 2025-2030 (%)

12.3.5 Australia - Market size and forecast 2025-2030

Chart on Australia - Market size and forecast 2025-2030 ($ million)
Data Table on Australia - Market size and forecast 2025-2030 ($ million)
Chart on Australia - Year-over-year growth 2025-2030 (%)
Data Table on Australia - Year-over-year growth 2025-2030 (%)

12.3.6 Indonesia - Market size and forecast 2025-2030

Chart on Indonesia - Market size and forecast 2025-2030 ($ million)
Data Table on Indonesia - Market size and forecast 2025-2030 ($ million)
Chart on Indonesia - Year-over-year growth 2025-2030 (%)
Data Table on Indonesia - Year-over-year growth 2025-2030 (%)

12.4 North America - Market size and forecast 2025-2030

Chart on North America - Market size and forecast 2025-2030 ($ million)
Data Table on North America - Market size and forecast 2025-2030 ($ million)
Chart on North America - Year-over-year growth 2025-2030 (%)
Data Table on North America - Year-over-year growth 2025-2030 (%)
Chart on Regional Comparison - North America
Data Table on Regional Comparison - North America

12.4.1 US - Market size and forecast 2025-2030

Chart on US - Market size and forecast 2025-2030 ($ million)
Data Table on US - Market size and forecast 2025-2030 ($ million)
Chart on US - Year-over-year growth 2025-2030 (%)
Data Table on US - Year-over-year growth 2025-2030 (%)

12.4.2 Canada - Market size and forecast 2025-2030

Chart on Canada - Market size and forecast 2025-2030 ($ million)
Data Table on Canada - Market size and forecast 2025-2030 ($ million)
Chart on Canada - Year-over-year growth 2025-2030 (%)
Data Table on Canada - Year-over-year growth 2025-2030 (%)

12.4.3 Mexico - Market size and forecast 2025-2030

Chart on Mexico - Market size and forecast 2025-2030 ($ million)
Data Table on Mexico - Market size and forecast 2025-2030 ($ million)
Chart on Mexico - Year-over-year growth 2025-2030 (%)
Data Table on Mexico - Year-over-year growth 2025-2030 (%)

12.5 Europe - Market size and forecast 2025-2030

Chart on Europe - Market size and forecast 2025-2030 ($ million)
Data Table on Europe - Market size and forecast 2025-2030 ($ million)
Chart on Europe - Year-over-year growth 2025-2030 (%)
Data Table on Europe - Year-over-year growth 2025-2030 (%)
Chart on Regional Comparison - Europe
Data Table on Regional Comparison - Europe

12.5.1 Germany - Market size and forecast 2025-2030

Chart on Germany - Market size and forecast 2025-2030 ($ million)
Data Table on Germany - Market size and forecast 2025-2030 ($ million)
Chart on Germany - Year-over-year growth 2025-2030 (%)
Data Table on Germany - Year-over-year growth 2025-2030 (%)

12.5.2 UK - Market size and forecast 2025-2030

Chart on UK - Market size and forecast 2025-2030 ($ million)
Data Table on UK - Market size and forecast 2025-2030 ($ million)
Chart on UK - Year-over-year growth 2025-2030 (%)
Data Table on UK - Year-over-year growth 2025-2030 (%)

12.5.3 France - Market size and forecast 2025-2030

Chart on France - Market size and forecast 2025-2030 ($ million)
Data Table on France - Market size and forecast 2025-2030 ($ million)
Chart on France - Year-over-year growth 2025-2030 (%)
Data Table on France - Year-over-year growth 2025-2030 (%)

12.5.4 Italy - Market size and forecast 2025-2030

Chart on Italy - Market size and forecast 2025-2030 ($ million)
Data Table on Italy - Market size and forecast 2025-2030 ($ million)
Chart on Italy - Year-over-year growth 2025-2030 (%)
Data Table on Italy - Year-over-year growth 2025-2030 (%)

12.5.5 Spain - Market size and forecast 2025-2030

Chart on Spain - Market size and forecast 2025-2030 ($ million)
Data Table on Spain - Market size and forecast 2025-2030 ($ million)
Chart on Spain - Year-over-year growth 2025-2030 (%)
Data Table on Spain - Year-over-year growth 2025-2030 (%)

12.5.6 The Netherlands - Market size and forecast 2025-2030

Chart on The Netherlands - Market size and forecast 2025-2030 ($ million)
Data Table on The Netherlands - Market size and forecast 2025-2030 ($ million)
Chart on The Netherlands - Year-over-year growth 2025-2030 (%)
Data Table on The Netherlands - Year-over-year growth 2025-2030 (%)

12.6 South America - Market size and forecast 2025-2030

Chart on South America - Market size and forecast 2025-2030 ($ million)
Data Table on South America - Market size and forecast 2025-2030 ($ million)
Chart on South America - Year-over-year growth 2025-2030 (%)
Data Table on South America - Year-over-year growth 2025-2030 (%)
Chart on Regional Comparison - South America
Data Table on Regional Comparison - South America

12.6.1 Brazil - Market size and forecast 2025-2030

Chart on Brazil - Market size and forecast 2025-2030 ($ million)
Data Table on Brazil - Market size and forecast 2025-2030 ($ million)
Chart on Brazil - Year-over-year growth 2025-2030 (%)
Data Table on Brazil - Year-over-year growth 2025-2030 (%)

12.6.2 Argentina - Market size and forecast 2025-2030

Chart on Argentina - Market size and forecast 2025-2030 ($ million)
Data Table on Argentina - Market size and forecast 2025-2030 ($ million)
Chart on Argentina - Year-over-year growth 2025-2030 (%)
Data Table on Argentina - Year-over-year growth 2025-2030 (%)

12.6.3 Chile - Market size and forecast 2025-2030

Chart on Chile - Market size and forecast 2025-2030 ($ million)
Data Table on Chile - Market size and forecast 2025-2030 ($ million)
Chart on Chile - Year-over-year growth 2025-2030 (%)
Data Table on Chile - Year-over-year growth 2025-2030 (%)

12.7 Middle East and Africa - Market size and forecast 2025-2030

Chart on Middle East and Africa - Market size and forecast 2025-2030 ($ million)
Data Table on Middle East and Africa - Market size and forecast 2025-2030 ($ million)
Chart on Middle East and Africa - Year-over-year growth 2025-2030 (%)
Data Table on Middle East and Africa - Year-over-year growth 2025-2030 (%)
Chart on Regional Comparison - Middle East and Africa
Data Table on Regional Comparison - Middle East and Africa

12.7.1 Saudi Arabia - Market size and forecast 2025-2030

Chart on Saudi Arabia - Market size and forecast 2025-2030 ($ million)
Data Table on Saudi Arabia - Market size and forecast 2025-2030 ($ million)
Chart on Saudi Arabia - Year-over-year growth 2025-2030 (%)
Data Table on Saudi Arabia - Year-over-year growth 2025-2030 (%)

12.7.2 UAE - Market size and forecast 2025-2030

Chart on UAE - Market size and forecast 2025-2030 ($ million)
Data Table on UAE - Market size and forecast 2025-2030 ($ million)
Chart on UAE - Year-over-year growth 2025-2030 (%)
Data Table on UAE - Year-over-year growth 2025-2030 (%)

12.7.3 South Africa - Market size and forecast 2025-2030

Chart on South Africa - Market size and forecast 2025-2030 ($ million)
Data Table on South Africa - Market size and forecast 2025-2030 ($ million)
Chart on South Africa - Year-over-year growth 2025-2030 (%)
Data Table on South Africa - Year-over-year growth 2025-2030 (%)

12.7.4 Israel - Market size and forecast 2025-2030

Chart on Israel - Market size and forecast 2025-2030 ($ million)
Data Table on Israel - Market size and forecast 2025-2030 ($ million)
Chart on Israel - Year-over-year growth 2025-2030 (%)
Data Table on Israel - Year-over-year growth 2025-2030 (%)

12.7.5 Turkey - Market size and forecast 2025-2030

Chart on Turkey - Market size and forecast 2025-2030 ($ million)
Data Table on Turkey - Market size and forecast 2025-2030 ($ million)
Chart on Turkey - Year-over-year growth 2025-2030 (%)
Data Table on Turkey - Year-over-year growth 2025-2030 (%)

12.8 Market opportunity by geography

Market opportunity by geography ($ million)
Data Tables on Market opportunity by geography ($ million)

13. Drivers, Challenges, and Opportunity

13.1 Market drivers

Increasing number of food service establishments
Rising focus on commercial cooking equipment with improved features
Compliance with international safety standards

13.2 Market challenges

Increasing raw material prices of commercial cooking equipment
High installation costs and maintenance requirements of commercial cooking equipment
Prevailing market for rental commercial cooking equipment

13.3 Impact of drivers and challenges

Impact of drivers and challenges in 2025 and 2030

13.4 Market opportunities

Focus on improving new technologies
Increasing demand for certified equipment
Use of sensors and controllers in commercial cooking equipment

14. Competitive Landscape

14.1 Overview

14.2

Overview on criticality of inputs and factors of differentiation

14.3 Landscape disruption

Overview on factors of disruption

14.4 Industry risks

Impact of key risks on business

15. Competitive Analysis

15.1 Companies profiled

Companies covered

15.2 Company ranking index

15.3 Market positioning of companies

Matrix on companies position and classification

15.4 Ali Group Srl

Ali Group Srl - Overview
Ali Group Srl - Product / Service
Ali Group Srl - Key offerings
SWOT

15.5 Duke Manufacturing

Duke Manufacturing - Overview
Duke Manufacturing - Product / Service
Duke Manufacturing - Key offerings
SWOT

15.6 Electrolux Professional AB

Electrolux Professional AB - Overview
Electrolux Professional AB - Business segments
Electrolux Professional AB - Key offerings
Electrolux Professional AB - Segment focus
SWOT

15.7 Falcon Foodservice Equipment

Falcon Foodservice Equipment - Overview
Falcon Foodservice Equipment - Product / Service
Falcon Foodservice Equipment - Key offerings
SWOT

15.8 Frymaster LLC

Frymaster LLC - Overview
Frymaster LLC - Product / Service
Frymaster LLC - Key offerings
SWOT

15.9 FUJIMAK Corp.

FUJIMAK Corp. - Overview
FUJIMAK Corp. - Product / Service
FUJIMAK Corp. - Key offerings
SWOT

15.10 Garland group

Garland group - Overview
Garland group - Product / Service
Garland group - Key offerings
SWOT

15.11 Hobart Corp.

Hobart Corp. - Overview
Hobart Corp. - Product / Service
Hobart Corp. - Key offerings
SWOT

15.12 ITW Food Equipment Group

ITW Food Equipment Group - Overview
ITW Food Equipment Group - Product / Service
ITW Food Equipment Group - Key offerings
SWOT

15.13 Moretti Forni Spa

Moretti Forni Spa - Overview
Moretti Forni Spa - Product / Service
Moretti Forni Spa - Key offerings
SWOT

15.14 Star Manufacturing International

Star Manufacturing International - Overview
Star Manufacturing International - Product / Service
Star Manufacturing International - Key offerings
SWOT

15.15 The Middleby Corp.

The Middleby Corp. - Overview
The Middleby Corp. - Business segments
The Middleby Corp. - Key offerings
The Middleby Corp. - Segment focus
SWOT

15.16 The Vollrath Co. LLC

The Vollrath Co. LLC - Overview
The Vollrath Co. LLC - Product / Service
The Vollrath Co. LLC - Key offerings
SWOT

15.17 WELBILT Inc.

WELBILT Inc. - Overview
WELBILT Inc. - Product / Service
WELBILT Inc. - Key offerings
SWOT

15.18 XLT Inc.

XLT Inc. - Overview
XLT Inc. - Product / Service
XLT Inc. - Key offerings
SWOT

16. Appendix

16.1 Scope of the report

Market definition
Objectives
Notes and caveats

16.2 Inclusions and exclusions checklist

Inclusions checklist
Exclusions checklist

16.3 Currency conversion rates for US$

16.4 Research methodology

16.5 Data procurement

Information sources

16.6 Data validation

16.7 Validation techniques employed for market sizing

16.8 Data synthesis

16.9 360 degree market analysis

16.10 List of abbreviations

Research Methodology

Technavio presents a detailed picture of the market by way of study, synthesis, and summation of data from multiple sources. The analysts have presented the various facets of the market with a particular focus on identifying the key industry influencers. The data thus presented is comprehensive, reliable, and the result of extensive research, both primary and secondary.

INFORMATION SOURCES

Primary sources

  • Manufacturers and suppliers
  • Channel partners
  • Industry experts
  • Strategic decision makers

Secondary sources

  • Industry journals and periodicals
  • Government data
  • Financial reports of key industry players
  • Historical data
  • Press releases

DATA ANALYSIS

Data Synthesis

  • Collation of data
  • Estimation of key figures
  • Analysis of derived insights

Data Validation

  • Triangulation with data models
  • Reference against proprietary databases
  • Corroboration with industry experts

REPORT WRITING

Qualitative

  • Market drivers
  • Market challenges
  • Market trends
  • Five forces analysis

Quantitative

  • Market size and forecast
  • Market segmentation
  • Geographical insights
  • Competitive landscape

Interested in this report?

Get your sample now to see our research methodology and insights!

Download Now

Frequently Asked Questions

Commercial Cooking Equipment market growth will increase by USD 5140.7 million during 2026-2030.

The Commercial Cooking Equipment market is expected to grow at a CAGR of 6.3% during 2026-2030.

Commercial Cooking Equipment market is segmented by End-user (Quick-service restaurants, Full-service restaurants, Catering) Product (Cookers, Ranges, Fryers, Ovens, Others) Technology (Gas, Electric, Induction)

Ali Group Srl, Alto Shaam Inc., Bakers Pride Oven Co, Blue Seal Ltd., Duke Manufacturing, Electrolux Professional AB, Falcon Foodservice Equipment, Frymaster LLC, FUJIMAK Corp., Garland group, Hobart Corp., ITW Food Equipment Group, Moretti Forni Spa, Ovention Inc., Star Manufacturing International, The Middleby Corp., The Vollrath Co. LLC, TurboChef Technologies Inc., WELBILT Inc., XLT Inc. are a few of the key vendors in the Commercial Cooking Equipment market.

APAC will register the highest growth rate of 38.7% among the other regions. Therefore, the Commercial Cooking Equipment market in APAC is expected to garner significant business opportunities for the vendors during the forecast period.

China, Japan, India, South Korea, Australia, Indonesia, US, Canada, Mexico, Germany, UK, France, Italy, Spain, The Netherlands, Brazil, Argentina, Chile, Saudi Arabia, UAE, South Africa, Israel, Turkey

  • Increasing number of food service establishments is the driving factor this market.

The Commercial Cooking Equipment market vendors should focus on grabbing business opportunities from the End-user segment as it accounted for the largest market share in the base year.
RIA - Research AI Assistant
Ask RIA
