Commercial Printing Outsourcing Market Analysis, Size, and Forecast 2026-2030: APAC (China, India, and Japan), North America (US, Canada, and Mexico), Europe (Germany, UK, and France), Middle East and Africa (Saudi Arabia, UAE, and South Africa), South America (Brazil, Argentina, and Colombia), and Rest of World (ROW)

Commercial Printing Outsourcing Market Analysis, Size, and Forecast 2026-2030:
APAC (China, India, and Japan), North America (US, Canada, and Mexico), Europe (Germany, UK, and France), Middle East and Africa (Saudi Arabia, UAE, and South Africa), South America (Brazil, Argentina, and Colombia), and Rest of World (ROW)

Published: May 2026 323 Pages SKU: IRTNTR81470

Market Overview at a Glance

$55.85 B
Market Opportunity
6.1%
CAGR 2025 - 2030
41.5%
APAC Growth
$61.50 B
Packaging printing segment 2024

Commercial Printing Outsourcing Market Size 2026-2030

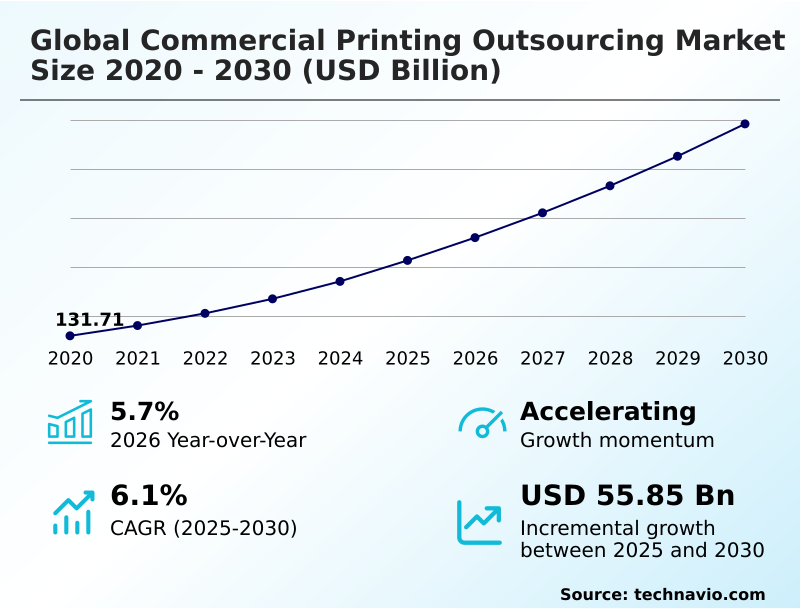
The commercial printing outsourcing market size is valued to increase by USD 55.85 billion, at a CAGR of 6.1% from 2025 to 2030. Cost reduction and capital expenditure optimization will drive the commercial printing outsourcing market.

Major Market Trends & Insights

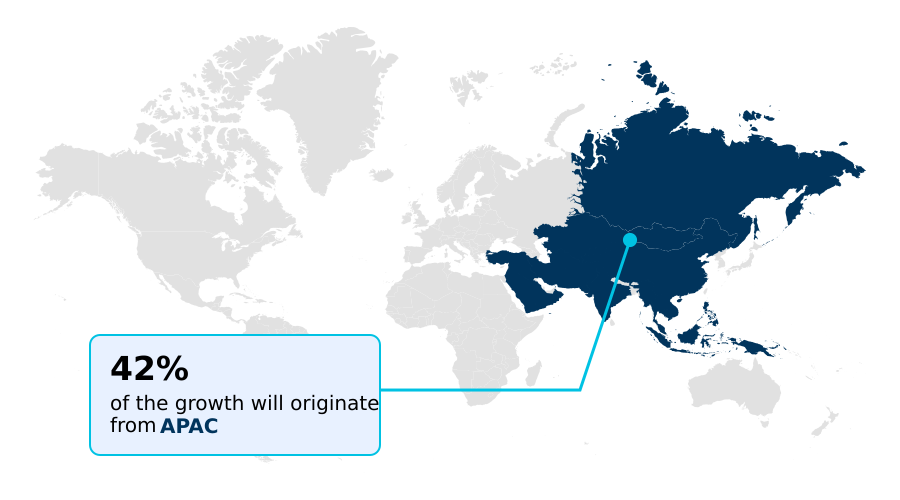
  • APAC dominated the market and accounted for a 41.5% growth during the forecast period.
  • By Application - Packaging printing segment was valued at USD 61.50 billion in 2024
  • By End-user - Retail and e-commerce segment accounted for the largest market revenue share in 2024

Market Size & Forecast

  • Market Opportunities: USD 86.70 billion
  • Market Future Opportunities: USD 55.85 billion
  • CAGR from 2025 to 2030 : 6.1%

Market Summary

  • The commercial printing outsourcing market is undergoing substantial growth as corporations streamline operations and minimize capital expenditures tied to internal printing facilities. This strategic pivot enables enterprises to bypass the steep costs of acquiring, maintaining, and upgrading commercial printing equipment. Outsourcing provides essential scalability, allowing businesses to adjust print volumes based on seasonal demands without the burden of idle machinery.
  • For instance, a multinational retail corporation can execute a synchronized holiday marketing campaign across different regions by partnering with a network of printers, ensuring brand consistency and timely delivery without managing logistics internally. This reliance is bolstered by technological integration, such as automated web-to-print portals that reduce turnaround times.
  • The packaging and retail sectors, in particular, generate immense demand for outsourced services to produce marketing collateral and advanced packaging solutions that require sophisticated finishing techniques. Supply chain optimization further reinforces this dependency, as companies leverage the extensive logistics networks of major print providers to lower shipping costs and meet stringent environmental compliance standards.
  • Consequently, the reliance on external commercial printing experts continues to deepen across diverse industry verticals.

What will be the Size of the Commercial Printing Outsourcing Market during the forecast period?

Get Key Insights on Market Forecast (PDF) Get Free Sample

How is the Commercial Printing Outsourcing Market Segmented?

The commercial printing outsourcing industry research report provides comprehensive data (region-wise segment analysis), with forecasts and estimates in "USD million" for the period 2026-2030, as well as historical data from 2020-2024 for the following segments.
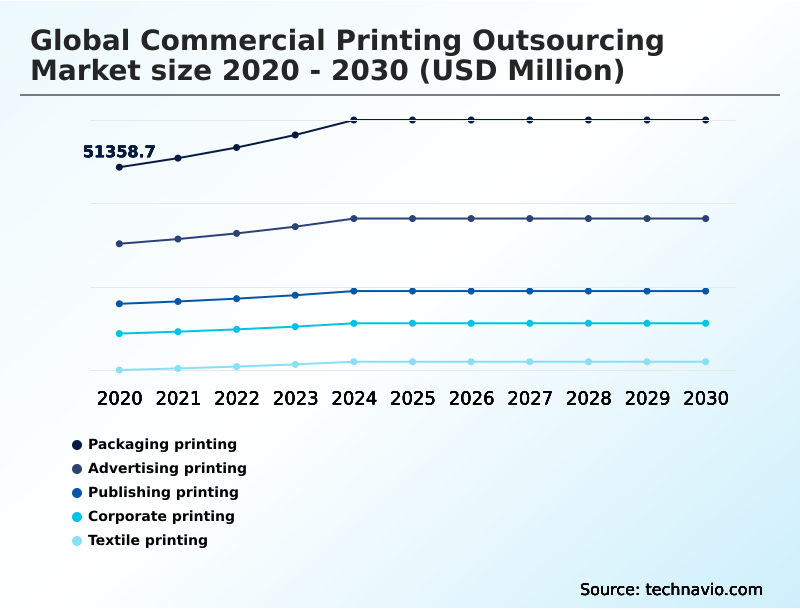
  • Application
    • Packaging printing
    • Advertising printing
    • Publishing printing
    • Corporate printing
    • Textile printing
  • End-user
    • Retail and e-commerce
    • Food and beverage
    • Manufacturing and industrial
    • Healthcare
    • Media and entertainment
  • Material
    • Paper
    • Plastic
    • Textile
    • Metal
    • Wood
  • Geography
    • APAC
      • China
      • India
      • Japan
    • North America
      • US
      • Canada
      • Mexico
    • Europe
      • Germany
      • UK
      • France
    • Middle East and Africa
      • Saudi Arabia
      • UAE
      • South Africa
    • South America
      • Brazil
      • Argentina
      • Colombia
    • Rest of World (ROW)

By Application Insights

The packaging printing segment is estimated to witness significant growth during the forecast period.

The packaging printing sub-segment is a foundational pillar of the commercial printing outsourcing market. Enterprises increasingly outsource to manage the immense capital required for state-of-the-art machinery, leveraging specialized knowledge for complex techniques like foil stamping and spot ultraviolet coating.

This strategic shift facilitates the use of eco-friendly substrates and sustainable printing practices, crucial for brand image. The rise of e-commerce transforms shipping cartons into primary marketing tools, where brand consistency management is paramount.

By engaging external partners, companies achieve a 25% reduction in time-to-market for new product packaging.

This operational model uses automated workflow systems, embraces print-on-demand services, and supports omnichannel marketing, allowing businesses to focus on core competencies while ensuring high-quality, sustainable outputs.

Get Free Sample

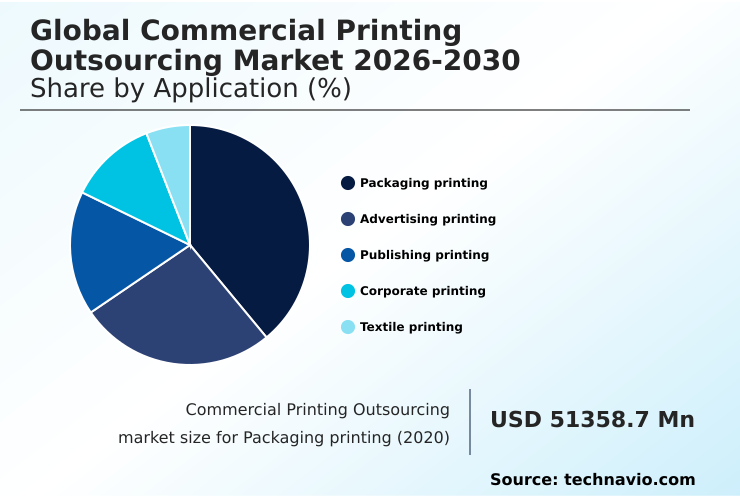
The Packaging printing segment was valued at USD 61.50 billion in 2024 and showed a gradual increase during the forecast period.

Get Free Sample

Regional Analysis

APAC is estimated to contribute 41.5% to the growth of the global market during the forecast period.Technavio’s analysts have elaborately explained the regional trends and drivers that shape the market during the forecast period.

See How Commercial Printing Outsourcing Market Demand is Rising in APAC Get Free Sample

The geographic landscape is led by APAC, which accounts for over 41% of the incremental growth, driven by rapid economic expansion in China and India.

In North America, a mature market, the focus is on high-value applications and data security, with adoption of digital printing technologies leading to a 15% improvement in targeted marketing ROI.

Europe's market is defined by stringent environmental regulations and the need for multilingual localization, where outsourcing to regional hubs reduces cross-border shipping costs by up to 20%. Both direct-to-garment printing and advanced digital presses are key enablers.

Across regions, a strategic focus on core competencies and the adoption of specialized outsourcing for functions like direct mail fulfillment and large-format printing are creating a more agile and efficient global market structure.

Market Dynamics

Our researchers analyzed the data with 2025 as the base year, along with the key drivers, trends, and challenges. A holistic analysis of drivers will help companies refine their marketing strategies to gain a competitive advantage.

  • Analyzing the cost of in-house vs outsourced printing reveals a compelling financial argument for external partnerships, particularly when considering the total cost of ownership for printing equipment. The impact of digital printing on supply chains is profound, enabling just-in-time inventory models that significantly reduce warehousing expenses.
  • Businesses are increasingly focused on the role of printing in omnichannel marketing, using physical media to drive digital engagement. The benefits of outsourcing print management for global brands include centralized control over brand consistency while allowing for localized production, which is crucial for maintaining a uniform identity across diverse markets.
  • Sustainable printing practices for corporate branding are no longer optional, with clients demanding eco-friendly materials and processes. The future of commercial printing and logistics integration points toward more deeply embedded partnerships where providers act as extensions of the client’s operational team.
  • The adoption rate of web-to-print solutions in enterprises has been shown to be 50% higher when integrated with existing ERP systems. Security features in transactional printing, such as microprinting and watermarks, are critical for financial and healthcare sectors. The ROI of personalized direct mail campaigns is often higher than that of their static counterparts.
  • Furthermore, evaluating commercial printer technology portfolios becomes a key differentiator during vendor selection. The comparison of offset vs digital for packaging runs depends heavily on volume and customization needs. Lastly, ensuring data privacy in outsourced variable data printing is a top-tier concern, driving investment in secure data handling protocols.

What are the key market drivers leading to the rise in the adoption of Commercial Printing Outsourcing Industry?

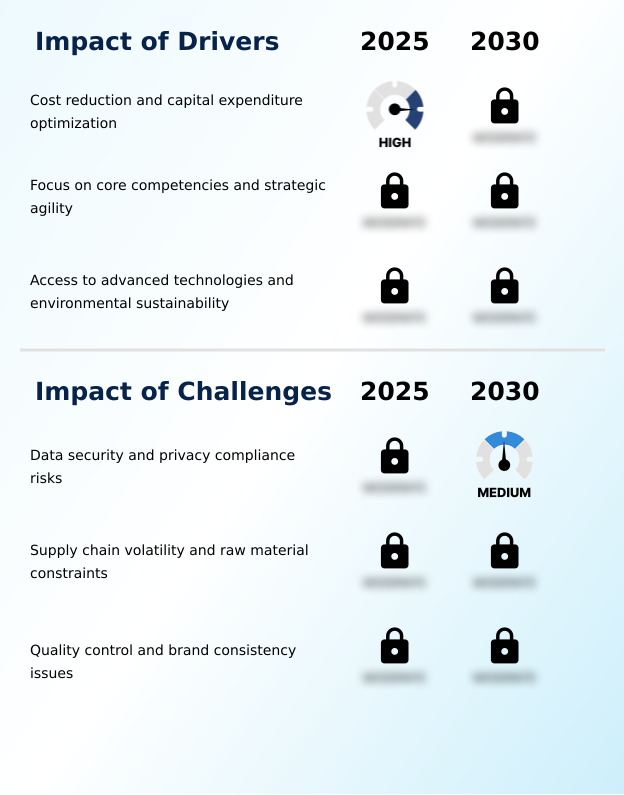
  • Cost reduction and capital expenditure optimization are key drivers propelling growth in the commercial printing outsourcing market.

  • Primary market drivers are centered on cost reduction and strategic focus. By transitioning from in-house facilities to external providers, organizations eliminate significant capital expenditures, with some firms reporting a 95% reduction in equipment upgrade liabilities.
  • This shift to a variable cost model offers financial predictability and allows resources to be reallocated to core competencies, enhancing corporate agility.
  • Access to advanced technology without ownership is another powerful driver; businesses gain capabilities in high-fidelity color reproduction and large-format printing, which can improve marketing material effectiveness by 30%.
  • Furthermore, outsourcing to environmentally conscious providers helps corporations meet sustainability targets, leveraging partners' investments in eco-friendly inks and certified paper substrates, thereby enhancing their green brand imaging.

What are the market trends shaping the Commercial Printing Outsourcing Industry?

  • The expansion of web-to-print platforms and their seamless integration into e-commerce ecosystems represents a fundamental evolution in the commercial printing outsourcing market. This trend is shifting procurement toward highly automated, user-centric ordering processes.

  • Key trends are reshaping the commercial printing outsourcing market, driven by the expansion of web-to-print platforms and hyper-personalization. These digital storefronts allow enterprises to maintain strict brand control while enabling decentralized ordering, which has been shown to reduce procurement errors by 25%.
  • Concurrently, the demand for variable data printing is surging as marketers aim to cut through digital noise with highly tailored physical communications, improving direct mail ROI by over 50% in some campaigns. The convergence of physical and digital experiences, using technologies like near-field communication, elevates printed materials from static objects to interactive gateways.
  • This evolution compels providers to offer not just production but also sophisticated data management and anti-counterfeit printing capabilities, including secure data processing to protect sensitive consumer information.

What challenges does the Commercial Printing Outsourcing Industry face during its growth?

  • Significant data security and privacy compliance risks present a key challenge affecting growth within the commercial printing outsourcing industry.

  • The commercial printing outsourcing market confronts significant challenges, primarily data security risks and supply chain volatility. Transmitting sensitive financial or healthcare data to third-party printers introduces vulnerabilities, and a single breach can lead to penalties that are 200% greater than the initial contract value. This necessitates rigorous cybersecurity measures and compliance with regulations like GDPR.
  • Supply chain disruptions present another major hurdle; fluctuations in paper and ink prices can increase project costs unexpectedly by up to 15%. This volatility undermines the cost predictability that drives outsourcing. Quality control across different providers also remains a concern, where variations in digital press calibration can affect brand consistency.
  • These challenges require robust vendor management and create a complex risk landscape for enterprises.

Exclusive Technavio Analysis on Customer Landscape

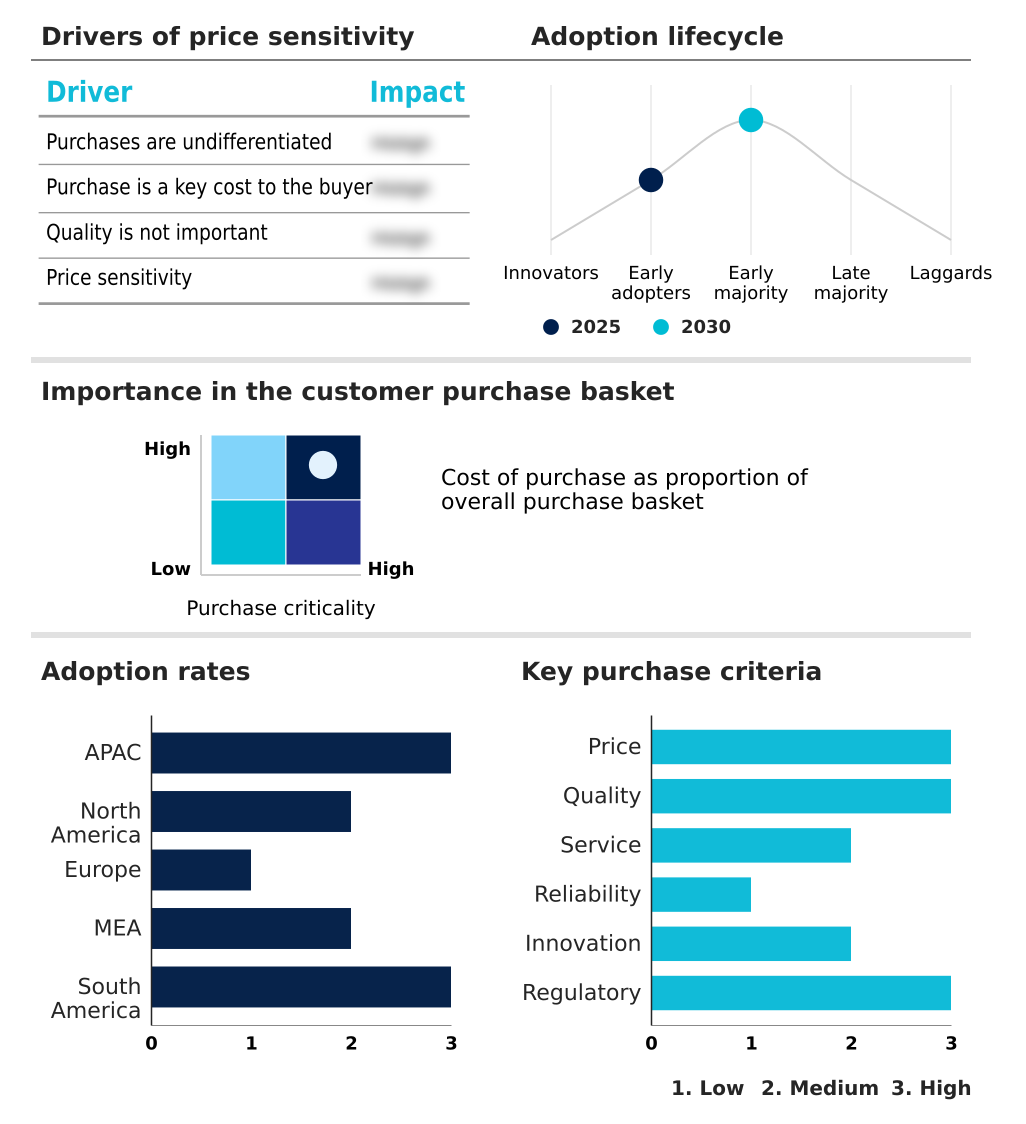
The commercial printing outsourcing market forecasting report includes the adoption lifecycle of the market, covering from the innovator’s stage to the laggard’s stage. It focuses on adoption rates in different regions based on penetration. Furthermore, the commercial printing outsourcing market report also includes key purchase criteria and drivers of price sensitivity to help companies evaluate and develop their market growth analysis strategies.

Customer Landscape of Commercial Printing Outsourcing Industry

Competitive Landscape

Companies are implementing various strategies, such as strategic alliances, commercial printing outsourcing market forecast, partnerships, mergers and acquisitions, geographical expansion, and product/service launches, to enhance their presence in the industry.

Bertelsmann SE and Co. KGaA - Specialized outsourcing for high-volume publication and catalog production is offered, enhancing print supply chain management for global enterprises.

The industry research and growth report includes detailed analyses of the competitive landscape of the market and information about key companies, including:

  • Bertelsmann SE and Co. KGaA
  • Brady Corp.
  • Canon Inc.
  • Cenveo Worldwide Ltd.
  • Cimpress Plc
  • Dai Nippon Printing Co. Ltd.
  • Deluxe Corp.
  • Konica Minolta Inc.
  • LSC Communications LLC
  • Mimeo
  • Multi Color Corp.
  • Quad Graphics Inc.
  • Ricoh Co. Ltd.
  • RR Donnelley and Sons Co.
  • Taylor Corp.
  • Toppan Inc.
  • Transcontinental Inc.
  • Walstead Group
  • Williams Lea Ltd.
  • Xerox Holdings Corp.

Qualitative and quantitative analysis of companies has been conducted to help clients understand the wider business environment as well as the strengths and weaknesses of key industry players. Data is qualitatively analyzed to categorize companies as pure play, category-focused, industry-focused, and diversified; it is quantitatively analyzed to categorize companies as dominant, leading, strong, tentative, and weak.

Recent Development and News in Commercial printing outsourcing market

  • In August 2025, Durst Group announced its Open Software Initiative, a neutral and modular software platform designed to extend beyond proprietary systems and support broader integration across the commercial printing ecosystem.
  • In September 2025, Gelato announced the launch of its GelatoConnect AI Estimator, a breakthrough innovation aimed at transforming the quotation process for print service providers (PSPs).
  • In January 2025, Kodak launched KODAK PRINERGY Software Version 11.0, reinforcing the company's continued investment in enhancing workflow automation, operational efficiency, and system connectivity within the commercial printing industry.
  • In May 2025, Taktiful Software Solutions officially launched Taktify, the first AI-powered cost estimating and pricing platform developed specifically for digital print embellishments.

Dive into Technavio’s robust research methodology, blending expert interviews, extensive data synthesis, and validated models for unparalleled Commercial Printing Outsourcing Market insights. See full methodology.

Market Scope
Page number 323
Base year 2025
Historic period 2020-2024
Forecast period 2026-2030
Growth momentum & CAGR Accelerate at a CAGR of 6.1%
Market growth 2026-2030 USD 55848.9 million
Market structure Fragmented
YoY growth 2025-2026(%) 5.7%
Key countries China, India, Japan, South Korea, Australia, Indonesia, US, Canada, Mexico, Germany, UK, France, Italy, Spain, The Netherlands, Saudi Arabia, UAE, South Africa, Turkey, Israel, Brazil, Argentina and Colombia
Competitive landscape Leading Companies, Market Positioning of Companies, Competitive Strategies, and Industry Risks

Request Free Sample

Research Analyst Overview

  • The commercial printing outsourcing market is defined by a strategic corporate pivot away from capital-intensive in-house production toward agile, service-based models. This shift is driven by the need to access advanced technologies like variable data printing and digital dye sublimation without direct investment. For boardroom consideration, this trend directly impacts budgeting by converting fixed capital expenditures into predictable operational costs.
  • Organizations partnering with specialized providers have achieved up to a 30% reduction in material waste through optimized production enabled by automated workflow systems and sophisticated prepress software. The adoption of web-to-print platforms and digital storefronts is no longer a novelty but a core requirement for managing brand assets and streamlining procurement.
  • This evolution is further accelerated by the demand for interactive print and print-on-demand services, which require specialized capabilities in areas such as digital textile printing, anodic printing, and dye-sublimation printing. The market's trajectory is toward deeper integration, where outsourcing partners provide end-to-end solutions, from graphic design to direct mail fulfillment.

What are the Key Data Covered in this Commercial Printing Outsourcing Market Research and Growth Report?

  • What is the expected growth of the Commercial Printing Outsourcing Market between 2026 and 2030?

    • USD 55.85 billion, at a CAGR of 6.1%

  • What segmentation does the market report cover?

    • The report is segmented by Application (Packaging printing, Advertising printing, Publishing printing, Corporate printing, and Textile printing), End-user (Retail and e-commerce, Food and beverage, Manufacturing and industrial, Healthcare, and Media and entertainment), Material (Paper, Plastic, Textile, Metal, and Wood) and Geography (APAC, North America, Europe, Middle East and Africa, South America)

  • Which regions are analyzed in the report?

    • APAC, North America, Europe, Middle East and Africa and South America

  • What are the key growth drivers and market challenges?

    • Cost reduction and capital expenditure optimization, Data security and privacy compliance risks

  • Who are the major players in the Commercial Printing Outsourcing Market?

    • Bertelsmann SE and Co. KGaA, Brady Corp., Canon Inc., Cenveo Worldwide Ltd., Cimpress Plc, Dai Nippon Printing Co. Ltd., Deluxe Corp., Konica Minolta Inc., LSC Communications LLC, Mimeo, Multi Color Corp., Quad Graphics Inc., Ricoh Co. Ltd., RR Donnelley and Sons Co., Taylor Corp., Toppan Inc., Transcontinental Inc., Walstead Group, Williams Lea Ltd. and Xerox Holdings Corp.

Market Research Insights

  • The market dynamics are shaped by a definitive shift toward operational efficiency, where outsourcing enables a transition from fixed capital expenditures to variable operational costs. Enterprises leveraging specialized print service providers report up to a 40% reduction in obsolete inventory costs through just-in-time production models facilitated by robust digital storefronts.
  • This strategic agility allows for rapid campaign launches, a crucial advantage in the fast-paced retail and financial sectors. Furthermore, the adoption of web-to-print platforms has improved brand consistency management by 30% for decentralized organizations, ensuring all marketing collateral adheres to strict corporate guidelines.
  • This evolution transforms outsourcing providers from mere producers into strategic partners who deliver value through advanced technology and streamlined logistics.

We can help! Our analysts can customize this commercial printing outsourcing market research report to meet your requirements.

Get in touch

1. Executive Summary

1.1 Market overview

Executive Summary - Chart on Market Overview
Executive Summary - Data Table on Market Overview
Executive Summary - Chart on Global Market Characteristics
Executive Summary - Chart on Market by Geography
Executive Summary - Chart on Market Segmentation by Application
Executive Summary - Chart on Market Segmentation by End-user
Executive Summary - Chart on Market Segmentation by Material
Executive Summary - Chart on Incremental Growth
Executive Summary - Data Table on Incremental Growth
Executive Summary - Chart on Company Market Positioning

2. Technavio Analysis

2.1 Analysis of price sensitivity, lifecycle, customer purchase basket, adoption rates, and purchase criteria

2.2 Criticality of inputs and Factors of differentiation

Chart on Overview on criticality of inputs and factors of differentiation

2.3 Factors of disruption

Chart on Overview on factors of disruption

2.4 Impact of drivers and challenges

Chart on Impact of drivers and challenges in 2025 and 2030

3. Market Landscape

3.1 Market ecosystem

Chart on Parent Market
Data Table on - Parent Market

3.2 Market characteristics

Chart on Market characteristics analysis

3.3 Value chain analysis

Chart on Value chain analysis

4. Market Sizing

4.1 Market definition

Data Table on Offerings of companies included in the market definition

4.2 Market segment analysis

Market segments

4.3 Market size 2025

4.4 Market outlook: Forecast for 2025-2030

Chart on Global - Market size and forecast 2025-2030 ($ million)
Data Table on Global - Market size and forecast 2025-2030 ($ million)
Chart on Global Market: Year-over-year growth 2025-2030 (%)
Data Table on Global Market: Year-over-year growth 2025-2030 (%)

5. Historic Market Size

5.1 Global Commercial Printing Outsourcing Market 2020 - 2024

Historic Market Size - Data Table on Global Commercial Printing Outsourcing Market 2020 - 2024 ($ million)

5.2 Application segment analysis 2020 - 2024

Historic Market Size - Application Segment 2020 - 2024 ($ million)

5.3 End-user segment analysis 2020 - 2024

Historic Market Size - End-user Segment 2020 - 2024 ($ million)

5.4 Material segment analysis 2020 - 2024

Historic Market Size - Material Segment 2020 - 2024 ($ million)

5.5 Geography segment analysis 2020 - 2024

Historic Market Size - Geography Segment 2020 - 2024 ($ million)

5.6 Country segment analysis 2020 - 2024

Historic Market Size - Country Segment 2020 - 2024 ($ million)

6. Qualitative Analysis

6.1 Impact of AI on Global Commercial Printing Outsourcing Market

6.2 Impact of Geopolitical Conflicts on Global Commercial Printing Outsourcing Market

7. Five Forces Analysis

7.1 Five forces summary

Five forces analysis - Comparison between 2025 and 2030

7.2 Bargaining power of buyers

Bargaining power of buyers - Impact of key factors 2025 and 2030

7.3 Bargaining power of suppliers

Bargaining power of suppliers - Impact of key factors in 2025 and 2030

7.4 Threat of new entrants

Threat of new entrants - Impact of key factors in 2025 and 2030

7.5 Threat of substitutes

Threat of substitutes - Impact of key factors in 2025 and 2030

7.6 Threat of rivalry

Threat of rivalry - Impact of key factors in 2025 and 2030

7.7 Market condition

Chart on Market condition - Five forces 2025 and 2030

8. Market Segmentation by Application

8.1 Market segments

Chart on Application - Market share 2025-2030 (%)
Data Table on Application - Market share 2025-2030 (%)

8.2 Comparison by Application

Chart on Comparison by Application
Data Table on Comparison by Application

8.3 Packaging printing - Market size and forecast 2025-2030

Chart on Packaging printing - Market size and forecast 2025-2030 ($ million)
Data Table on Packaging printing - Market size and forecast 2025-2030 ($ million)
Chart on Packaging printing - Year-over-year growth 2025-2030 (%)
Data Table on Packaging printing - Year-over-year growth 2025-2030 (%)

8.4 Advertising printing - Market size and forecast 2025-2030

Chart on Advertising printing - Market size and forecast 2025-2030 ($ million)
Data Table on Advertising printing - Market size and forecast 2025-2030 ($ million)
Chart on Advertising printing - Year-over-year growth 2025-2030 (%)
Data Table on Advertising printing - Year-over-year growth 2025-2030 (%)

8.5 Publishing printing - Market size and forecast 2025-2030

Chart on Publishing printing - Market size and forecast 2025-2030 ($ million)
Data Table on Publishing printing - Market size and forecast 2025-2030 ($ million)
Chart on Publishing printing - Year-over-year growth 2025-2030 (%)
Data Table on Publishing printing - Year-over-year growth 2025-2030 (%)

8.6 Corporate printing - Market size and forecast 2025-2030

Chart on Corporate printing - Market size and forecast 2025-2030 ($ million)
Data Table on Corporate printing - Market size and forecast 2025-2030 ($ million)
Chart on Corporate printing - Year-over-year growth 2025-2030 (%)
Data Table on Corporate printing - Year-over-year growth 2025-2030 (%)

8.7 Textile printing - Market size and forecast 2025-2030

Chart on Textile printing - Market size and forecast 2025-2030 ($ million)
Data Table on Textile printing - Market size and forecast 2025-2030 ($ million)
Chart on Textile printing - Year-over-year growth 2025-2030 (%)
Data Table on Textile printing - Year-over-year growth 2025-2030 (%)

8.8 Market opportunity by Application

Market opportunity by Application ($ million)
Data Table on Market opportunity by Application ($ million)

9. Market Segmentation by End-user

9.1 Market segments

Chart on End-user - Market share 2025-2030 (%)
Data Table on End-user - Market share 2025-2030 (%)

9.2 Comparison by End-user

Chart on Comparison by End-user
Data Table on Comparison by End-user

9.3 Retail and e-commerce - Market size and forecast 2025-2030

Chart on Retail and e-commerce - Market size and forecast 2025-2030 ($ million)
Data Table on Retail and e-commerce - Market size and forecast 2025-2030 ($ million)
Chart on Retail and e-commerce - Year-over-year growth 2025-2030 (%)
Data Table on Retail and e-commerce - Year-over-year growth 2025-2030 (%)

9.4 Food and beverage - Market size and forecast 2025-2030

Chart on Food and beverage - Market size and forecast 2025-2030 ($ million)
Data Table on Food and beverage - Market size and forecast 2025-2030 ($ million)
Chart on Food and beverage - Year-over-year growth 2025-2030 (%)
Data Table on Food and beverage - Year-over-year growth 2025-2030 (%)

9.5 Manufacturing and industrial - Market size and forecast 2025-2030

Chart on Manufacturing and industrial - Market size and forecast 2025-2030 ($ million)
Data Table on Manufacturing and industrial - Market size and forecast 2025-2030 ($ million)
Chart on Manufacturing and industrial - Year-over-year growth 2025-2030 (%)
Data Table on Manufacturing and industrial - Year-over-year growth 2025-2030 (%)

9.6 Healthcare - Market size and forecast 2025-2030

Chart on Healthcare - Market size and forecast 2025-2030 ($ million)
Data Table on Healthcare - Market size and forecast 2025-2030 ($ million)
Chart on Healthcare - Year-over-year growth 2025-2030 (%)
Data Table on Healthcare - Year-over-year growth 2025-2030 (%)

9.7 Media and entertainment - Market size and forecast 2025-2030

Chart on Media and entertainment - Market size and forecast 2025-2030 ($ million)
Data Table on Media and entertainment - Market size and forecast 2025-2030 ($ million)
Chart on Media and entertainment - Year-over-year growth 2025-2030 (%)
Data Table on Media and entertainment - Year-over-year growth 2025-2030 (%)

9.8 Market opportunity by End-user

Market opportunity by End-user ($ million)
Data Table on Market opportunity by End-user ($ million)

10. Market Segmentation by Material

10.1 Market segments

Chart on Material - Market share 2025-2030 (%)
Data Table on Material - Market share 2025-2030 (%)

10.2 Comparison by Material

Chart on Comparison by Material
Data Table on Comparison by Material

10.3 Paper - Market size and forecast 2025-2030

Chart on Paper - Market size and forecast 2025-2030 ($ million)
Data Table on Paper - Market size and forecast 2025-2030 ($ million)
Chart on Paper - Year-over-year growth 2025-2030 (%)
Data Table on Paper - Year-over-year growth 2025-2030 (%)

10.4 Plastic - Market size and forecast 2025-2030

Chart on Plastic - Market size and forecast 2025-2030 ($ million)
Data Table on Plastic - Market size and forecast 2025-2030 ($ million)
Chart on Plastic - Year-over-year growth 2025-2030 (%)
Data Table on Plastic - Year-over-year growth 2025-2030 (%)

10.5 Textile - Market size and forecast 2025-2030

Chart on Textile - Market size and forecast 2025-2030 ($ million)
Data Table on Textile - Market size and forecast 2025-2030 ($ million)
Chart on Textile - Year-over-year growth 2025-2030 (%)
Data Table on Textile - Year-over-year growth 2025-2030 (%)

10.6 Metal - Market size and forecast 2025-2030

Chart on Metal - Market size and forecast 2025-2030 ($ million)
Data Table on Metal - Market size and forecast 2025-2030 ($ million)
Chart on Metal - Year-over-year growth 2025-2030 (%)
Data Table on Metal - Year-over-year growth 2025-2030 (%)

10.7 Wood - Market size and forecast 2025-2030

Chart on Wood - Market size and forecast 2025-2030 ($ million)
Data Table on Wood - Market size and forecast 2025-2030 ($ million)
Chart on Wood - Year-over-year growth 2025-2030 (%)
Data Table on Wood - Year-over-year growth 2025-2030 (%)

10.8 Market opportunity by Material

Market opportunity by Material ($ million)
Data Table on Market opportunity by Material ($ million)

11. Customer Landscape

11.1 Customer landscape overview

Analysis of price sensitivity, lifecycle, customer purchase basket, adoption rates, and purchase criteria

12. Geographic Landscape

12.1 Geographic segmentation

Chart on Market share by geography 2025-2030 (%)
Data Table on Market share by geography 2025-2030 (%)

12.2 Geographic comparison

Chart on Geographic comparison
Data Table on Geographic comparison

12.3 APAC - Market size and forecast 2025-2030

Chart on APAC - Market size and forecast 2025-2030 ($ million)
Data Table on APAC - Market size and forecast 2025-2030 ($ million)
Chart on APAC - Year-over-year growth 2025-2030 (%)
Data Table on APAC - Year-over-year growth 2025-2030 (%)
Chart on Regional Comparison - APAC
Data Table on Regional Comparison - APAC

12.3.1 China - Market size and forecast 2025-2030

Chart on China - Market size and forecast 2025-2030 ($ million)
Data Table on China - Market size and forecast 2025-2030 ($ million)
Chart on China - Year-over-year growth 2025-2030 (%)
Data Table on China - Year-over-year growth 2025-2030 (%)

12.3.2 India - Market size and forecast 2025-2030

Chart on India - Market size and forecast 2025-2030 ($ million)
Data Table on India - Market size and forecast 2025-2030 ($ million)
Chart on India - Year-over-year growth 2025-2030 (%)
Data Table on India - Year-over-year growth 2025-2030 (%)

12.3.3 Japan - Market size and forecast 2025-2030

Chart on Japan - Market size and forecast 2025-2030 ($ million)
Data Table on Japan - Market size and forecast 2025-2030 ($ million)
Chart on Japan - Year-over-year growth 2025-2030 (%)
Data Table on Japan - Year-over-year growth 2025-2030 (%)

12.3.4 South Korea - Market size and forecast 2025-2030

Chart on South Korea - Market size and forecast 2025-2030 ($ million)
Data Table on South Korea - Market size and forecast 2025-2030 ($ million)
Chart on South Korea - Year-over-year growth 2025-2030 (%)
Data Table on South Korea - Year-over-year growth 2025-2030 (%)

12.3.5 Australia - Market size and forecast 2025-2030

Chart on Australia - Market size and forecast 2025-2030 ($ million)
Data Table on Australia - Market size and forecast 2025-2030 ($ million)
Chart on Australia - Year-over-year growth 2025-2030 (%)
Data Table on Australia - Year-over-year growth 2025-2030 (%)

12.3.6 Indonesia - Market size and forecast 2025-2030

Chart on Indonesia - Market size and forecast 2025-2030 ($ million)
Data Table on Indonesia - Market size and forecast 2025-2030 ($ million)
Chart on Indonesia - Year-over-year growth 2025-2030 (%)
Data Table on Indonesia - Year-over-year growth 2025-2030 (%)

12.4 North America - Market size and forecast 2025-2030

Chart on North America - Market size and forecast 2025-2030 ($ million)
Data Table on North America - Market size and forecast 2025-2030 ($ million)
Chart on North America - Year-over-year growth 2025-2030 (%)
Data Table on North America - Year-over-year growth 2025-2030 (%)
Chart on Regional Comparison - North America
Data Table on Regional Comparison - North America

12.4.1 US - Market size and forecast 2025-2030

Chart on US - Market size and forecast 2025-2030 ($ million)
Data Table on US - Market size and forecast 2025-2030 ($ million)
Chart on US - Year-over-year growth 2025-2030 (%)
Data Table on US - Year-over-year growth 2025-2030 (%)

12.4.2 Canada - Market size and forecast 2025-2030

Chart on Canada - Market size and forecast 2025-2030 ($ million)
Data Table on Canada - Market size and forecast 2025-2030 ($ million)
Chart on Canada - Year-over-year growth 2025-2030 (%)
Data Table on Canada - Year-over-year growth 2025-2030 (%)

12.4.3 Mexico - Market size and forecast 2025-2030

Chart on Mexico - Market size and forecast 2025-2030 ($ million)
Data Table on Mexico - Market size and forecast 2025-2030 ($ million)
Chart on Mexico - Year-over-year growth 2025-2030 (%)
Data Table on Mexico - Year-over-year growth 2025-2030 (%)

12.5 Europe - Market size and forecast 2025-2030

Chart on Europe - Market size and forecast 2025-2030 ($ million)
Data Table on Europe - Market size and forecast 2025-2030 ($ million)
Chart on Europe - Year-over-year growth 2025-2030 (%)
Data Table on Europe - Year-over-year growth 2025-2030 (%)
Chart on Regional Comparison - Europe
Data Table on Regional Comparison - Europe

12.5.1 Germany - Market size and forecast 2025-2030

Chart on Germany - Market size and forecast 2025-2030 ($ million)
Data Table on Germany - Market size and forecast 2025-2030 ($ million)
Chart on Germany - Year-over-year growth 2025-2030 (%)
Data Table on Germany - Year-over-year growth 2025-2030 (%)

12.5.2 UK - Market size and forecast 2025-2030

Chart on UK - Market size and forecast 2025-2030 ($ million)
Data Table on UK - Market size and forecast 2025-2030 ($ million)
Chart on UK - Year-over-year growth 2025-2030 (%)
Data Table on UK - Year-over-year growth 2025-2030 (%)

12.5.3 France - Market size and forecast 2025-2030

Chart on France - Market size and forecast 2025-2030 ($ million)
Data Table on France - Market size and forecast 2025-2030 ($ million)
Chart on France - Year-over-year growth 2025-2030 (%)
Data Table on France - Year-over-year growth 2025-2030 (%)

12.5.4 Italy - Market size and forecast 2025-2030

Chart on Italy - Market size and forecast 2025-2030 ($ million)
Data Table on Italy - Market size and forecast 2025-2030 ($ million)
Chart on Italy - Year-over-year growth 2025-2030 (%)
Data Table on Italy - Year-over-year growth 2025-2030 (%)

12.5.5 Spain - Market size and forecast 2025-2030

Chart on Spain - Market size and forecast 2025-2030 ($ million)
Data Table on Spain - Market size and forecast 2025-2030 ($ million)
Chart on Spain - Year-over-year growth 2025-2030 (%)
Data Table on Spain - Year-over-year growth 2025-2030 (%)

12.5.6 The Netherlands - Market size and forecast 2025-2030

Chart on The Netherlands - Market size and forecast 2025-2030 ($ million)
Data Table on The Netherlands - Market size and forecast 2025-2030 ($ million)
Chart on The Netherlands - Year-over-year growth 2025-2030 (%)
Data Table on The Netherlands - Year-over-year growth 2025-2030 (%)

12.6 Middle East and Africa - Market size and forecast 2025-2030

Chart on Middle East and Africa - Market size and forecast 2025-2030 ($ million)
Data Table on Middle East and Africa - Market size and forecast 2025-2030 ($ million)
Chart on Middle East and Africa - Year-over-year growth 2025-2030 (%)
Data Table on Middle East and Africa - Year-over-year growth 2025-2030 (%)
Chart on Regional Comparison - Middle East and Africa
Data Table on Regional Comparison - Middle East and Africa

12.6.1 Saudi Arabia - Market size and forecast 2025-2030

Chart on Saudi Arabia - Market size and forecast 2025-2030 ($ million)
Data Table on Saudi Arabia - Market size and forecast 2025-2030 ($ million)
Chart on Saudi Arabia - Year-over-year growth 2025-2030 (%)
Data Table on Saudi Arabia - Year-over-year growth 2025-2030 (%)

12.6.2 UAE - Market size and forecast 2025-2030

Chart on UAE - Market size and forecast 2025-2030 ($ million)
Data Table on UAE - Market size and forecast 2025-2030 ($ million)
Chart on UAE - Year-over-year growth 2025-2030 (%)
Data Table on UAE - Year-over-year growth 2025-2030 (%)

12.6.3 South Africa - Market size and forecast 2025-2030

Chart on South Africa - Market size and forecast 2025-2030 ($ million)
Data Table on South Africa - Market size and forecast 2025-2030 ($ million)
Chart on South Africa - Year-over-year growth 2025-2030 (%)
Data Table on South Africa - Year-over-year growth 2025-2030 (%)

12.6.4 Turkey - Market size and forecast 2025-2030

Chart on Turkey - Market size and forecast 2025-2030 ($ million)
Data Table on Turkey - Market size and forecast 2025-2030 ($ million)
Chart on Turkey - Year-over-year growth 2025-2030 (%)
Data Table on Turkey - Year-over-year growth 2025-2030 (%)

12.6.5 Israel - Market size and forecast 2025-2030

Chart on Israel - Market size and forecast 2025-2030 ($ million)
Data Table on Israel - Market size and forecast 2025-2030 ($ million)
Chart on Israel - Year-over-year growth 2025-2030 (%)
Data Table on Israel - Year-over-year growth 2025-2030 (%)

12.7 South America - Market size and forecast 2025-2030

Chart on South America - Market size and forecast 2025-2030 ($ million)
Data Table on South America - Market size and forecast 2025-2030 ($ million)
Chart on South America - Year-over-year growth 2025-2030 (%)
Data Table on South America - Year-over-year growth 2025-2030 (%)
Chart on Regional Comparison - South America
Data Table on Regional Comparison - South America

12.7.1 Brazil - Market size and forecast 2025-2030

Chart on Brazil - Market size and forecast 2025-2030 ($ million)
Data Table on Brazil - Market size and forecast 2025-2030 ($ million)
Chart on Brazil - Year-over-year growth 2025-2030 (%)
Data Table on Brazil - Year-over-year growth 2025-2030 (%)

12.7.2 Argentina - Market size and forecast 2025-2030

Chart on Argentina - Market size and forecast 2025-2030 ($ million)
Data Table on Argentina - Market size and forecast 2025-2030 ($ million)
Chart on Argentina - Year-over-year growth 2025-2030 (%)
Data Table on Argentina - Year-over-year growth 2025-2030 (%)

12.7.3 Colombia - Market size and forecast 2025-2030

Chart on Colombia - Market size and forecast 2025-2030 ($ million)
Data Table on Colombia - Market size and forecast 2025-2030 ($ million)
Chart on Colombia - Year-over-year growth 2025-2030 (%)
Data Table on Colombia - Year-over-year growth 2025-2030 (%)

12.8 Market opportunity by geography

Market opportunity by geography ($ million)
Data Tables on Market opportunity by geography ($ million)

13. Drivers, Challenges, and Opportunity

13.1 Market drivers

Cost reduction and capital expenditure optimization
Focus on core competencies and strategic agility
Access to advanced technologies and environmental sustainability

13.2 Market challenges

Data security and privacy compliance risks
Supply chain volatility and raw material constraints
Quality control and brand consistency issues

13.3 Impact of drivers and challenges

Impact of drivers and challenges in 2025 and 2030

13.4 Market opportunities

Expansion of web-to-print platforms and e-commerce integration
Hyper-personalization driven by variable data printing requirements
Convergence of physical print and interactive digital experiences

14. Competitive Landscape

14.1 Overview

14.2

Overview on criticality of inputs and factors of differentiation

14.3 Landscape disruption

Overview on factors of disruption

14.4 Industry risks

Impact of key risks on business

15. Competitive Analysis

15.1 Companies profiled

Companies covered

15.2 Company ranking index

15.3 Market positioning of companies

Matrix on companies position and classification

15.4 Bertelsmann SE and Co. KGaA

Bertelsmann SE and Co. KGaA - Overview
Bertelsmann SE and Co. KGaA - Business segments
Bertelsmann SE and Co. KGaA - Key offerings
Bertelsmann SE and Co. KGaA - Segment focus
SWOT

15.5 Canon Inc.

Canon Inc. - Overview
Canon Inc. - Business segments
Canon Inc. - Key offerings
Canon Inc. - Segment focus
SWOT

15.6 Cenveo Worldwide Ltd.

Cenveo Worldwide Ltd. - Overview
Cenveo Worldwide Ltd. - Product / Service
Cenveo Worldwide Ltd. - Key offerings
SWOT

15.7 Cimpress Plc

Cimpress Plc - Overview
Cimpress Plc - Business segments
Cimpress Plc - Key offerings
Cimpress Plc - Segment focus
SWOT

15.8 Dai Nippon Printing Co. Ltd.

Dai Nippon Printing Co. Ltd. - Overview
Dai Nippon Printing Co. Ltd. - Business segments
Dai Nippon Printing Co. Ltd. - Key offerings
Dai Nippon Printing Co. Ltd. - Segment focus
SWOT

15.9 Konica Minolta Inc.

Konica Minolta Inc. - Overview
Konica Minolta Inc. - Business segments
Konica Minolta Inc. - Key offerings
Konica Minolta Inc. - Segment focus
SWOT

15.10 LSC Communications LLC

LSC Communications LLC - Overview
LSC Communications LLC - Product / Service
LSC Communications LLC - Key offerings
SWOT

15.11 Quad Graphics Inc.

Quad Graphics Inc. - Overview
Quad Graphics Inc. - Product / Service
Quad Graphics Inc. - Key offerings
SWOT

15.12 Ricoh Co. Ltd.

Ricoh Co. Ltd. - Overview
Ricoh Co. Ltd. - Business segments
Ricoh Co. Ltd. - Key offerings
Ricoh Co. Ltd. - Segment focus
SWOT

15.13 RR Donnelley and Sons Co.

RR Donnelley and Sons Co. - Overview
RR Donnelley and Sons Co. - Product / Service
RR Donnelley and Sons Co. - Key offerings
SWOT

15.14 Toppan Inc.

Toppan Inc. - Overview
Toppan Inc. - Business segments
Toppan Inc. - Key offerings
Toppan Inc. - Segment focus
SWOT

15.15 Transcontinental Inc.

Transcontinental Inc. - Overview
Transcontinental Inc. - Business segments
Transcontinental Inc. - Key offerings
Transcontinental Inc. - Segment focus
SWOT

15.16 Walstead Group

Walstead Group - Overview
Walstead Group - Product / Service
Walstead Group - Key offerings
SWOT

15.17 Williams Lea Ltd.

Williams Lea Ltd. - Overview
Williams Lea Ltd. - Product / Service
Williams Lea Ltd. - Key offerings
SWOT

15.18 Xerox Holdings Corp.

Xerox Holdings Corp. - Overview
Xerox Holdings Corp. - Business segments
Xerox Holdings Corp. - Key offerings
Xerox Holdings Corp. - Segment focus
SWOT

16. Appendix

16.1 Scope of the report

Market definition
Objectives
Notes and caveats

16.2 Inclusions and exclusions checklist

Inclusions checklist
Exclusions checklist

16.3 Currency conversion rates for US$

16.4 Research methodology

16.5 Data procurement

Information sources

16.6 Data validation

16.7 Validation techniques employed for market sizing

16.8 Data synthesis

16.9 360 degree market analysis

16.10 List of abbreviations

Research Methodology

Technavio presents a detailed picture of the market by way of study, synthesis, and summation of data from multiple sources. The analysts have presented the various facets of the market with a particular focus on identifying the key industry influencers. The data thus presented is comprehensive, reliable, and the result of extensive research, both primary and secondary.

INFORMATION SOURCES

Primary sources

  • Manufacturers and suppliers
  • Channel partners
  • Industry experts
  • Strategic decision makers

Secondary sources

  • Industry journals and periodicals
  • Government data
  • Financial reports of key industry players
  • Historical data
  • Press releases

DATA ANALYSIS

Data Synthesis

  • Collation of data
  • Estimation of key figures
  • Analysis of derived insights

Data Validation

  • Triangulation with data models
  • Reference against proprietary databases
  • Corroboration with industry experts

REPORT WRITING

Qualitative

  • Market drivers
  • Market challenges
  • Market trends
  • Five forces analysis

Quantitative

  • Market size and forecast
  • Market segmentation
  • Geographical insights
  • Competitive landscape

Interested in this report?

Get your sample now to see our research methodology and insights!

Download Now

Frequently Asked Questions

Commercial Printing Outsourcing market growth will increase by USD 55848.9 million during 2026-2030.

The Commercial Printing Outsourcing market is expected to grow at a CAGR of 6.1% during 2026-2030.

Commercial Printing Outsourcing market is segmented by Application (Packaging printing, Advertising printing, Publishing printing, Corporate printing, Textile printing) End-user (Retail and e-commerce, Food and beverage, Manufacturing and industrial, Healthcare, Media and entertainment) Material (Paper, Plastic, Textile, Metal, Wood)

Bertelsmann SE and Co. KGaA, Brady Corp., Canon Inc., Cenveo Worldwide Ltd., Cimpress Plc, Dai Nippon Printing Co. Ltd., Deluxe Corp., Konica Minolta Inc., LSC Communications LLC, Mimeo, Multi Color Corp., Quad Graphics Inc., Ricoh Co. Ltd., RR Donnelley and Sons Co., Taylor Corp., Toppan Inc., Transcontinental Inc., Walstead Group, Williams Lea Ltd., Xerox Holdings Corp. are a few of the key vendors in the Commercial Printing Outsourcing market.

APAC will register the highest growth rate of 41.5% among the other regions. Therefore, the Commercial Printing Outsourcing market in APAC is expected to garner significant business opportunities for the vendors during the forecast period.

China, India, Japan, South Korea, Australia, Indonesia, US, Canada, Mexico, Germany, UK, France, Italy, Spain, The Netherlands, Saudi Arabia, UAE, South Africa, Turkey, Israel, Brazil, Argentina, Colombia

  • Cost reduction and capital expenditure optimization is the driving factor this market.

The Commercial Printing Outsourcing market vendors should focus on grabbing business opportunities from the Application segment as it accounted for the largest market share in the base year.
RIA - Research AI Assistant
Ask RIA