Commercial Vehicle Retarder Market Analysis North America,APAC,Europe,South America,Middle East and Africa - US,China,India,Japan,Germany - Size and Forecast 2024-2028

Commercial Vehicle Retarder Market Analysis North America,APAC,Europe,South America,Middle East and Africa - US,China,India,Japan,Germany - Size and Forecast 2024-2028

Published: Dec 2023 164 Pages SKU: IRTNTR73149

Market Overview at a Glance

$356.82 Mn
Market Opportunity
4.4%
CAGR
4.12
YoY growth 2023-2024(%)

Commercial Vehicle Retarder Market Size 2024-2028

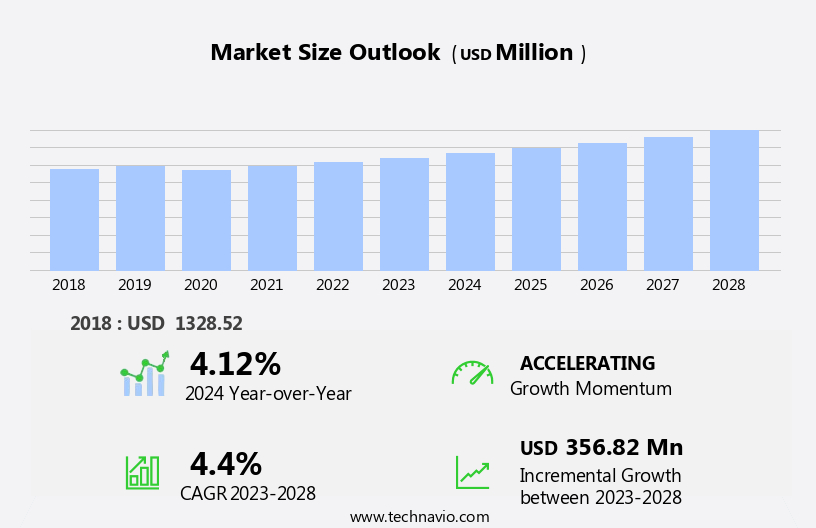
The commercial vehicle retarder market size is forecast to increase by USD 356.82 million, at a CAGR of 4.4% between 2023 and 2028.

  • The market is experiencing significant growth, driven by the reduction in the overall cost of installing retarders. This trend is attributed to advancements in technology, enabling more cost-effective solutions for commercial vehicle operators. The industry is increasingly leveraging machine learning and artificial intelligence to optimize retarder performance, predict maintenance needs, and enhance overall vehicle safety and efficiency. Another key driver is the increasing adoption of self-charging electromagnetic retarders, which offer energy recovery during braking and reduce fuel consumption. However, challenges persist in this market, including the high energy consumption and overheating during retardation.
  • Manufacturers must address these challenges by developing more energy-efficient and heat-resistant technologies to maintain competitiveness and meet evolving customer demands. Effective management of these dynamics will be crucial for companies seeking to capitalize on market opportunities and navigate challenges in the market.

What will be the Size of the Commercial Vehicle Retarder Market during the forecast period?

Commercial Vehicle Retarder Market Size

Explore in-depth regional segment analysis with market size data - historical 2018-2022 and forecasts 2024-2028 - in the full report.  
Request Free Sample

The market continues to evolve, driven by the diverse needs of various sectors, including heavy-duty trucks, off-highway vehicles, and construction equipment. Retarders, such as electric, transmission, and hydraulic types, play a crucial role in heat dissipation, brake fade prevention, and improving fuel efficiency. Primary retarders, like engine brakes and exhaust brakes, are commonly used in heavy-duty vehicles for better speed control and driver comfort. However, secondary retarders, such as retarder actuators, offer additional benefits like torque capacity enhancement and extended service life. The agricultural machinery sector also leverages retarders to ensure optimal performance testing and reduce operating costs.

In the mining industry, retarders help manage the harsh operating conditions and minimize brake wear. Market dynamics are influenced by factors like driver training, wear rate, and fleet management. The ongoing focus on fuel efficiency and environmental impact further propels the adoption of retarders in commercial vehicles. Retarders' role in heat dissipation, performance testing, and life cycle analysis is essential in various applications. As technology advances, retarder control units and testing standards continue to evolve, ensuring continuous improvement and innovation in this dynamic market.

How is this Commercial Vehicle Retarder Industry segmented?

The commercial vehicle retarder industry research report provides comprehensive data (region-wise segment analysis), with forecasts and estimates in "USD million" for the period 2024-2028, as well as historical data from 2018-2022 for the following segments.

  • Product
    • Electromagnetic retarders
    • Hydraulic retarders
  • Type
    • Buses
    • Trucks
  • Geography
    • North America
      • US
    • Europe
      • Germany
    • APAC
      • China
      • India
      • Japan
    • Rest of World (ROW)

By Product Insights

The electromagnetic retarders segment is estimated to witness significant growth during the forecast period.

The market encompasses various types of retarders, including electric and transmission retarders, which employ different mechanisms for generating retarding force. Electromagnetic retarders, a type of electric retarder, utilize the electromagnetic induction process. They can be integrated into the driveline or transmission unit, with a rotor attached to the former and a stator to the vehicle chassis. No contact surfaces or working fluids exist between the components. When a vehicle requires deceleration, power from the battery is supplied to the stator's electrical windings, generating a magnetic field. The rotor, in response, moves within this field, inducing eddy currents and creating an opposing magnetic field.

Heat dissipation is crucial in retarder systems to prevent brake fade and ensure efficient operation. In heavy-duty vehicles, such as commercial trucks, construction equipment, and agricultural machinery, retarders improve fuel efficiency by reducing the need for excessive engine or exhaust brake usage. Fleet management is essential in optimizing retarder usage and minimizing wear rates. Primary retarders provide immediate deceleration, while secondary retarders offer gradual deceleration, catering to various driving conditions. Driver training and comfort are essential factors in the market, as operators must effectively utilize retarders to maximize performance and minimize brake wear. Performance testing, operating costs, service life, and testing standards are critical aspects of the market, ensuring the reliability and efficiency of retarder systems.

The market comprises various players, including manufacturers of retarder actuators, hydraulic retarders, retarder control units, and other components. The market's evolution is driven by the need for improved fuel efficiency, environmental considerations, and the increasing demand for heavy-duty vehicles in various industries.

Commercial Vehicle Retarder Market Size

Request Free Sample

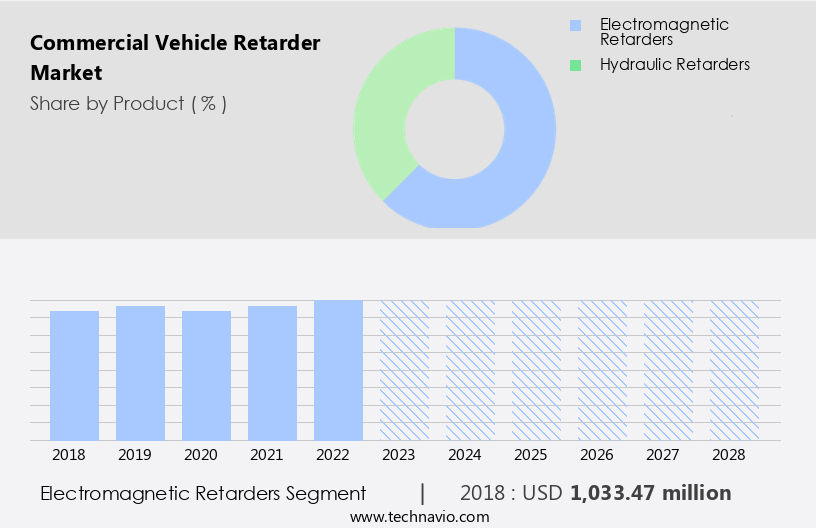
The Electromagnetic retarders segment was valued at USD 1033.47 million in 2018 and showed a gradual increase during the forecast period.

Regional Analysis

North America is estimated to contribute 45% to the growth of the global market during the forecast period. Technavio's analysts have elaborately explained the regional trends and drivers that shape the market during the forecast period.

Commercial Vehicle Retarder Market Share by Geography

 Request Free Sample

In the North American commercial vehicle market, safety systems, particularly commercial vehicle retarders, are gaining traction due to the increasing focus on cargo transportation. The US trucking industry's adoption of these systems is expected to rise, addressing concerns over the industry's escalating number of road accidents. In 2021, approximately 5,700 large trucks were involved in fatal crashes in the US, marking a 10% increase from the previous year. The aging driver population, with a median age of 49 years, is a significant contributing factor to these accidents. Commercial vehicle retarders, available in various forms such as electric and transmission types, help mitigate the effects of heavy braking on vehicles, reducing heat dissipation and brake fade.

Retarders also improve fleet management by optimizing speed control and driver comfort, ultimately reducing brake wear and enhancing fuel efficiency. These benefits are particularly crucial for heavy-duty vehicles, including those used in agriculture, construction, and mining industries. Retarder actuators, with their varying torque capacities, play a vital role in ensuring optimal performance and longevity. The integration of retarder control units and hydraulic retarders further enhances the system's efficiency and effectiveness. As the commercial vehicle market evolves, retarders are becoming essential components in the supply chain, addressing concerns over retarding force, environmental impact, and operating costs. Moreover, the importance of performance testing and adherence to testing standards is increasingly recognized in the industry.

The integration of retarders in commercial vehicles is a strategic move to ensure safety, improve efficiency, and extend the service life of these valuable assets. In conclusion, the adoption of commercial vehicle retarders is a significant trend in the North American market, addressing the challenges of an aging driver population, optimizing fleet management, and enhancing overall vehicle performance.

Market Dynamics

Our researchers analyzed the data with 2023 as the base year, along with the key drivers, trends, and challenges. A holistic analysis of drivers will help companies refine their marketing strategies to gain a competitive advantage.

The market represents a significant segment in the transportation industry, focusing on technologies that enhance the braking performance of heavy-duty trucks and buses. These retarders, also known as engine retarders or Jake brakes, reduce the vehicle's speed during descents, minimizing the need for traditional friction brakes and extending their lifesphere. Retarders employ various mechanisms, such as engine compression brakes, hydraulic retarders, and electrical retarders, to generate resistance and decelerate the vehicle. The market is driven by factors like increasing freight transportation, stringent emission norms, and the growing preference for fuel efficiency and safety. Additionally, advancements in technology, such as regenerative braking systems and hybrid retarders, are expected to shape the market landscape.

What are the key market drivers leading to the rise in the adoption of Commercial Vehicle Retarder Industry?

  • The significant decrease in the total installation cost for commercial vehicle retarders is the primary market motivator. 
  • Commercial vehicle retarders are essential components that enhance the braking system's efficiency and longevity. These devices help reduce the strain on the brakes by controlling the vehicle's descent, particularly during heavy loads or steep gradients. Retarders come in various forms, including electric and transmission types, which utilize oil cooling for heat dissipation. Heavy-duty commercial vehicles, such as off-highway machines, benefit significantly from retarders. They improve fleet management by reducing brake fade and increasing the active safety of the vehicles. By using retarders, the life of the brake lining can be extended by three to five times, leading to substantial cost savings over the vehicle's long lifespan.
  • Retarders contribute to the overall efficiency of the commercial vehicle by relieving the service brake and ensuring the highest efficiency from the disc brake system. This results in the greatest stopping distance, which is crucial for safe and effective vehicle operation. The integration of secondary retarders further enhances the benefits by providing additional control and reducing the wear on the primary retarder.

What are the market trends shaping the Commercial Vehicle Retarder Industry?

  • The integration of self-charging electromagnetic retarders is becoming increasingly prevalent in the market. This emerging trend signifies a significant shift towards advanced energy management solutions.
  • The market encompasses the use of electromagnetic retarders, primarily in heavy-duty vehicles, including trucks and buses, as well as agricultural machinery. These retarders, which include a primary retarder, such as a self-charging type electromagnetic retarder, function by utilizing a stator yoke (core) and steel rotor. The stator yoke is placed between magnetic coils, forming multi-phase connections, while the steel rotor, which acts as a control device, is connected to the transmission unit. As the steel rotor rotates between the magnetic coils, it generates power continuously, which can be reused to charge auxiliary systems, such as batteries.
  • This process enhances fuel efficiency and reduces the need for engine brakes, such as exhaust brakes, in heavy-duty vehicles. The retarder actuator plays a crucial role in controlling the velocity of the retarder, ensuring a harmonious interaction between the vehicle's powertrain and braking systems. The wear rate of the retarder components is a significant factor influencing the market's growth. Regular driver training and maintenance practices can help mitigate the impact of wear and tear, ensuring the longevity of the retarder system. The continuous development of advanced technologies, such as regenerative braking systems, is expected to further boost the market's growth.

What challenges does the Commercial Vehicle Retarder Industry face during its growth?

  • One of the significant challenges impeding industry growth is the high energy consumption and resulting overheating during the retardation phase, which necessitates increased research and development efforts to mitigate these issues and improve overall efficiency. 
  • Commercial vehicle retarders are essential components in managing the braking system of heavy-duty vehicles, ensuring speed control and driver comfort. However, these systems can be subjected to excessive wear due to factors such as harsh driving habits, overloading, and poor road conditions. The resulting damage to the retarder system can lead to increased operating costs, including brake wear and potential performance issues. A recent study revealed that integrating retarders with regenerative braking technology can mitigate the overheating problem, harvesting up to 3 kW of kinetic energy during braking. This not only enhances the system's performance but also extends its service life.
  • By focusing on the benefits of retarder systems, fleet operators can optimize their commercial vehicle operations, ensuring both driver comfort and cost efficiency. Retarders play a crucial role in maintaining the overall efficiency of commercial vehicles, especially in industries such as construction equipment and transportation. Regular performance testing and adherence to established testing standards are essential to ensure the longevity and effectiveness of these systems. By investing in well-maintained retarder systems, businesses can minimize downtime, reduce fuel consumption, and improve overall fleet productivity.

Exclusive Customer Landscape

The commercial vehicle retarder market forecasting report includes the adoption lifecycle of the market, covering from the innovator's stage to the laggard's stage. It focuses on adoption rates in different regions based on penetration. Furthermore, the commercial vehicle retarder market report also includes key purchase criteria and drivers of price sensitivity to help companies evaluate and develop their market growth analysis strategies.

Commercial Vehicle Retarder Market Share by Geography

 Customer Landscape

Key Companies & Market Insights

Companies are implementing various strategies, such as strategic alliances, commercial vehicle retarder market forecast, partnerships, mergers and acquisitions, geographical expansion, and product/service launches, to enhance their presence in the industry.

Brakes India Pvt. Ltd. - This company specializes in commercial vehicle brake systems, providing solutions such as hydraulic drum brakes and transmission park brakes, enhancing safety and efficiency for transportation fleets. 

The industry research and growth report includes detailed analyses of the competitive landscape of the market and information about key companies, including:

  • Brakes India Pvt. Ltd.
  • CAMA Luoyang Electromechanic CO. LTD
  • Cummins Inc.
  • Eaton Corp. Plc
  • Frenos Electricos Unidos SA
  • INDUSTRIAS ZELU SL
  • KRISHNA CHEMICALS
  • Nippon Steel Corp.
  • Regal Rexnord Corp.
  • Scania AB
  • Shandong Heavy Industry Group Co. Ltd.
  • SORL Auto Parts Inc.
  • TBK Co. Ltd.
  • Telma SAS
  • Voith GmbH and Co. KGaA
  • ZF Friedrichshafen AG

Qualitative and quantitative analysis of companies has been conducted to help clients understand the wider business environment as well as the strengths and weaknesses of key industry players. Data is qualitatively analyzed to categorize companies as pure play, category-focused, industry-focused, and diversified; it is quantitatively analyzed to categorize companies as dominant, leading, strong, tentative, and weak.

Recent Development and News in Commercial Vehicle Retarder Market

  • In January 2024, Meritor, Inc., a leading global supplier of commercial vehicle components, announced the launch of its next-generation Blue Horizon™ Series retarders, featuring advanced electronic controls and improved thermal management for enhanced fuel efficiency and reliability (Meritor press release).
  • In March 2024, Wabco Holdings, a leading technology provider for the commercial vehicle industry, and Eaton, a power management company, entered into a strategic partnership to integrate Wabco's advanced braking and stability systems with Eaton's hydraulic retarders, offering customers a comprehensive braking and retarding solution (Wabco press release).
  • In May 2024, BorgWarner, a global technology leader in clean and efficient transportation, announced the acquisition of Delphi Technologies' Power Electronics & Machining business, significantly expanding its electrification capabilities and enhancing its position in the market (BorgWarner press release).
  • In April 2025, the European Union approved the new Euro VI emission standards, which include stricter regulations on commercial vehicle emissions, driving increased demand for retarders and other emissions reduction technologies (European Commission press release).

Research Analyst Overview

  • The market is experiencing significant advancements, driven by the integration of corrosion-resistant materials and driver assistance systems. Advanced materials, such as electromagnetic retarders and fluid couplings, enhance braking systems and vehicle dynamics control, improving payload capacity and downhill speed control. Axle ratio and gear ratio are critical factors in optimizing payload and fuel efficiency. Heat management and thermal stress mitigation are essential for ensuring reliable operation in various climates. Passive safety systems, including hill start assist and vacuum retarders, are increasingly important for vehicle safety. Vehicle dynamics and active safety systems, like torque converters and engine management systems, contribute to improved performance and fuel economy.
  • The integration of additive manufacturing in the production of retarder components offers cost savings and design flexibility. Fuel injection and manual transmission systems are also evolving to accommodate the demands of commercial vehicles. The market is witnessing a shift towards automatic transmissions for enhanced efficiency and ease of operation. The focus on material science and payload optimization continues to drive innovation in the market.

Dive into Technavio's robust research methodology, blending expert interviews, extensive data synthesis, and validated models for unparalleled Commercial Vehicle Retarder Market insights. See full methodology.

Market Scope

Report Coverage

Details

Page number

164

Base year

2023

Historic period

2018-2022

Forecast period

2024-2028

Growth momentum & CAGR

Accelerate at a CAGR of 4.4%

Market growth 2024-2028

USD 356.82 million

Market structure

Fragmented

YoY growth 2023-2024(%)

4.12

Key countries

US, China, India, Japan, and Germany

Competitive landscape

Leading Companies, Market Positioning of Companies, Competitive Strategies, and Industry Risks

Request Free Sample

What are the Key Data Covered in this Commercial Vehicle Retarder Market Research and Growth Report?

  • CAGR of the Commercial Vehicle Retarder industry during the forecast period
  • Detailed information on factors that will drive the growth and forecasting between 2024 and 2028
  • Precise estimation of the size of the market and its contribution of the industry in focus to the parent market
  • Accurate predictions about upcoming growth and trends and changes in consumer behaviour
  • Growth of the market across North America, APAC, Europe, South America, and Middle East and Africa
  • Thorough analysis of the market's competitive landscape and detailed information about companies
  • Comprehensive analysis of factors that will challenge the commercial vehicle retarder market growth of industry companies

We can help! Our analysts can customize this commercial vehicle retarder market research report to meet your requirements.

Get in touch

1 Executive Summary

  • 1.1 Market overview
    • Exhibit 01: Executive Summary – Chart on Market Overview
    • Exhibit 02: Executive Summary – Data Table on Market Overview
    • Exhibit 03: Executive Summary – Chart on Global Market Characteristics
    • Exhibit 04: Executive Summary – Chart on Market by Geography
    • Exhibit 05: Executive Summary – Chart on Market Segmentation by Product
    • Exhibit 06: Executive Summary – Chart on Market Segmentation by Type
    • Exhibit 07: Executive Summary – Chart on Incremental Growth
    • Exhibit 08: Executive Summary – Data Table on Incremental Growth
    • Exhibit 09: Executive Summary – Chart on Vendor Market Positioning

2 Market Landscape

  • 2.1 Market ecosystem
    • Exhibit 10: Parent market
    • Exhibit 11: Market Characteristics

3 Market Sizing

  • 3.1 Market definition
    • Exhibit 12: Offerings of vendors included in the market definition
  • 3.2 Market segment analysis
    • Exhibit 13: Market segments
  • 3.3 Market size 2023
    • 3.4 Market outlook: Forecast for 2023-2028
      • Exhibit 14: Chart on Global - Market size and forecast 2023-2028 ($ million)
      • Exhibit 15: Data Table on Global - Market size and forecast 2023-2028 ($ million)
      • Exhibit 16: Chart on Global Market: Year-over-year growth 2023-2028 (%)
      • Exhibit 17: Data Table on Global Market: Year-over-year growth 2023-2028 (%)

    4 Historic Market Size

    • 4.1 Global commercial vehicle retarder market 2018 - 2022
      • Exhibit 18: Historic Market Size – Data Table on global commercial vehicle retarder market 2018 - 2022 ($ million)
    • 4.2 Product Segment Analysis 2018 - 2022
      • Exhibit 19: Historic Market Size – Product Segment 2018 - 2022 ($ million)
    • 4.3 Type Segment Analysis 2018 - 2022
      • Exhibit 20: Historic Market Size – Type Segment 2018 - 2022 ($ million)
    • 4.4 Geography Segment Analysis 2018 - 2022
      • Exhibit 21: Historic Market Size – Geography Segment 2018 - 2022 ($ million)
    • 4.5 Country Segment Analysis 2018 - 2022
      • Exhibit 22: Historic Market Size – Country Segment 2018 - 2022 ($ million)

    5 Five Forces Analysis

    • 5.1 Five forces summary
      • Exhibit 23: Five forces analysis - Comparison between 2023 and 2028
    • 5.2 Bargaining power of buyers
      • Exhibit 24: Chart on Bargaining power of buyers – Impact of key factors 2023 and 2028
    • 5.3 Bargaining power of suppliers
      • Exhibit 25: Bargaining power of suppliers – Impact of key factors in 2023 and 2028
    • 5.4 Threat of new entrants
      • Exhibit 26: Threat of new entrants – Impact of key factors in 2023 and 2028
    • 5.5 Threat of substitutes
      • Exhibit 27: Threat of substitutes – Impact of key factors in 2023 and 2028
    • 5.6 Threat of rivalry
      • Exhibit 28: Threat of rivalry – Impact of key factors in 2023 and 2028
    • 5.7 Market condition
      • Exhibit 29: Chart on Market condition - Five forces 2023 and 2028

    6 Market Segmentation by Product

    • 6.1 Market segments
      • Exhibit 30: Chart on Product - Market share 2023-2028 (%)
      • Exhibit 31: Data Table on Product - Market share 2023-2028 (%)
    • 6.2 Comparison by Product
      • Exhibit 32: Chart on Comparison by Product
      • Exhibit 33: Data Table on Comparison by Product
    • 6.3 Electromagnetic retarders - Market size and forecast 2023-2028
      • Exhibit 34: Chart on Electromagnetic retarders - Market size and forecast 2023-2028 ($ million)
      • Exhibit 35: Data Table on Electromagnetic retarders - Market size and forecast 2023-2028 ($ million)
      • Exhibit 36: Chart on Electromagnetic retarders - Year-over-year growth 2023-2028 (%)
      • Exhibit 37: Data Table on Electromagnetic retarders - Year-over-year growth 2023-2028 (%)
    • 6.4 Hydraulic retarders - Market size and forecast 2023-2028
      • Exhibit 38: Chart on Hydraulic retarders - Market size and forecast 2023-2028 ($ million)
      • Exhibit 39: Data Table on Hydraulic retarders - Market size and forecast 2023-2028 ($ million)
      • Exhibit 40: Chart on Hydraulic retarders - Year-over-year growth 2023-2028 (%)
      • Exhibit 41: Data Table on Hydraulic retarders - Year-over-year growth 2023-2028 (%)
    • 6.5 Market opportunity by Product
      • Exhibit 42: Market opportunity by Product ($ million)
      • Exhibit 43: Data Table on Market opportunity by Product ($ million)

    7 Market Segmentation by Type

    • 7.1 Market segments
      • Exhibit 44: Chart on Type - Market share 2023-2028 (%)
      • Exhibit 45: Data Table on Type - Market share 2023-2028 (%)
    • 7.2 Comparison by Type
      • Exhibit 46: Chart on Comparison by Type
      • Exhibit 47: Data Table on Comparison by Type
    • 7.3 Buses - Market size and forecast 2023-2028
      • Exhibit 48: Chart on Buses - Market size and forecast 2023-2028 ($ million)
      • Exhibit 49: Data Table on Buses - Market size and forecast 2023-2028 ($ million)
      • Exhibit 50: Chart on Buses - Year-over-year growth 2023-2028 (%)
      • Exhibit 51: Data Table on Buses - Year-over-year growth 2023-2028 (%)
    • 7.4 Trucks - Market size and forecast 2023-2028
      • Exhibit 52: Chart on Trucks - Market size and forecast 2023-2028 ($ million)
      • Exhibit 53: Data Table on Trucks - Market size and forecast 2023-2028 ($ million)
      • Exhibit 54: Chart on Trucks - Year-over-year growth 2023-2028 (%)
      • Exhibit 55: Data Table on Trucks - Year-over-year growth 2023-2028 (%)
    • 7.5 Market opportunity by Type
      • Exhibit 56: Market opportunity by Type ($ million)
      • Exhibit 57: Data Table on Market opportunity by Type ($ million)

    8 Customer Landscape

    • 8.1 Customer landscape overview
      • Exhibit 58: Analysis of price sensitivity, lifecycle, customer purchase basket, adoption rates, and purchase criteria

    9 Geographic Landscape

    • 9.1 Geographic segmentation
      • Exhibit 59: Chart on Market share by geography 2023-2028 (%)
      • Exhibit 60: Data Table on Market share by geography 2023-2028 (%)
    • 9.2 Geographic comparison
      • Exhibit 61: Chart on Geographic comparison
      • Exhibit 62: Data Table on Geographic comparison
    • 9.3 North America - Market size and forecast 2023-2028
      • Exhibit 63: Chart on North America - Market size and forecast 2023-2028 ($ million)
      • Exhibit 64: Data Table on North America - Market size and forecast 2023-2028 ($ million)
      • Exhibit 65: Chart on North America - Year-over-year growth 2023-2028 (%)
      • Exhibit 66: Data Table on North America - Year-over-year growth 2023-2028 (%)
    • 9.4 APAC - Market size and forecast 2023-2028
      • Exhibit 67: Chart on APAC - Market size and forecast 2023-2028 ($ million)
      • Exhibit 68: Data Table on APAC - Market size and forecast 2023-2028 ($ million)
      • Exhibit 69: Chart on APAC - Year-over-year growth 2023-2028 (%)
      • Exhibit 70: Data Table on APAC - Year-over-year growth 2023-2028 (%)
    • 9.5 Europe - Market size and forecast 2023-2028
      • Exhibit 71: Chart on Europe - Market size and forecast 2023-2028 ($ million)
      • Exhibit 72: Data Table on Europe - Market size and forecast 2023-2028 ($ million)
      • Exhibit 73: Chart on Europe - Year-over-year growth 2023-2028 (%)
      • Exhibit 74: Data Table on Europe - Year-over-year growth 2023-2028 (%)
    • 9.6 South America - Market size and forecast 2023-2028
      • Exhibit 75: Chart on South America - Market size and forecast 2023-2028 ($ million)
      • Exhibit 76: Data Table on South America - Market size and forecast 2023-2028 ($ million)
      • Exhibit 77: Chart on South America - Year-over-year growth 2023-2028 (%)
      • Exhibit 78: Data Table on South America - Year-over-year growth 2023-2028 (%)
    • 9.7 Middle East and Africa - Market size and forecast 2023-2028
      • Exhibit 79: Chart on Middle East and Africa - Market size and forecast 2023-2028 ($ million)
      • Exhibit 80: Data Table on Middle East and Africa - Market size and forecast 2023-2028 ($ million)
      • Exhibit 81: Chart on Middle East and Africa - Year-over-year growth 2023-2028 (%)
      • Exhibit 82: Data Table on Middle East and Africa - Year-over-year growth 2023-2028 (%)
    • 9.8 US - Market size and forecast 2023-2028
      • Exhibit 83: Chart on US - Market size and forecast 2023-2028 ($ million)
      • Exhibit 84: Data Table on US - Market size and forecast 2023-2028 ($ million)
      • Exhibit 85: Chart on US - Year-over-year growth 2023-2028 (%)
      • Exhibit 86: Data Table on US - Year-over-year growth 2023-2028 (%)
    • 9.9 China - Market size and forecast 2023-2028
      • Exhibit 87: Chart on China - Market size and forecast 2023-2028 ($ million)
      • Exhibit 88: Data Table on China - Market size and forecast 2023-2028 ($ million)
      • Exhibit 89: Chart on China - Year-over-year growth 2023-2028 (%)
      • Exhibit 90: Data Table on China - Year-over-year growth 2023-2028 (%)
    • 9.10 India - Market size and forecast 2023-2028
      • Exhibit 91: Chart on India - Market size and forecast 2023-2028 ($ million)
      • Exhibit 92: Data Table on India - Market size and forecast 2023-2028 ($ million)
      • Exhibit 93: Chart on India - Year-over-year growth 2023-2028 (%)
      • Exhibit 94: Data Table on India - Year-over-year growth 2023-2028 (%)
    • 9.11 Japan - Market size and forecast 2023-2028
      • Exhibit 95: Chart on Japan - Market size and forecast 2023-2028 ($ million)
      • Exhibit 96: Data Table on Japan - Market size and forecast 2023-2028 ($ million)
      • Exhibit 97: Chart on Japan - Year-over-year growth 2023-2028 (%)
      • Exhibit 98: Data Table on Japan - Year-over-year growth 2023-2028 (%)
    • 9.12 Germany - Market size and forecast 2023-2028
      • Exhibit 99: Chart on Germany - Market size and forecast 2023-2028 ($ million)
      • Exhibit 100: Data Table on Germany - Market size and forecast 2023-2028 ($ million)
      • Exhibit 101: Chart on Germany - Year-over-year growth 2023-2028 (%)
      • Exhibit 102: Data Table on Germany - Year-over-year growth 2023-2028 (%)
    • 9.13 Market opportunity by geography
      • Exhibit 103: Market opportunity by geography ($ million)
      • Exhibit 104: Data Tables on Market opportunity by geography ($ million)

    10 Drivers, Challenges, and Trends

    • 10.1 Market drivers
      • 10.2 Market challenges
        • 10.3 Impact of drivers and challenges
          • Exhibit 105: Impact of drivers and challenges in 2023 and 2028
        • 10.4 Market trends

          11 Vendor Landscape

          • 11.1 Overview
            • 11.2 Vendor landscape
              • Exhibit 106: Overview on Criticality of inputs and Factors of differentiation
            • 11.3 Landscape disruption
              • Exhibit 107: Overview on factors of disruption
            • 11.4 Industry risks
              • Exhibit 108: Impact of key risks on business

            12 Vendor Analysis

            • 12.1 Vendors covered
              • Exhibit 109: Vendors covered
            • 12.2 Market positioning of vendors
              • Exhibit 110: Matrix on vendor position and classification
            • 12.3 Brakes India Pvt. Ltd.
              • Exhibit 111: Brakes India Pvt. Ltd. - Overview
              • Exhibit 112: Brakes India Pvt. Ltd. - Product / Service
              • Exhibit 113: Brakes India Pvt. Ltd. - Key offerings
            • 12.4 CAMA Luoyang Electromechanic CO. LTD
              • Exhibit 114: CAMA Luoyang Electromechanic CO. LTD - Overview
              • Exhibit 115: CAMA Luoyang Electromechanic CO. LTD - Product / Service
              • Exhibit 116: CAMA Luoyang Electromechanic CO. LTD - Key offerings
            • 12.5 Cummins Inc.
              • Exhibit 117: Cummins Inc. - Overview
              • Exhibit 118: Cummins Inc. - Business segments
              • Exhibit 119: Cummins Inc. - Key offerings
              • Exhibit 120: Cummins Inc. - Segment focus
            • 12.6 Frenos Electricos Unidos SA
              • Exhibit 121: Frenos Electricos Unidos SA - Overview
              • Exhibit 122: Frenos Electricos Unidos SA - Product / Service
              • Exhibit 123: Frenos Electricos Unidos SA - Key offerings
            • 12.7 INDUSTRIAS ZELU SL
              • Exhibit 124: INDUSTRIAS ZELU SL - Overview
              • Exhibit 125: INDUSTRIAS ZELU SL - Product / Service
              • Exhibit 126: INDUSTRIAS ZELU SL - Key offerings
            • 12.8 KRISHNA CHEMICALS
              • Exhibit 127: KRISHNA CHEMICALS - Overview
              • Exhibit 128: KRISHNA CHEMICALS - Product / Service
              • Exhibit 129: KRISHNA CHEMICALS - Key offerings
            • 12.9 Nippon Steel Corp.
              • Exhibit 130: Nippon Steel Corp. - Overview
              • Exhibit 131: Nippon Steel Corp. - Business segments
              • Exhibit 132: Nippon Steel Corp. - Key offerings
              • Exhibit 133: Nippon Steel Corp. - Segment focus
            • 12.10 Regal Rexnord Corp.
              • Exhibit 134: Regal Rexnord Corp. - Overview
              • Exhibit 135: Regal Rexnord Corp. - Business segments
              • Exhibit 136: Regal Rexnord Corp. - Key offerings
              • Exhibit 137: Regal Rexnord Corp. - Segment focus
            • 12.11 Scania AB
              • Exhibit 138: Scania AB - Overview
              • Exhibit 139: Scania AB - Business segments
              • Exhibit 140: Scania AB - Key offerings
              • Exhibit 141: Scania AB - Segment focus
            • 12.12 Shandong Heavy Industry Group Co. Ltd.
              • Exhibit 142: Shandong Heavy Industry Group Co. Ltd. - Overview
              • Exhibit 143: Shandong Heavy Industry Group Co. Ltd. - Product / Service
              • Exhibit 144: Shandong Heavy Industry Group Co. Ltd. - Key offerings
            • 12.13 SORL Auto Parts Inc.
              • Exhibit 145: SORL Auto Parts Inc. - Overview
              • Exhibit 146: SORL Auto Parts Inc. - Product / Service
              • Exhibit 147: SORL Auto Parts Inc. - Key offerings
            • 12.14 TBK Co. Ltd.
              • Exhibit 148: TBK Co. Ltd. - Overview
              • Exhibit 149: TBK Co. Ltd. - Product / Service
              • Exhibit 150: TBK Co. Ltd. - Key offerings
            • 12.15 Telma SAS
              • Exhibit 151: Telma SAS - Overview
              • Exhibit 152: Telma SAS - Product / Service
              • Exhibit 153: Telma SAS - Key offerings
            • 12.16 Voith GmbH and Co. KGaA
              • Exhibit 154: Voith GmbH and Co. KGaA - Overview
              • Exhibit 155: Voith GmbH and Co. KGaA - Business segments
              • Exhibit 156: Voith GmbH and Co. KGaA - Key offerings
              • Exhibit 157: Voith GmbH and Co. KGaA - Segment focus
            • 12.17 ZF Friedrichshafen AG
              • Exhibit 158: ZF Friedrichshafen AG - Overview
              • Exhibit 159: ZF Friedrichshafen AG - Business segments
              • Exhibit 160: ZF Friedrichshafen AG - Key news
              • Exhibit 161: ZF Friedrichshafen AG - Key offerings
              • Exhibit 162: ZF Friedrichshafen AG - Segment focus

            13 Appendix

            • 13.1 Scope of the report
              • 13.2 Inclusions and exclusions checklist
                • Exhibit 163: Inclusions checklist
                • Exhibit 164: Exclusions checklist
              • 13.3 Currency conversion rates for US$
                • Exhibit 165: Currency conversion rates for US$
              • 13.4 Research methodology
                • Exhibit 166: Research methodology
                • Exhibit 167: Validation techniques employed for market sizing
                • Exhibit 168: Information sources
              • 13.5 List of abbreviations
                • Exhibit 169: List of abbreviations

              Research Methodology

              Technavio presents a detailed picture of the market by way of study, synthesis, and summation of data from multiple sources. The analysts have presented the various facets of the market with a particular focus on identifying the key industry influencers. The data thus presented is comprehensive, reliable, and the result of extensive research, both primary and secondary.

              INFORMATION SOURCES

              Primary sources

              • Manufacturers and suppliers
              • Channel partners
              • Industry experts
              • Strategic decision makers

              Secondary sources

              • Industry journals and periodicals
              • Government data
              • Financial reports of key industry players
              • Historical data
              • Press releases

              DATA ANALYSIS

              Data Synthesis

              • Collation of data
              • Estimation of key figures
              • Analysis of derived insights

              Data Validation

              • Triangulation with data models
              • Reference against proprietary databases
              • Corroboration with industry experts

              REPORT WRITING

              Qualitative

              • Market drivers
              • Market challenges
              • Market trends
              • Five forces analysis

              Quantitative

              • Market size and forecast
              • Market segmentation
              • Geographical insights
              • Competitive landscape

              Interested in this report?

              Get your sample now to see our research methodology and insights!

              Download Now

              Frequently Asked Questions

              Commercial Vehicle Retarder market growth will increase by $ 356.82 mn during 2024-2028.

              The Commercial Vehicle Retarder market is expected to grow at a CAGR of 4.4% during 2024-2028.

              Commercial Vehicle Retarder market is segmented by Product( Electromagnetic retarders, Hydraulic retarders, Other food) Type( Buses, Trucks, Europe, South America, Middle East and Africa)

              Brakes India Pvt. Ltd., CAMA Luoyang Electromechanic CO. LTD, Cummins Inc., Eaton Corp. Plc, Frenos Electricos Unidos SA, INDUSTRIAS ZELU SL, KRISHNA CHEMICALS, Nippon Steel Corp., Regal Rexnord Corp., Scania AB, Shandong Heavy Industry Group Co. Ltd., SORL Auto Parts Inc., TBK Co. Ltd., Telma SAS, Voith GmbH and Co. KGaA, ZF Friedrichshafen AG are a few of the key vendors in the Commercial Vehicle Retarder market.

              North America will register the highest growth rate of 45% among the other regions. Therefore, the Commercial Vehicle Retarder market in North America is expected to garner significant business opportunities for the vendors during the forecast period.

              US, China, India, Japan, Germany

              • Reduction in overall cost of installing commercial vehicle retardersA retarder slows down the wearing of the braking system in a vehicle. It reduces the effort of brakes and helps in controlling the vehicle effectively. Commercial vehicles are usually heavy is the driving factor this market.
              • and controlling such a vehicle is difficult. Thus is the driving factor this market.
              • retarders are used to overcome such difficulty. Retarders relieve the service brake and increase the active safety and cost-effectiveness of commercial vehicles. By using retarders is the driving factor this market.
              • it is possible to increase the life of brake lining 3-5 times is the driving factor this market.
              • thereby reducing the overall costs of the braking system. Considering the longevity of a commercial vehicle is the driving factor this market.
              • which comes close to 17 to 20 years is the driving factor this market.
              • the disc brake system provides the highest efficiency and helps in achieving the greatest stopping distance. However is the driving factor this market.
              • disc brakes are more expensive than traditional drum brakes. Disc brakes are highly used in the Americas and EMEA due to the stringent safety regulations set by government agencies. However is the driving factor this market.
              • in APAC is the driving factor this market.
              • drum brake systems are highly preferred by fleet managers and commercial vehicle owners. There are various modes through which a braking system is actuated. One such system is the electronic braking actuation system is the driving factor this market.
              • which needs an additional sensor to be installed in each wheel to monitor the position of the wheels while braking. Once the sensors are in place is the driving factor this market.
              • a high amount of precise calculation is needed through various other independent systems is the driving factor this market.
              • such as ECU is the driving factor this market.
              • which adds to the overall cost. If the sensors get damaged is the driving factor this market.
              • the replacement cost will build up to another $1 is the driving factor this market.
              • 000. The use of retarders will help in reducing these costs as they reduce the use of brakes is the driving factor this market.
              • which will also ensure the safety of the braking system. This will fuel the demand for retarders as these help in reducing the overall costs associated with commercial vehicles. These factors will drive the growth of the global commercial vehicle retarder market during the forecast period. is the driving factor this market.

              The Commercial Vehicle Retarder market vendors should focus on grabbing business opportunities from the Electromagnetic retarders segment as it accounted for the largest market share in the base year.