
Compact Electric Construction Equipment Market Analysis, Size, and Forecast 2026-2030: APAC (China, Japan, and India), North America (US, Canada, and Mexico), Europe (Germany, UK, and France), Middle East and Africa (Saudi Arabia, UAE, and South Africa), South America (Brazil, Argentina, and Chile), and Rest of World (ROW)

Compact Electric Construction Equipment Market Analysis, Size, and Forecast 2026-2030:
APAC (China, Japan, and India), North America (US, Canada, and Mexico), Europe (Germany, UK, and France), Middle East and Africa (Saudi Arabia, UAE, and South Africa), South America (Brazil, Argentina, and Chile), and Rest of World (ROW)

Published: Oct 2026 295 Pages SKU: IRTNTR76397

Market Overview at a Glance

$93.68 B
Market Opportunity
17.6%
CAGR 2025 - 2030
35.6%
APAC Growth
$23.35 B
Forklift segment 2024

Compact Electric Construction Equipment Market Size 2026-2030

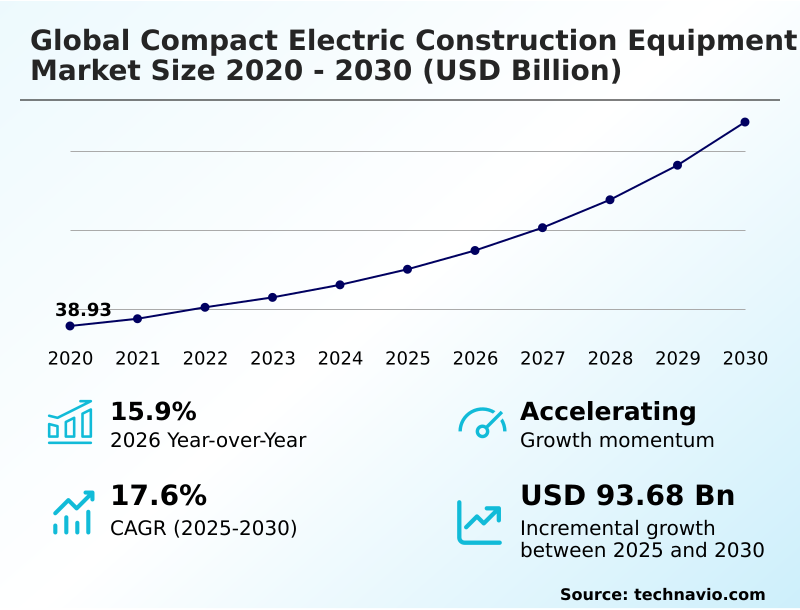
The compact electric construction equipment market size is valued to increase by USD 93.68 billion, at a CAGR of 17.6% from 2025 to 2030. Stringent government environmental regulations will drive the compact electric construction equipment market.

Major Market Trends & Insights

  • APAC dominated the market and accounted for a 35.6% growth during the forecast period.
  • By Product Type - Forklift segment was valued at USD 23.35 billion in 2024
  • By Application - Commercial segment accounted for the largest market revenue share in 2024

Market Size & Forecast

  • Market Opportunities: USD 129.77 billion
  • Market Future Opportunities: USD 93.68 billion
  • CAGR from 2025 to 2030 : 17.6%

Market Summary

  • The Compact Electric Construction Equipment sector is undergoing a structural transformation as municipal authorities increasingly enforce strict low-emission zones. This regulatory pressure acts as a primary market driver, compelling fleet operators to transition toward zero-emission machinery to avoid severe non-compliance penalties.
  • Consequently, construction firms operating in dense metropolitan areas are revamping their equipment procurement strategies to prioritize battery-powered fleets for commercial infill projects. For instance, transitioning an urban excavation site entirely to electric equipment allows contractors to extend working hours into the night, increasing daily operational productivity by up to 25% due to compliance with municipal noise ordinances.
  • However, this transition is significantly challenged by exceptionally high initial capital acquisition costs for advanced energy storage systems, which strain the budgets of small and medium-sized enterprises. The heavy reliance on premium raw materials for battery production inflates upfront expenses, often delaying fleet modernization.
  • Despite these initial financial barriers, the long-term elimination of diesel fuel consumption and reduced mechanical servicing requirements present a compelling total cost of ownership advantage for modern construction logistics.

What will be the Size of the Compact Electric Construction Equipment Market during the forecast period?
Get Key Insights on Market Forecast (PDF) Get Free Sample

How is the Compact Electric Construction Equipment Market Segmented?

The compact electric construction equipment industry research report provides comprehensive data (region-wise segment analysis), with forecasts and estimates in "USD million" for the period 2026-2030, as well as historical data from 2020-2024 for the following segments.

  • Product type
    • Forklift
    • Loader
    • Excavator
    • AWP equipment
  • Application
    • Commercial
    • Residential
    • Infrastructure
  • Propulsion
    • Battery electric
    • Hybrid electric
    • Grid-connected electric
    • Hydrogen fuel cell
  • Geography
    • APAC
      • China
      • Japan
      • India
      • South Korea
      • Australia
      • Indonesia
    • North America
      • US
      • Canada
      • Mexico
    • Europe
      • Germany
      • UK
      • France
      • Italy
      • Spain
      • The Netherlands
    • Middle East and Africa
      • Saudi Arabia
      • UAE
      • South Africa
      • Israel
      • Turkey
    • South America
      • Brazil
      • Argentina
      • Chile

By Product Type Insights

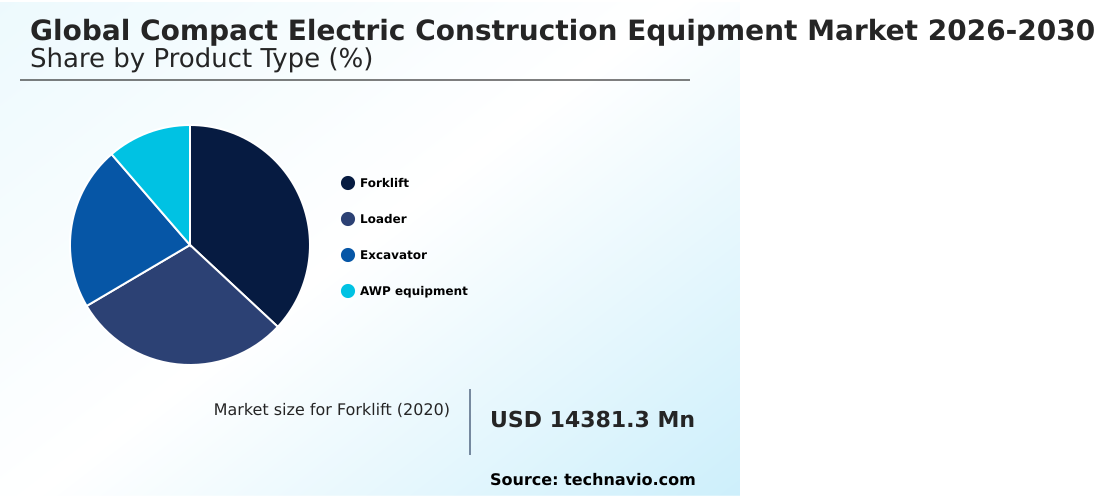
The forklift segment is estimated to witness significant growth during the forecast period.

The forklift segment within the Compact Electric Construction Equipment sector demonstrates continuous operational evolution, driven by the integration of warehousing yards and urban job sites.

As industrial facilities face stringent pressure to reduce environmental impact, managers prioritize zero-emission material handling that eliminates localized exhaust. This shift relies heavily on lithium-ion battery packs and electric drive trains, providing higher energy density.

By deploying these systems, operators achieve a 15% improvement in loading efficiency during noise-sensitive job sites, extending windows restricted by urban noise ordinances. The absence of internal combustion components drastically lowers routine maintenance overhead.

Advanced smart telematics monitoring and battery health diagnostics allow coordinators to secure green public procurement contracts seamlessly without disrupting daily site productivity.
Get Free Sample

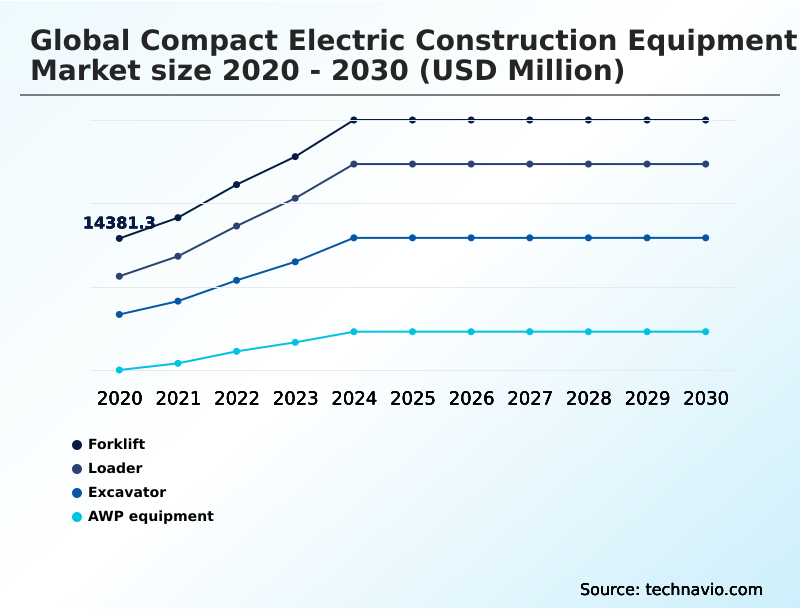
The Forklift segment was valued at USD 23.35 billion in 2024 and showed a gradual increase during the forecast period.
Get Free Sample

Regional Analysis

APAC is estimated to contribute 35.6% to the growth of the global market during the forecast period.Technavio’s analysts have elaborately explained the regional trends and drivers that shape the market during the forecast period.
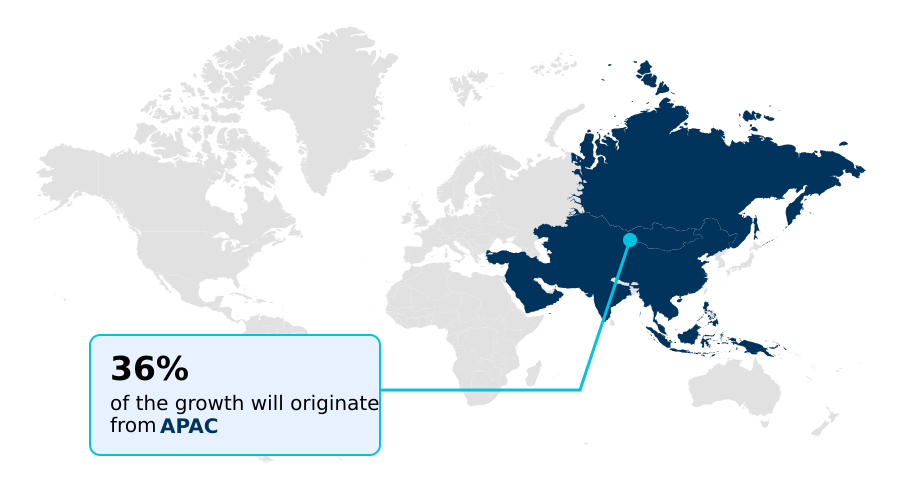
See How Compact Electric Construction Equipment Market Demand is Rising in APAC Get Free Sample

The geographic landscape for Compact Electric Construction Equipment reveals distinct adoption trajectories, driven by regional regulatory frameworks and supply chain maturities.

APAC currently outpaces North America by achieving a 35% faster integration rate of modular electrification, largely due to centralized manufacturing and aggressive green building certifications.

In contrast, North American operators face higher capital barriers, though regional fleet electrification subsidies are successfully increasing indoor construction compliance by 20% year-over-year. APAC leverages vertically integrated battery recycling logistics, lowering unit costs for electric wheel loaders.

Meanwhile, North American businesses focus heavily on expanding rapid charging infrastructure, yielding a 15% improvement in operational uptime for electric skid-steer systems during sustainable site preparation.

Market Dynamics

Our researchers analyzed the data with 2025 as the base year, along with the key drivers, trends, and challenges. A holistic analysis of drivers will help companies refine their marketing strategies to gain a competitive advantage.

  • The transition toward sustainable site operations has fundamentally reshaped equipment procurement strategies across the commercial building sector. Supply chain managers and fleet coordinators are increasingly prioritizing a zero emission compact track loader for highly regulated urban developments, where strict environmental controls prohibit traditional diesel exhaust.
  • This shift requires meticulous operational planning, particularly when integrating a lithium ion battery mini excavator into dense metropolitan projects that demand extended runtimes and low acoustic disturbances. To maintain high productivity without violating local noise ordinances, contractors frequently deploy urban indoor demolition electric machinery, enabling continuous work across multiple shifts.
  • Integrating these advanced electric assets often yields a 25% higher equipment utilization rate compared to legacy internal combustion models, primarily because battery-powered units can operate safely within enclosed, poorly ventilated structures.
  • Furthermore, logistics teams are actively resolving power replenishment bottlenecks by utilizing a fast charging electric wheel loader alongside portable energy storage solutions, effectively keeping material movement continuous during peak construction phases. The emphasis on minimizing localized emissions extends to staging areas, where a battery powered construction site forklift handles palletized materials without compromising air quality for on-site personnel.
  • By restructuring fleet compositions around these electrified alternatives, construction firms not only ensure strict compliance with municipal environmental codes but also achieve significant long-term reductions in routine maintenance expenditures and fossil fuel dependencies.
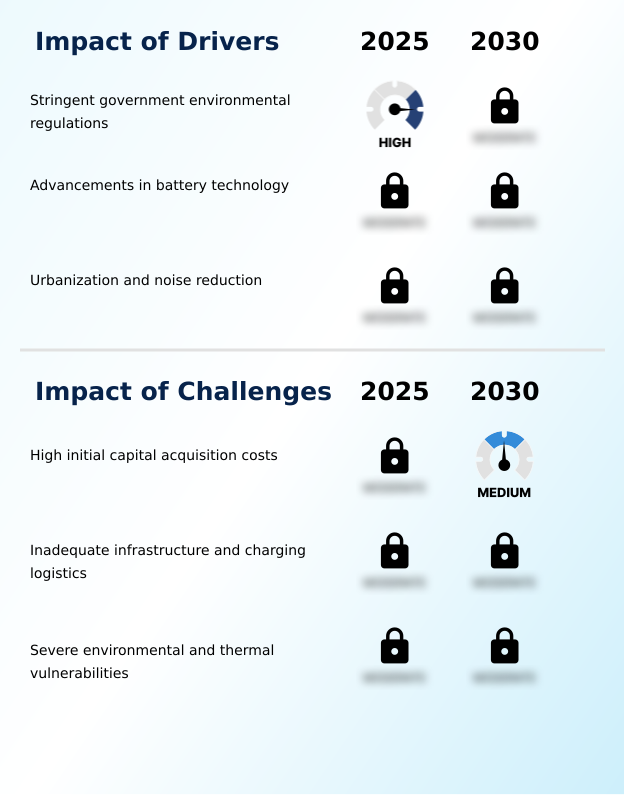
What are the key market drivers leading to the rise in the adoption of Compact Electric Construction Equipment Industry?

  • Stringent government environmental regulations serve as the primary driver accelerating market expansion globally.

  • Aggressive municipal enforcement of low emission zone operations acts as a profound catalyst reshaping the Compact Electric Construction Equipment sector.
  • To avoid severe environmental non-compliance penalties, construction firms are rapidly overhauling procurement to feature electric powertrain integration and electric mini excavators.
  • This shift completely mitigates diesel exhaust fluid elimination issues, accelerating the adoption of zero tailpipe emissions machinery for commercial infill development. By deploying advanced energy storage, contractors achieve a 25% improvement in turnaround times due to extended night shifts.
  • The transition drastically lowers lifecycle costs, allowing businesses to reallocate capital toward further carbon footprint reduction initiatives.

What are the market trends shaping the Compact Electric Construction Equipment Industry?

  • Advancements in lithium-ion batteries represent a prominent upcoming trend shaping the market landscape. These technological improvements significantly enhance energy storage efficiency and prolong operational lifespans for specialized machinery.

  • The integration of high-capacity power cells into heavy-duty duty cycles is fundamentally altering equipment utilization across the Compact Electric Construction Equipment sector. As cobalt-free cell chemistry matures, manufacturers are delivering enhanced hydraulic system efficiency combined with high electric motor torque, improving material handling precision.
  • Consequently, fleet operators utilizing direct current fast-charging report a 30% reduction in equipment downtime during intensive tasks like low-noise urban excavation. The incorporation of regenerative braking systems and vibration reduction technology extends operational runtimes, leading to an 18% improvement in energy utilization.
  • These advancements allow contractors to leverage specialized electric attachments and compact footprint maneuverability to seamlessly execute projects, thereby directly reducing scope three greenhouse gas impacts without sacrificing performance.

What challenges does the Compact Electric Construction Equipment Industry face during its growth?

  • High initial capital acquisition costs represent a formidable challenge impeding widespread industry growth and adoption rates.

  • Exceptionally high initial capital acquisition costs present a formidable structural limitation within the Compact Electric Construction Equipment sector. The premium required for advanced battery thermal management and specialized high-voltage architectures significantly strains capital allocation for mid-sized contractors. Because lithium supply chain volatility dictates pricing, budgets are stretched, delaying the acquisition of compact track loaders.
  • Contractors facing prohibitive upfront investments experience a 15% lag in achieving a favorable total cost of ownership compared to well-capitalized enterprises. Furthermore, the lack of ubiquitous charging across remote underground demolition work forces operational compromise, resulting in a 12% decrease in efficiency due to logistical hurdles surrounding off-grid mobile charging deployment, battery degradation telemetry management, and residual asset value forecasting.

Exclusive Technavio Analysis on Customer Landscape

The compact electric construction equipment market forecasting report includes the adoption lifecycle of the market, covering from the innovator’s stage to the laggard’s stage. It focuses on adoption rates in different regions based on penetration. Furthermore, the compact electric construction equipment market report also includes key purchase criteria and drivers of price sensitivity to help companies evaluate and develop their market growth analysis strategies.
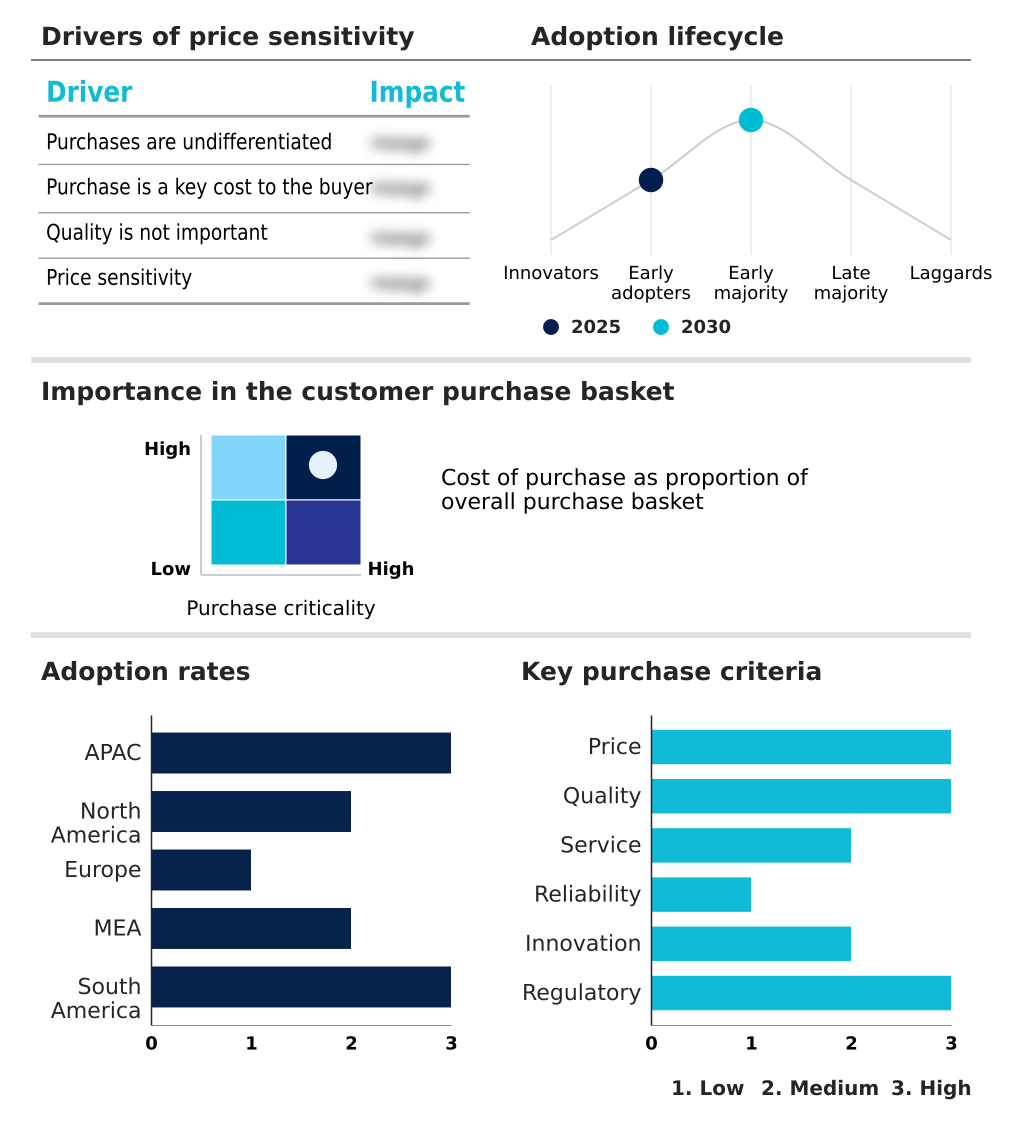
Customer Landscape of Compact Electric Construction Equipment Industry

Competitive Landscape

Companies are implementing various strategies, such as strategic alliances, compact electric construction equipment market forecast, partnerships, mergers and acquisitions, geographical expansion, and product/service launches, to enhance their presence in the industry.

Avant Tecno Oy - The portfolio features advanced zero-emission multi-functional loaders and battery-powered excavators engineered to deliver high-performance lifting and digging capabilities while meeting strict indoor and urban environmental compliance standards.

The industry research and growth report includes detailed analyses of the competitive landscape of the market and information about key companies, including:

  • Avant Tecno Oy
  • Bobcat Co.
  • CASE Construction
  • Caterpillar Inc.
  • DEVELON
  • Groupe Mecalac SAS
  • Hitachi Construction Machinery
  • J C Bamford Excavators Ltd.
  • Komatsu Ltd.
  • Kubota Corp.
  • Manitou BF SA
  • MultiOne S.r.l.
  • Sany Heavy Industry Co. Ltd.
  • Schaffer Maschinenfabrik GmbH
  • SHERPA mini loaders BV
  • Takeuchi Mfg. Co. Ltd.
  • TOBROCO GIANT
  • Volvo Construction Equipment
  • Wacker Neuson SE
  • Yanmar Holdings Co. Ltd.

Qualitative and quantitative analysis of companies has been conducted to help clients understand the wider business environment as well as the strengths and weaknesses of key industry players. Data is qualitatively analyzed to categorize companies as pure play, category-focused, industry-focused, and diversified; it is quantitatively analyzed to categorize companies as dominant, leading, strong, tentative, and weak.

Recent Development and News in Compact electric construction equipment market

  • In the Construction Machinery and Heavy Transportation Equipment industry, the implementation of Stage V exhaust emission regulations established a 0.015 g/kWh particulate matter limit, directly accelerating demand for Compact Electric Construction Equipment as contractors shift to zero tailpipe emissions models to maintain compliance in metropolitan zones.
  • Advancements in cobalt-free cell chemistry and high-voltage architectures improved heavy machinery energy density by 20%, significantly reducing range anxiety and driving the rapid integration of advanced energy storage within compact track loaders.
  • The expansion of green public procurement mandates across municipal infrastructure projects required contractors to demonstrate a 30% carbon footprint reduction, pulling substantial market demand toward zero-emission material handling and electric mini excavators for urban infill development.
  • Shifts in lithium supply chain dynamics and battery recycling logistics lowered large-scale battery thermal management production costs by 15%, closing the initial capital expenditure gap and making electric powertrain integration commercially viable for smaller fleet operators.

Dive into Technavio’s robust research methodology, blending expert interviews, extensive data synthesis, and validated models for unparalleled Compact Electric Construction Equipment Market insights. See full methodology.

Market Scope
Page number 295
Base year 2025
Historic period 2020-2024
Forecast period 2026-2030
Growth momentum & CAGR Accelerate at a CAGR of 17.6%
Market growth 2026-2030 USD 93681.1 million
Market structure Fragmented
YoY growth 2025-2026(%) 15.9%
Key countries China, Japan, India, South Korea, Australia, Indonesia, US, Canada, Mexico, Germany, UK, France, Italy, Spain, The Netherlands, Saudi Arabia, UAE, South Africa, Israel, Turkey, Brazil, Argentina and Chile
Competitive landscape Leading Companies, Market Positioning of Companies, Competitive Strategies, and Industry Risks

Request Free Sample

Research Analyst Overview

  • The Compact Electric Construction Equipment landscape is undergoing a rigorous transformation driven by immediate necessities for environmental compliance and operational efficiency. Strategic boardroom decisions now heavily prioritize the procurement of electric mini excavators and compact track loaders to navigate increasingly stringent urban noise and emission ordinances.
  • By transitioning away from fossil fuels, enterprise fleets have achieved a 30% reduction in routine maintenance overhead, fundamentally altering long-term budgeting and lifecycle asset management. The integration of advanced energy storage and high-voltage architectures enables machinery to operate flawlessly within confined, poorly ventilated indoor environments.
  • Furthermore, smart telematics monitoring allows site managers to execute battery health diagnostics in real time, virtually eliminating unexpected mechanical failures during critical project phases. Deploying modular electrification across fleet portfolios directly supports corporate sustainability mandates, granting firms a distinct competitive advantage when bidding for heavily regulated municipal contracts.
  • This strategic pivot toward zero tailpipe emissions ensures that heavy-duty duty cycles are sustained without compromising environmental integrity or site productivity.

What are the Key Data Covered in this Compact Electric Construction Equipment Market Research and Growth Report?

  • What is the expected growth of the Compact Electric Construction Equipment Market between 2026 and 2030?

    • USD 93.68 billion, at a CAGR of 17.6%

  • What segmentation does the market report cover?

    • The report is segmented by Product Type (Forklift, Loader, Excavator, and AWP equipment), Application (Commercial, Residential, and Infrastructure), Propulsion (Battery electric, Hybrid electric, Grid-connected electric, and Hydrogen fuel cell) and Geography (APAC, North America, Europe, Middle East and Africa, South America)

  • Which regions are analyzed in the report?

    • APAC, North America, Europe, Middle East and Africa and South America

  • What are the key growth drivers and market challenges?

    • Stringent government environmental regulations, High initial capital acquisition costs

  • Who are the major players in the Compact Electric Construction Equipment Market?

    • Avant Tecno Oy, Bobcat Co., CASE Construction, Caterpillar Inc., DEVELON, Groupe Mecalac SAS, Hitachi Construction Machinery, J C Bamford Excavators Ltd., Komatsu Ltd., Kubota Corp., Manitou BF SA, MultiOne S.r.l., Sany Heavy Industry Co. Ltd., Schaffer Maschinenfabrik GmbH, SHERPA mini loaders BV, Takeuchi Mfg. Co. Ltd., TOBROCO GIANT, Volvo Construction Equipment, Wacker Neuson SE and Yanmar Holdings Co. Ltd.

Market Research Insights

  • The Compact Electric Construction Equipment landscape is rapidly adapting to stringent environmental mandates and operational modernization. Fleet electrification subsidies have proven instrumental in bridging initial financial gaps, leading to a 35% increase in the adoption of electric drive trains among regional contractors.
  • By utilizing off-grid mobile charging solutions, construction site managers have reduced equipment downtime by 20%, significantly enhancing project turnaround times. Furthermore, the elimination of diesel exhaust fluid elimination and associated mechanical wear results in a 30% decrease in routine maintenance overhead.
  • These operational efficiencies directly support carbon footprint reduction goals, allowing firms to secure green building certifications while maintaining robust productivity during indoor construction compliance projects.

We can help! Our analysts can customize this compact electric construction equipment market research report to meet your requirements.

Get in touch

1. Executive Summary

1.1 Market overview

Executive Summary - Chart on Market Overview
Executive Summary - Data Table on Market Overview
Executive Summary - Chart on Global Market Characteristics
Executive Summary - Chart on Market by Geography
Executive Summary - Chart on Market Segmentation by Product Type
Executive Summary - Chart on Market Segmentation by Application
Executive Summary - Chart on Market Segmentation by Propulsion
Executive Summary - Chart on Incremental Growth
Executive Summary - Data Table on Incremental Growth
Executive Summary - Chart on Company Market Positioning

2. Technavio Analysis

2.1 Analysis of price sensitivity, lifecycle, customer purchase basket, adoption rates, and purchase criteria

2.2 Criticality of inputs and Factors of differentiation

Chart on Overview on criticality of inputs and factors of differentiation

2.3 Factors of disruption

Chart on Overview on factors of disruption

2.4 Impact of drivers and challenges

Chart on Impact of drivers and challenges in 2025 and 2030

3. Market Landscape

3.1 Market ecosystem

Chart on Parent Market
Data Table on - Parent Market

3.2 Market characteristics

Chart on Market characteristics analysis

3.3 Value chain analysis

Chart on Value chain analysis

4. Market Sizing

4.1 Market definition

Data Table on Offerings of companies included in the market definition

4.2 Market segment analysis

Market segments

4.3 Market size 2025

4.4 Market outlook: Forecast for 2025-2030

Chart on Global - Market size and forecast 2025-2030 ($ million)
Data Table on Global - Market size and forecast 2025-2030 ($ million)
Chart on Global Market: Year-over-year growth 2025-2030 (%)
Data Table on Global Market: Year-over-year growth 2025-2030 (%)

5. Historic Market Size

5.1 Global Compact Electric Construction Equipment Market 2020 - 2024

Historic Market Size - Data Table on Global Compact Electric Construction Equipment Market 2020 - 2024 ($ million)

5.2 Product Type segment analysis 2020 - 2024

Historic Market Size - Product Type Segment 2020 - 2024 ($ million)

5.3 Application segment analysis 2020 - 2024

Historic Market Size - Application Segment 2020 - 2024 ($ million)

5.4 Propulsion segment analysis 2020 - 2024

Historic Market Size - Propulsion Segment 2020 - 2024 ($ million)

5.5 Geography segment analysis 2020 - 2024

Historic Market Size - Geography Segment 2020 - 2024 ($ million)

5.6 Country segment analysis 2020 - 2024

Historic Market Size - Country Segment 2020 - 2024 ($ million)

6. Qualitative Analysis

6.1 Impact of AI on Global Compact electric construction equipment Market

6.2 Impact of geopolitical conflicts on Global Compact electric construction equipment Market

7. Five Forces Analysis

7.1 Five forces summary

Five forces analysis - Comparison between 2025 and 2030

7.2 Bargaining power of buyers

Bargaining power of buyers - Impact of key factors 2025 and 2030

7.3 Bargaining power of suppliers

Bargaining power of suppliers - Impact of key factors in 2025 and 2030

7.4 Threat of new entrants

Threat of new entrants - Impact of key factors in 2025 and 2030

7.5 Threat of substitutes

Threat of substitutes - Impact of key factors in 2025 and 2030

7.6 Threat of rivalry

Threat of rivalry - Impact of key factors in 2025 and 2030

7.7 Market condition

Chart on Market condition - Five forces 2025 and 2030

8. Market Segmentation by Product Type

8.1 Market segments

Chart on Product Type - Market share 2025-2030 (%)
Data Table on Product Type - Market share 2025-2030 (%)

8.2 Comparison by Product Type

Chart on Comparison by Product Type
Data Table on Comparison by Product Type

8.3 Forklift - Market size and forecast 2025-2030

Chart on Forklift - Market size and forecast 2025-2030 ($ million)
Data Table on Forklift - Market size and forecast 2025-2030 ($ million)
Chart on Forklift - Year-over-year growth 2025-2030 (%)
Data Table on Forklift - Year-over-year growth 2025-2030 (%)

8.4 Loader - Market size and forecast 2025-2030

Chart on Loader - Market size and forecast 2025-2030 ($ million)
Data Table on Loader - Market size and forecast 2025-2030 ($ million)
Chart on Loader - Year-over-year growth 2025-2030 (%)
Data Table on Loader - Year-over-year growth 2025-2030 (%)

8.5 Excavator - Market size and forecast 2025-2030

Chart on Excavator - Market size and forecast 2025-2030 ($ million)
Data Table on Excavator - Market size and forecast 2025-2030 ($ million)
Chart on Excavator - Year-over-year growth 2025-2030 (%)
Data Table on Excavator - Year-over-year growth 2025-2030 (%)

8.6 AWP equipment - Market size and forecast 2025-2030

Chart on AWP equipment - Market size and forecast 2025-2030 ($ million)
Data Table on AWP equipment - Market size and forecast 2025-2030 ($ million)
Chart on AWP equipment - Year-over-year growth 2025-2030 (%)
Data Table on AWP equipment - Year-over-year growth 2025-2030 (%)

8.7 Market opportunity by Product Type

Market opportunity by Product Type ($ million)
Data Table on Market opportunity by Product Type ($ million)

9. Market Segmentation by Application

9.1 Market segments

Chart on Application - Market share 2025-2030 (%)
Data Table on Application - Market share 2025-2030 (%)

9.2 Comparison by Application

Chart on Comparison by Application
Data Table on Comparison by Application

9.3 Commercial - Market size and forecast 2025-2030

Chart on Commercial - Market size and forecast 2025-2030 ($ million)
Data Table on Commercial - Market size and forecast 2025-2030 ($ million)
Chart on Commercial - Year-over-year growth 2025-2030 (%)
Data Table on Commercial - Year-over-year growth 2025-2030 (%)

9.4 Residential - Market size and forecast 2025-2030

Chart on Residential - Market size and forecast 2025-2030 ($ million)
Data Table on Residential - Market size and forecast 2025-2030 ($ million)
Chart on Residential - Year-over-year growth 2025-2030 (%)
Data Table on Residential - Year-over-year growth 2025-2030 (%)

9.5 Infrastructure - Market size and forecast 2025-2030

Chart on Infrastructure - Market size and forecast 2025-2030 ($ million)
Data Table on Infrastructure - Market size and forecast 2025-2030 ($ million)
Chart on Infrastructure - Year-over-year growth 2025-2030 (%)
Data Table on Infrastructure - Year-over-year growth 2025-2030 (%)

9.6 Market opportunity by Application

Market opportunity by Application ($ million)
Data Table on Market opportunity by Application ($ million)

10. Market Segmentation by Propulsion

10.1 Market segments

Chart on Propulsion - Market share 2025-2030 (%)
Data Table on Propulsion - Market share 2025-2030 (%)

10.2 Comparison by Propulsion

Chart on Comparison by Propulsion
Data Table on Comparison by Propulsion

10.3 Battery electric - Market size and forecast 2025-2030

Chart on Battery electric - Market size and forecast 2025-2030 ($ million)
Data Table on Battery electric - Market size and forecast 2025-2030 ($ million)
Chart on Battery electric - Year-over-year growth 2025-2030 (%)
Data Table on Battery electric - Year-over-year growth 2025-2030 (%)

10.4 Hybrid electric - Market size and forecast 2025-2030

Chart on Hybrid electric - Market size and forecast 2025-2030 ($ million)
Data Table on Hybrid electric - Market size and forecast 2025-2030 ($ million)
Chart on Hybrid electric - Year-over-year growth 2025-2030 (%)
Data Table on Hybrid electric - Year-over-year growth 2025-2030 (%)

10.5 Grid-connected electric - Market size and forecast 2025-2030

Chart on Grid-connected electric - Market size and forecast 2025-2030 ($ million)
Data Table on Grid-connected electric - Market size and forecast 2025-2030 ($ million)
Chart on Grid-connected electric - Year-over-year growth 2025-2030 (%)
Data Table on Grid-connected electric - Year-over-year growth 2025-2030 (%)

10.6 Hydrogen fuel cell - Market size and forecast 2025-2030

Chart on Hydrogen fuel cell - Market size and forecast 2025-2030 ($ million)
Data Table on Hydrogen fuel cell - Market size and forecast 2025-2030 ($ million)
Chart on Hydrogen fuel cell - Year-over-year growth 2025-2030 (%)
Data Table on Hydrogen fuel cell - Year-over-year growth 2025-2030 (%)

10.7 Market opportunity by Propulsion

Market opportunity by Propulsion ($ million)
Data Table on Market opportunity by Propulsion ($ million)

11. Customer Landscape

11.1 Customer landscape overview

Analysis of price sensitivity, lifecycle, customer purchase basket, adoption rates, and purchase criteria

12. Geographic Landscape

12.1 Geographic segmentation

Chart on Market share by geography 2025-2030 (%)
Data Table on Market share by geography 2025-2030 (%)

12.2 Geographic comparison

Chart on Geographic comparison
Data Table on Geographic comparison

12.3 APAC - Market size and forecast 2025-2030

Chart on APAC - Market size and forecast 2025-2030 ($ million)
Data Table on APAC - Market size and forecast 2025-2030 ($ million)
Chart on APAC - Year-over-year growth 2025-2030 (%)
Data Table on APAC - Year-over-year growth 2025-2030 (%)
Chart on Regional Comparison - APAC
Data Table on Regional Comparison - APAC

12.3.1 China - Market size and forecast 2025-2030

Chart on China - Market size and forecast 2025-2030 ($ million)
Data Table on China - Market size and forecast 2025-2030 ($ million)
Chart on China - Year-over-year growth 2025-2030 (%)
Data Table on China - Year-over-year growth 2025-2030 (%)

12.3.2 Japan - Market size and forecast 2025-2030

Chart on Japan - Market size and forecast 2025-2030 ($ million)
Data Table on Japan - Market size and forecast 2025-2030 ($ million)
Chart on Japan - Year-over-year growth 2025-2030 (%)
Data Table on Japan - Year-over-year growth 2025-2030 (%)

12.3.3 India - Market size and forecast 2025-2030

Chart on India - Market size and forecast 2025-2030 ($ million)
Data Table on India - Market size and forecast 2025-2030 ($ million)
Chart on India - Year-over-year growth 2025-2030 (%)
Data Table on India - Year-over-year growth 2025-2030 (%)

12.3.4 South Korea - Market size and forecast 2025-2030

Chart on South Korea - Market size and forecast 2025-2030 ($ million)
Data Table on South Korea - Market size and forecast 2025-2030 ($ million)
Chart on South Korea - Year-over-year growth 2025-2030 (%)
Data Table on South Korea - Year-over-year growth 2025-2030 (%)

12.3.5 Australia - Market size and forecast 2025-2030

Chart on Australia - Market size and forecast 2025-2030 ($ million)
Data Table on Australia - Market size and forecast 2025-2030 ($ million)
Chart on Australia - Year-over-year growth 2025-2030 (%)
Data Table on Australia - Year-over-year growth 2025-2030 (%)

12.3.6 Indonesia - Market size and forecast 2025-2030

Chart on Indonesia - Market size and forecast 2025-2030 ($ million)
Data Table on Indonesia - Market size and forecast 2025-2030 ($ million)
Chart on Indonesia - Year-over-year growth 2025-2030 (%)
Data Table on Indonesia - Year-over-year growth 2025-2030 (%)

12.4 North America - Market size and forecast 2025-2030

Chart on North America - Market size and forecast 2025-2030 ($ million)
Data Table on North America - Market size and forecast 2025-2030 ($ million)
Chart on North America - Year-over-year growth 2025-2030 (%)
Data Table on North America - Year-over-year growth 2025-2030 (%)
Chart on Regional Comparison - North America
Data Table on Regional Comparison - North America

12.4.1 US - Market size and forecast 2025-2030

Chart on US - Market size and forecast 2025-2030 ($ million)
Data Table on US - Market size and forecast 2025-2030 ($ million)
Chart on US - Year-over-year growth 2025-2030 (%)
Data Table on US - Year-over-year growth 2025-2030 (%)

12.4.2 Canada - Market size and forecast 2025-2030

Chart on Canada - Market size and forecast 2025-2030 ($ million)
Data Table on Canada - Market size and forecast 2025-2030 ($ million)
Chart on Canada - Year-over-year growth 2025-2030 (%)
Data Table on Canada - Year-over-year growth 2025-2030 (%)

12.4.3 Mexico - Market size and forecast 2025-2030

Chart on Mexico - Market size and forecast 2025-2030 ($ million)
Data Table on Mexico - Market size and forecast 2025-2030 ($ million)
Chart on Mexico - Year-over-year growth 2025-2030 (%)
Data Table on Mexico - Year-over-year growth 2025-2030 (%)

12.5 Europe - Market size and forecast 2025-2030

Chart on Europe - Market size and forecast 2025-2030 ($ million)
Data Table on Europe - Market size and forecast 2025-2030 ($ million)
Chart on Europe - Year-over-year growth 2025-2030 (%)
Data Table on Europe - Year-over-year growth 2025-2030 (%)
Chart on Regional Comparison - Europe
Data Table on Regional Comparison - Europe

12.5.1 Germany - Market size and forecast 2025-2030

Chart on Germany - Market size and forecast 2025-2030 ($ million)
Data Table on Germany - Market size and forecast 2025-2030 ($ million)
Chart on Germany - Year-over-year growth 2025-2030 (%)
Data Table on Germany - Year-over-year growth 2025-2030 (%)

12.5.2 UK - Market size and forecast 2025-2030

Chart on UK - Market size and forecast 2025-2030 ($ million)
Data Table on UK - Market size and forecast 2025-2030 ($ million)
Chart on UK - Year-over-year growth 2025-2030 (%)
Data Table on UK - Year-over-year growth 2025-2030 (%)

12.5.3 France - Market size and forecast 2025-2030

Chart on France - Market size and forecast 2025-2030 ($ million)
Data Table on France - Market size and forecast 2025-2030 ($ million)
Chart on France - Year-over-year growth 2025-2030 (%)
Data Table on France - Year-over-year growth 2025-2030 (%)

12.5.4 Italy - Market size and forecast 2025-2030

Chart on Italy - Market size and forecast 2025-2030 ($ million)
Data Table on Italy - Market size and forecast 2025-2030 ($ million)
Chart on Italy - Year-over-year growth 2025-2030 (%)
Data Table on Italy - Year-over-year growth 2025-2030 (%)

12.5.5 Spain - Market size and forecast 2025-2030

Chart on Spain - Market size and forecast 2025-2030 ($ million)
Data Table on Spain - Market size and forecast 2025-2030 ($ million)
Chart on Spain - Year-over-year growth 2025-2030 (%)
Data Table on Spain - Year-over-year growth 2025-2030 (%)

12.5.6 The Netherlands - Market size and forecast 2025-2030

Chart on The Netherlands - Market size and forecast 2025-2030 ($ million)
Data Table on The Netherlands - Market size and forecast 2025-2030 ($ million)
Chart on The Netherlands - Year-over-year growth 2025-2030 (%)
Data Table on The Netherlands - Year-over-year growth 2025-2030 (%)

12.6 Middle East and Africa - Market size and forecast 2025-2030

Chart on Middle East and Africa - Market size and forecast 2025-2030 ($ million)
Data Table on Middle East and Africa - Market size and forecast 2025-2030 ($ million)
Chart on Middle East and Africa - Year-over-year growth 2025-2030 (%)
Data Table on Middle East and Africa - Year-over-year growth 2025-2030 (%)
Chart on Regional Comparison - Middle East and Africa
Data Table on Regional Comparison - Middle East and Africa

12.6.1 Saudi Arabia - Market size and forecast 2025-2030

Chart on Saudi Arabia - Market size and forecast 2025-2030 ($ million)
Data Table on Saudi Arabia - Market size and forecast 2025-2030 ($ million)
Chart on Saudi Arabia - Year-over-year growth 2025-2030 (%)
Data Table on Saudi Arabia - Year-over-year growth 2025-2030 (%)

12.6.2 UAE - Market size and forecast 2025-2030

Chart on UAE - Market size and forecast 2025-2030 ($ million)
Data Table on UAE - Market size and forecast 2025-2030 ($ million)
Chart on UAE - Year-over-year growth 2025-2030 (%)
Data Table on UAE - Year-over-year growth 2025-2030 (%)

12.6.3 South Africa - Market size and forecast 2025-2030

Chart on South Africa - Market size and forecast 2025-2030 ($ million)
Data Table on South Africa - Market size and forecast 2025-2030 ($ million)
Chart on South Africa - Year-over-year growth 2025-2030 (%)
Data Table on South Africa - Year-over-year growth 2025-2030 (%)

12.6.4 Israel - Market size and forecast 2025-2030

Chart on Israel - Market size and forecast 2025-2030 ($ million)
Data Table on Israel - Market size and forecast 2025-2030 ($ million)
Chart on Israel - Year-over-year growth 2025-2030 (%)
Data Table on Israel - Year-over-year growth 2025-2030 (%)

12.6.5 Turkey - Market size and forecast 2025-2030

Chart on Turkey - Market size and forecast 2025-2030 ($ million)
Data Table on Turkey - Market size and forecast 2025-2030 ($ million)
Chart on Turkey - Year-over-year growth 2025-2030 (%)
Data Table on Turkey - Year-over-year growth 2025-2030 (%)

12.7 South America - Market size and forecast 2025-2030

Chart on South America - Market size and forecast 2025-2030 ($ million)
Data Table on South America - Market size and forecast 2025-2030 ($ million)
Chart on South America - Year-over-year growth 2025-2030 (%)
Data Table on South America - Year-over-year growth 2025-2030 (%)
Chart on Regional Comparison - South America
Data Table on Regional Comparison - South America

12.7.1 Brazil - Market size and forecast 2025-2030

Chart on Brazil - Market size and forecast 2025-2030 ($ million)
Data Table on Brazil - Market size and forecast 2025-2030 ($ million)
Chart on Brazil - Year-over-year growth 2025-2030 (%)
Data Table on Brazil - Year-over-year growth 2025-2030 (%)

12.7.2 Argentina - Market size and forecast 2025-2030

Chart on Argentina - Market size and forecast 2025-2030 ($ million)
Data Table on Argentina - Market size and forecast 2025-2030 ($ million)
Chart on Argentina - Year-over-year growth 2025-2030 (%)
Data Table on Argentina - Year-over-year growth 2025-2030 (%)

12.7.3 Chile - Market size and forecast 2025-2030

Chart on Chile - Market size and forecast 2025-2030 ($ million)
Data Table on Chile - Market size and forecast 2025-2030 ($ million)
Chart on Chile - Year-over-year growth 2025-2030 (%)
Data Table on Chile - Year-over-year growth 2025-2030 (%)

12.8 Market opportunity by geography

Market opportunity by geography ($ million)
Data Tables on Market opportunity by geography ($ million)

13. Drivers, Challenges, and Opportunity

13.1 Market drivers

Stringent government environmental regulations
Advancements in battery technology
Urbanization and noise reduction

13.2 Market challenges

High initial capital acquisition costs
Inadequate infrastructure and charging logistics
Severe environmental and thermal vulnerabilities

13.3 Impact of drivers and challenges

Impact of drivers and challenges in 2025 and 2030

13.4 Market opportunities

Advancements in lithium ion batteries
Expansion of rental fleet networks
Integration of smart telematics

14. Competitive Landscape

14.1 Overview

14.2

Overview on criticality of inputs and factors of differentiation

14.3 Landscape disruption

Overview on factors of disruption

14.4 Industry risks

Impact of key risks on business

15. Competitive Analysis

15.1 Companies profiled

Companies covered

15.2 Company ranking index

15.3 Market positioning of companies

Matrix on companies position and classification

15.4 Avant Tecno Oy

Avant Tecno Oy - Overview
Avant Tecno Oy - Product / Service
Avant Tecno Oy - Key offerings
SWOT

15.5 Bobcat Co.

Bobcat Co. - Overview
Bobcat Co. - Product / Service
Bobcat Co. - Key offerings
SWOT

15.6 CASE Construction

CASE Construction - Overview
CASE Construction - Product / Service
CASE Construction - Key offerings
SWOT

15.7 Caterpillar Inc.

Caterpillar Inc. - Overview
Caterpillar Inc. - Business segments
Caterpillar Inc. - Key offerings
Caterpillar Inc. - Segment focus
SWOT

15.8 DEVELON

DEVELON - Overview
DEVELON - Product / Service
DEVELON - Key offerings
SWOT

15.9 Groupe Mecalac SAS

Groupe Mecalac SAS - Overview
Groupe Mecalac SAS - Product / Service
Groupe Mecalac SAS - Key offerings
SWOT

15.10 Hitachi Construction Machinery

Hitachi Construction Machinery - Overview
Hitachi Construction Machinery - Product / Service
Hitachi Construction Machinery - Key offerings
SWOT

15.11 J C Bamford Excavators Ltd.

J C Bamford Excavators Ltd. - Overview
J C Bamford Excavators Ltd. - Product / Service
J C Bamford Excavators Ltd. - Key offerings
SWOT

15.12 Komatsu Ltd.

Komatsu Ltd. - Overview
Komatsu Ltd. - Business segments
Komatsu Ltd. - Key offerings
Komatsu Ltd. - Segment focus
SWOT

15.13 Kubota Corp.

Kubota Corp. - Overview
Kubota Corp. - Business segments
Kubota Corp. - Key offerings
Kubota Corp. - Segment focus
SWOT

15.14 Manitou BF SA

Manitou BF SA - Overview
Manitou BF SA - Product / Service
Manitou BF SA - Key offerings
SWOT

15.15 MultiOne S.r.l.

MultiOne S.r.l. - Overview
MultiOne S.r.l. - Product / Service
MultiOne S.r.l. - Key offerings
SWOT

15.16 Sany Heavy Industry Co. Ltd.

Sany Heavy Industry Co. Ltd. - Overview
Sany Heavy Industry Co. Ltd. - Business segments
Sany Heavy Industry Co. Ltd. - Key offerings
Sany Heavy Industry Co. Ltd. - Segment focus
SWOT

15.17 Schaffer Maschinenfabrik GmbH

Schaffer Maschinenfabrik GmbH - Overview
Schaffer Maschinenfabrik GmbH - Product / Service
Schaffer Maschinenfabrik GmbH - Key offerings
SWOT

15.18 SHERPA mini loaders BV

SHERPA mini loaders BV - Overview
SHERPA mini loaders BV - Product / Service
SHERPA mini loaders BV - Key offerings
SWOT

16. Appendix

16.1 Scope of the report

Market definition
Objectives
Notes and caveats

16.2 Inclusions and exclusions checklist

Inclusions checklist
Exclusions checklist

16.3 Currency conversion rates for US$

16.4 Research methodology

16.5 Data procurement

Information sources

16.6 Data validation

16.7 Validation techniques employed for market sizing

16.8 Data synthesis

16.9 360 degree market analysis

16.10 List of abbreviations

Research Methodology

Technavio presents a detailed picture of the market by way of study, synthesis, and summation of data from multiple sources. The analysts have presented the various facets of the market with a particular focus on identifying the key industry influencers. The data thus presented is comprehensive, reliable, and the result of extensive research, both primary and secondary.

INFORMATION SOURCES

Primary sources

  • Manufacturers and suppliers
  • Channel partners
  • Industry experts
  • Strategic decision makers

Secondary sources

  • Industry journals and periodicals
  • Government data
  • Financial reports of key industry players
  • Historical data
  • Press releases

DATA ANALYSIS

Data Synthesis

  • Collation of data
  • Estimation of key figures
  • Analysis of derived insights

Data Validation

  • Triangulation with data models
  • Reference against proprietary databases
  • Corroboration with industry experts

REPORT WRITING

Qualitative

  • Market drivers
  • Market challenges
  • Market trends
  • Five forces analysis

Quantitative

  • Market size and forecast
  • Market segmentation
  • Geographical insights
  • Competitive landscape

Interested in this report?

Get your sample now to see our research methodology and insights!

Download Now

Frequently Asked Questions

Compact Electric Construction Equipment market growth will increase by USD 93681.1 million during 2026-2030.

The Compact Electric Construction Equipment market is expected to grow at a CAGR of 17.6% during 2026-2030.

Compact Electric Construction Equipment market is segmented by Product type (Forklift, Loader, Excavator, AWP equipment) Application (Commercial, Residential, Infrastructure) Propulsion (Battery electric, Hybrid electric, Grid-connected electric, Hydrogen fuel cell)

Avant Tecno Oy, Bobcat Co., CASE Construction, Caterpillar Inc., DEVELON, Groupe Mecalac SAS, Hitachi Construction Machinery, J C Bamford Excavators Ltd., Komatsu Ltd., Kubota Corp., Manitou BF SA, MultiOne S.r.l., Sany Heavy Industry Co. Ltd., Schaffer Maschinenfabrik GmbH, SHERPA mini loaders BV, Takeuchi Mfg. Co. Ltd., TOBROCO GIANT, Volvo Construction Equipment, Wacker Neuson SE, Yanmar Holdings Co. Ltd. are a few of the key vendors in the Compact Electric Construction Equipment market.

APAC will register the highest growth rate of 35.6% among the other regions. Therefore, the Compact Electric Construction Equipment market in APAC is expected to garner significant business opportunities for the vendors during the forecast period.

China, Japan, India, South Korea, Australia, Indonesia, US, Canada, Mexico, Germany, UK, France, Italy, Spain, The Netherlands, Saudi Arabia, UAE, South Africa, Israel, Turkey, Brazil, Argentina, Chile

  • Stringent government environmental regulations is the driving factor this market.

The Compact Electric Construction Equipment market vendors should focus on grabbing business opportunities from the Product type segment as it accounted for the largest market share in the base year.
RIA - Research AI Assistant
Ask RIA
