Computerized Maintenance Management System (CMMS) Market Analysis, Size, and Forecast 2026-2030: North America (US, Canada, and Mexico), Europe (Germany, UK, and France), APAC (China, Japan, and India), South America (Brazil and Argentina), Middle East and Africa (Saudi Arabia, UAE, and South Africa), and Rest of World (ROW)

Computerized Maintenance Management System (CMMS) Market Analysis, Size, and Forecast 2026-2030:
North America (US, Canada, and Mexico), Europe (Germany, UK, and France), APAC (China, Japan, and India), South America (Brazil and Argentina), Middle East and Africa (Saudi Arabia, UAE, and South Africa), and Rest of World (ROW)

Published: Mar 2026 291 Pages SKU: IRTNTR77119

Market Overview at a Glance

$1.08 B
Market Opportunity
10.1%
CAGR 2025 - 2030
44%
North America Growth
$851.8 Mn
On-premises segment 2024

Computerized Maintenance Management System (CMMS) Market Size 2026-2030

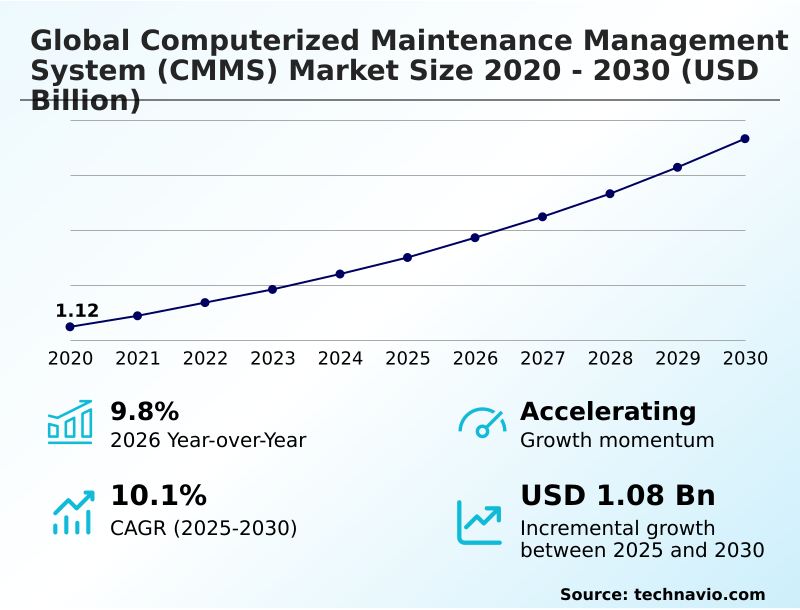
The computerized maintenance management system (cmms) market size is valued to increase by USD 1.08 billion, at a CAGR of 10.1% from 2025 to 2030. Increasing focus on operational efficiency and extending asset lifespan will drive the computerized maintenance management system (cmms) market.

Major Market Trends & Insights

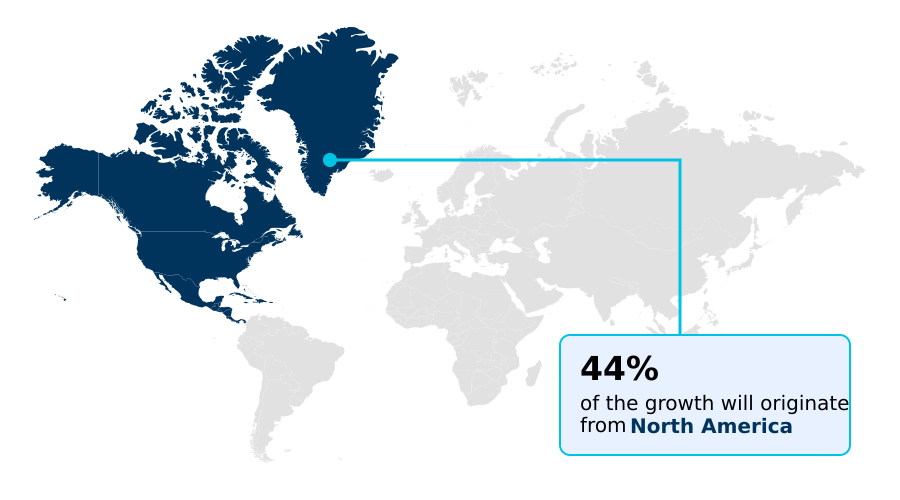
  • North America dominated the market and accounted for a 44% growth during the forecast period.
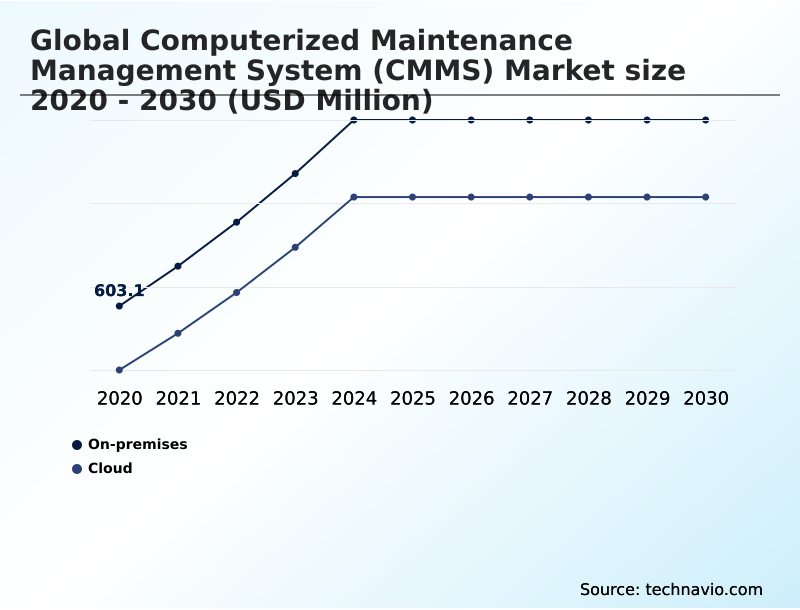
  • By Deployment - On-premises segment was valued at USD 851.8 million in 2024
  • By End-user - Large enterprises segment accounted for the largest market revenue share in 2024

Market Size & Forecast

  • Market Opportunities: USD 1.71 billion
  • Market Future Opportunities: USD 1.08 billion
  • CAGR from 2025 to 2030 : 10.1%

Market Summary

  • The Computerized Maintenance Management System (CMMS) Market is defined by its role in transforming asset-intensive industries from reactive to proactive operational models. Central to this shift is the software's ability to automate preventive maintenance scheduling, streamline work order management, and provide a centralized asset tracking database.
  • This digital foundation enables organizations to minimize costly unplanned downtime and extend the lifecycle of critical equipment. For instance, a large-scale manufacturing enterprise leverages its CMMS to monitor thousands of assets across multiple plants.
  • By analyzing data on equipment performance and failure rates, maintenance teams can anticipate potential issues, schedule repairs during planned shutdowns, and optimize spare parts inventory, thereby maintaining production continuity and maximizing resource utilization. The market is increasingly influenced by the integration of advanced technologies, pushing beyond traditional functions to offer more sophisticated data-driven insights for strategic asset management.

What will be the Size of the Computerized Maintenance Management System (CMMS) Market during the forecast period?

Get Key Insights on Market Forecast (PDF) Request Free Sample

How is the Computerized Maintenance Management System (CMMS) Market Segmented?

The computerized maintenance management system (cmms) industry research report provides comprehensive data (region-wise segment analysis), with forecasts and estimates in "USD million" for the period 2026-2030, as well as historical data from 2020-2024 for the following segments.

  • Deployment
    • On-premises
    • Cloud
  • End-user
    • Large enterprises
    • Small and medium enterprises
  • Application
    • Facility management
    • Healthcare
    • Education
    • Government
    • Others
  • Geography
    • North America
      • US
      • Canada
      • Mexico
    • Europe
      • Germany
      • UK
      • France
    • APAC
      • China
      • Japan
      • India
    • South America
      • Brazil
      • Argentina
    • Middle East and Africa
      • Saudi Arabia
      • UAE
      • South Africa
    • Rest of World (ROW)

By Deployment Insights

The on-premises segment is estimated to witness significant growth during the forecast period.

On-premises deployment is driven by security mandates and the need for deep customization. Organizations in regulated sectors choose this model for absolute control over their asset tracking database and sensitive maintenance metrics dashboard data, housing the system on private servers.

This approach, which supports cmms data migration from legacy systems, allows for intricate modifications to align with unique operational workflows, often unachievable in shared cloud environments. It also ensures system availability in locations with unreliable internet.

A key benefit is the facilitation of safety compliance management.

For these enterprises, the high degree of control over the facility management software and the ability to conduct detailed equipment failure analysis justify the capital investment, leading to a 30% lower risk of external data breaches.

This is a crucial factor for managing multi-site operations with stringent data protocols.

Request Free Sample

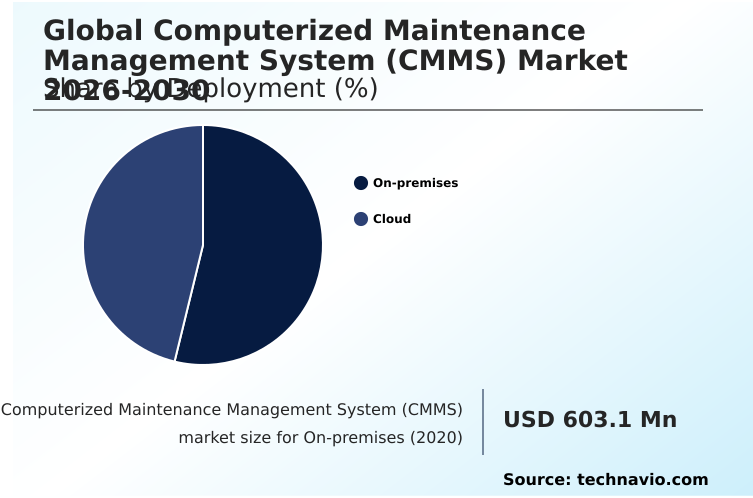
The On-premises segment was valued at USD 851.8 million in 2024 and showed a gradual increase during the forecast period.

Request Free Sample

Regional Analysis

North America is estimated to contribute 44% to the growth of the global market during the forecast period.Technavio’s analysts have elaborately explained the regional trends and drivers that shape the market during the forecast period.

See How Computerized Maintenance Management System (CMMS) Market Demand is Rising in North America Request Free Sample

The global landscape is led by North America, which accounts for nearly 44% of the market's incremental growth, driven by early technology adoption in the United States and Canada.

This region shows high demand for cloud-based CMMS platform solutions that support technician labor tracking and AI-powered predictive maintenance capabilities. Europe follows, with countries like Germany and the UK focusing on integrating CMMS with ERP systems for industrial efficiency.

The APAC region is a fast-growing market, with nations such as China and India rapidly adopting mobile CMMS application technology to support their expanding manufacturing and infrastructure sectors.

Adopting a data-driven maintenance strategy has shown to improve work order cycle time reduction by up to 30% in these advanced markets. CMMS for facility maintenance remains a key application globally.

Market Dynamics

Our researchers analyzed the data with 2025 as the base year, along with the key drivers, trends, and challenges. A holistic analysis of drivers will help companies refine their marketing strategies to gain a competitive advantage.

  • When evaluating how to choose a CMMS, organizations must consider specific operational needs. For instance, a CMMS software for small business might prioritize ease of use and affordability, while a larger enterprise will focus on integrating CMMS with ERP systems. The benefits of cloud based CMMS include scalability and reduced IT overhead, which are increasingly compelling across industries.
  • In specialized sectors, such as healthcare, selecting the right CMMS for hospital equipment maintenance is critical for compliance and patient safety. Similarly, asset tracking system for construction and work order software for property management address unique field-service requirements.
  • Many businesses use a CMMS return on investment calculator to justify the expenditure, focusing on top features of CMMS software like a mobile CMMS app for technicians and robust preventive maintenance schedule template options. Successful deployment hinges on best practices for CMMS data migration and a clear CMMS implementation project plan.
  • The importance of asset hierarchy in CMMS cannot be overstated for effective analysis, as it helps calculate overall equipment effectiveness. A modern facility maintenance work order system can how to reduce maintenance backlog by over 40% in the first year. Other key considerations include spare parts inventory management techniques and specialized solutions like CMMS for fleet maintenance management.
  • Increasingly, firms are exploring using AI for predictive maintenance scheduling to gain a competitive edge.

What are the key market drivers leading to the rise in the adoption of Computerized Maintenance Management System (CMMS) Industry?

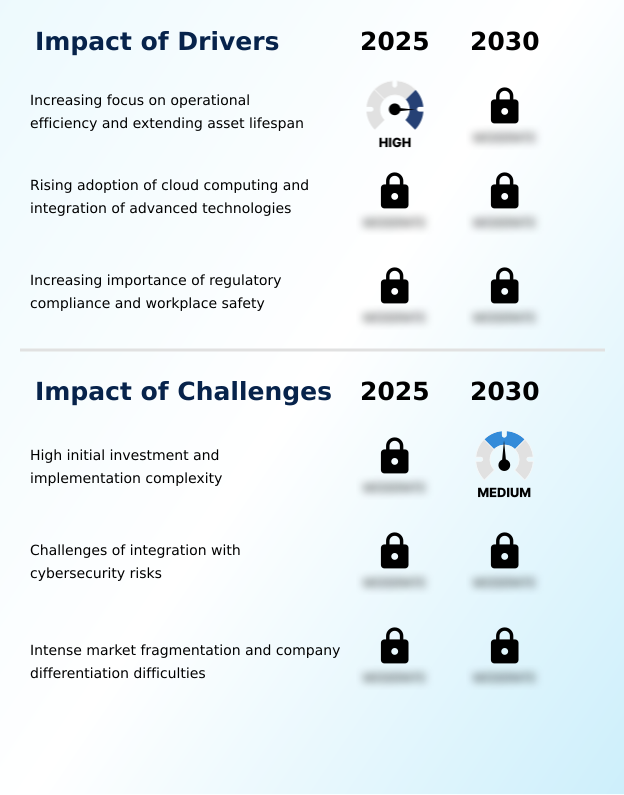
  • An increasing focus on enhancing operational efficiency and extending asset lifespan serves as a primary driver for market growth.

  • The primary market driver is the relentless pursuit of operational efficiency, compelling organizations to adopt systems that enhance work order prioritization and automate purchase order management.
  • By implementing a structured preventive maintenance scheduling system, businesses have documented up to a 50% reduction in unplanned equipment downtime. This directly impacts profitability and supports a longer asset lifecycle management.
  • The rising importance of regulatory compliance is also a significant factor, with modern systems providing a robust vendor management module and service level agreement (SLA) tracking to ensure adherence to standards.
  • The push for automating work order creation through sensor data and other triggers improves maintenance responsiveness by over 30%, making it a key component of a successful operational strategy and a clear demonstration of the benefits of preventive maintenance.

What are the market trends shaping the Computerized Maintenance Management System (CMMS) Industry?

  • The ascendancy of mobile-first platforms, coupled with a heightened focus on user experience, is fundamentally reshaping market dynamics and user expectations.

  • The market is rapidly advancing beyond traditional work order systems, with a significant trend toward platforms that offer a sophisticated role-based user interface and offline data synchronization. This focus on usability has led to a 25% increase in technician adoption rates for leading systems.
  • The integration of barcode and QR code scanning is now standard, streamlining MRO inventory management and asset identification. Furthermore, the ascendancy of mobile-first platforms is not just a preference but a necessity, with companies reporting a 20% improvement in real-time data capture accuracy from field technicians.
  • SaaS CMMS providers are capitalizing on this by offering customizable reporting tools and enhanced user adoption strategies for CMMS, recognizing that the value of the software is directly tied to its consistent use.

What challenges does the Computerized Maintenance Management System (CMMS) Industry face during its growth?

  • The high initial investment and inherent implementation complexity present a significant challenge to industry growth.

  • A significant challenge remains the complexity and cost of CMMS implementation, particularly for CMMS for small and medium enterprises. The process often involves difficult digital work instructions and overcoming resistance from teams accustomed to manual processes, with implementation failure rates reaching as high as 40% due to poor user adoption.
  • Another hurdle is achieving seamless IoT integration with legacy machinery, which can require custom development and specialized expertise. While the benefits of cloud deployment are clear, concerns about data security and tracking asset warranty information across disparate systems persist.
  • The difficulty in root cause failure analysis (RCFA) and ensuring accurate equipment downtime tracking without proper setup can undermine the expected ROI, making the initial investment a considerable barrier for many organizations looking to modernize.

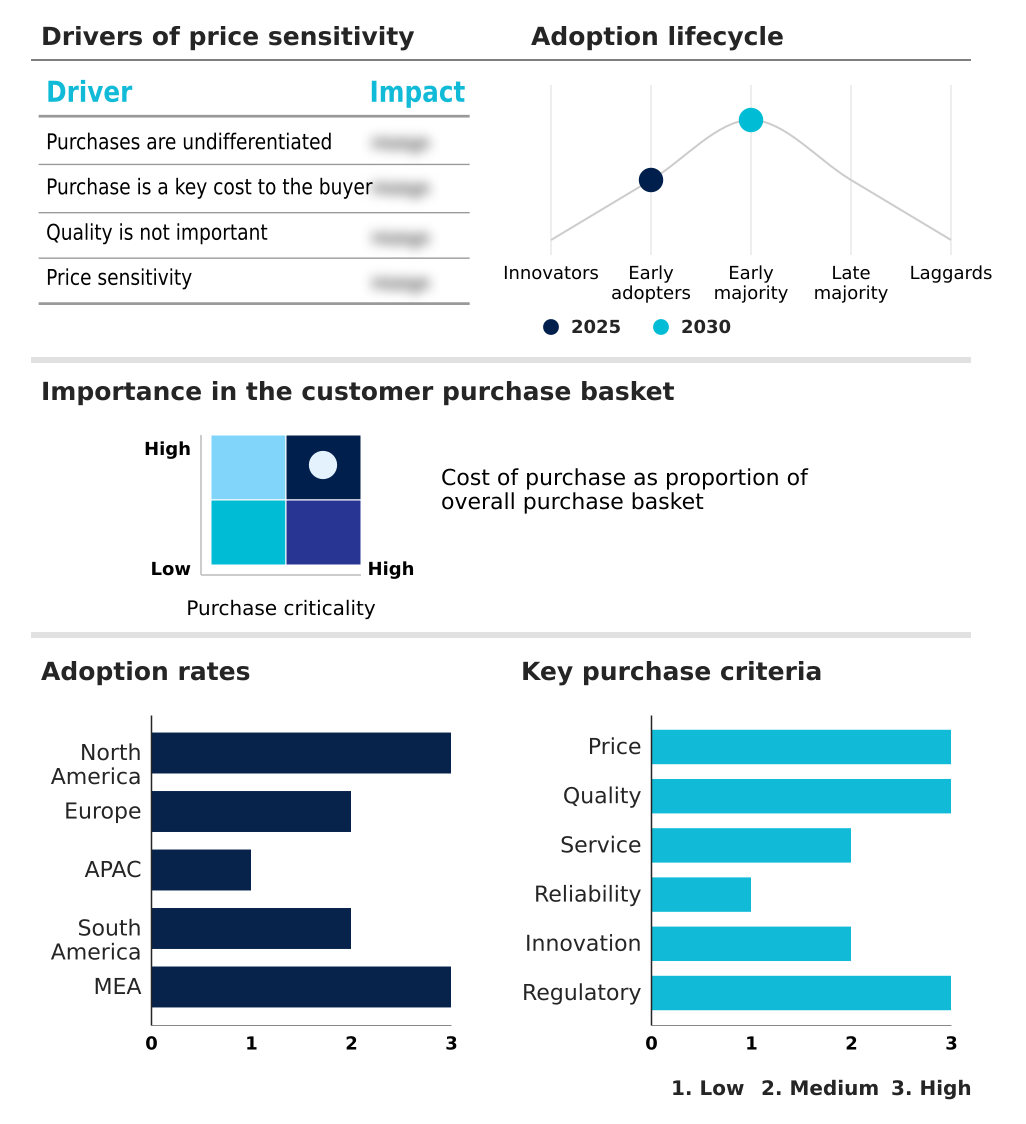
Exclusive Technavio Analysis on Customer Landscape

The computerized maintenance management system (cmms) market forecasting report includes the adoption lifecycle of the market, covering from the innovator’s stage to the laggard’s stage. It focuses on adoption rates in different regions based on penetration. Furthermore, the computerized maintenance management system (cmms) market report also includes key purchase criteria and drivers of price sensitivity to help companies evaluate and develop their market growth analysis strategies.

Customer Landscape of Computerized Maintenance Management System (CMMS) Industry

Competitive Landscape

Companies are implementing various strategies, such as strategic alliances, computerized maintenance management system (cmms) market forecast, partnerships, mergers and acquisitions, geographical expansion, and product/service launches, to enhance their presence in the industry.

Accruent - Providing unified software for facility, asset, and real estate portfolio management to optimize site performance, maintenance operations, and enterprise-wide asset intelligence.

The industry research and growth report includes detailed analyses of the competitive landscape of the market and information about key companies, including:

  • Accruent
  • Brightly Inc.
  • Cryotos
  • eMaint Enterprises LLC
  • Eptura Inc.
  • Facilio Inc.
  • Facilities Management Express
  • Fiix Inc.
  • Hexagon AB
  • IBM Corp.
  • Infor Inc.
  • Limble Solutions Inc.
  • LLumin Inc.
  • MaintainX
  • MPulse Software Inc.
  • Oracle Corp.
  • SAP SE
  • TMA Systems
  • Tractian Technologies Inc
  • UpKeep Technologies Inc.

Qualitative and quantitative analysis of companies has been conducted to help clients understand the wider business environment as well as the strengths and weaknesses of key industry players. Data is qualitatively analyzed to categorize companies as pure play, category-focused, industry-focused, and diversified; it is quantitatively analyzed to categorize companies as dominant, leading, strong, tentative, and weak.

Recent Development and News in Computerized maintenance management system (cmms) market

  • In October 2024, MaintainX introduced platform improvements, including a new purchase order integration with SAP and AI-driven features like Smart Time Estimates to optimize work order scheduling.
  • In December 2024, Tractian Technologies Inc. secured USD 120 million in Series C funding to advance its manufacturing AI and industrial monitoring solutions for predictive maintenance.
  • In January 2025, PEMAC, a provider of asset management software, merged with Elecosoft to create an end-to-end solution covering the entire asset lifecycle, from construction to maintenance.
  • In February 2025, Rockwell Automation announced a collaboration with DLG Group to deploy its Fiix CMMS software, aiming to modernize maintenance processes and reduce downtime by 10% across agricultural operations.

Dive into Technavio’s robust research methodology, blending expert interviews, extensive data synthesis, and validated models for unparalleled Computerized Maintenance Management System (CMMS) Market insights. See full methodology.

Market Scope
Page number 291
Base year 2025
Historic period 2020-2024
Forecast period 2026-2030
Growth momentum & CAGR Accelerate at a CAGR of 10.1%
Market growth 2026-2030 USD 1078.2 million
Market structure Fragmented
YoY growth 2025-2026(%) 9.8%
Key countries US, Canada, Mexico, Germany, UK, France, Italy, Spain, The Netherlands, China, Japan, India, South Korea, Australia, Indonesia, Brazil, Argentina, Chile, Saudi Arabia, UAE, South Africa, Turkey and Egypt
Competitive landscape Leading Companies, Market Positioning of Companies, Competitive Strategies, and Industry Risks

Request Free Sample

Research Analyst Overview

  • The Computerized Maintenance Management System (CMMS) Market is evolving from a system of record into a strategic engine for operational excellence. The core functionality, including work order management, preventive maintenance scheduling, and spare parts inventory control, now serves as a foundation for advanced analytics.
  • Integration of IoT sensor integration is enabling a shift towards condition-based maintenance (CBM), while the application of AI-powered predictive maintenance is becoming a key differentiator.
  • This technological progression is compelling boardroom discussions around digital transformation budgets, as businesses that implement a modern enterprise asset management (EAM) strategy report a 15% improvement in overall equipment effectiveness (OEE) within the first two years.
  • Key metrics such as mean time between failures (MTBF) and mean time to repair (MTTR) are no longer just operational data points but have become critical inputs for financial planning and risk management, directly influencing asset lifecycle costing and compliance strategies.
  • The focus remains on leveraging CMMS implementation to create a single source of truth for all maintenance, repair, and operations (MRO).

What are the Key Data Covered in this Computerized Maintenance Management System (CMMS) Market Research and Growth Report?

  • What is the expected growth of the Computerized Maintenance Management System (CMMS) Market between 2026 and 2030?

    • USD 1.08 billion, at a CAGR of 10.1%

  • What segmentation does the market report cover?

    • The report is segmented by Deployment (On-premises, and Cloud), End-user (Large enterprises, and Small and medium enterprises), Application (Facility management, Healthcare, Education, Government, and Others) and Geography (North America, Europe, APAC, South America, Middle East and Africa)

  • Which regions are analyzed in the report?

    • North America, Europe, APAC, South America and Middle East and Africa

  • What are the key growth drivers and market challenges?

    • Increasing focus on operational efficiency and extending asset lifespan, High initial investment and implementation complexity

  • Who are the major players in the Computerized Maintenance Management System (CMMS) Market?

    • Accruent, Brightly Inc., Cryotos, eMaint Enterprises LLC, Eptura Inc., Facilio Inc., Facilities Management Express, Fiix Inc., Hexagon AB, IBM Corp., Infor Inc., Limble Solutions Inc., LLumin Inc., MaintainX, MPulse Software Inc., Oracle Corp., SAP SE, TMA Systems, Tractian Technologies Inc and UpKeep Technologies Inc.

Market Research Insights

  • The market is characterized by a strategic shift toward data-driven maintenance strategies and an emphasis on demonstrable ROI. Adopting a modern work request portal and technician dispatch automation can improve workforce productivity by up to 25%. Furthermore, businesses leveraging advanced maintenance cost tracking and inventory management optimization report a 15% reduction in MRO spending compared to those using legacy systems.
  • The focus on asset lifecycle management is critical, as effective platforms can extend equipment lifespan by 20%, directly impacting capital expenditure cycles. The discussion around EAM vs CMMS functionality continues, with many organizations prioritizing systems that offer seamless IoT integration for CMMS and robust capabilities for regulatory compliance reporting, which are key drivers for adoption.

We can help! Our analysts can customize this computerized maintenance management system (cmms) market research report to meet your requirements.

Get in touch

1. Executive Summary

1.1 Market overview

Executive Summary - Chart on Market Overview
Executive Summary - Data Table on Market Overview
Executive Summary - Chart on Global Market Characteristics
Executive Summary - Chart on Market by Geography
Executive Summary - Chart on Market Segmentation by Deployment
Executive Summary - Chart on Market Segmentation by End-user
Executive Summary - Chart on Market Segmentation by Application
Executive Summary - Chart on Incremental Growth
Executive Summary - Data Table on Incremental Growth
Executive Summary - Chart on Company Market Positioning

2. Technavio Analysis

2.1 Analysis of price sensitivity, lifecycle, customer purchase basket, adoption rates, and purchase criteria

2.2 Criticality of inputs and Factors of differentiation

Chart on Overview on criticality of inputs and factors of differentiation

2.3 Factors of disruption

Chart on Overview on factors of disruption

2.4 Impact of drivers and challenges

Chart on Impact of drivers and challenges in 2025 and 2030

3. Market Landscape

3.1 Market ecosystem

Chart on Parent Market
Data Table on - Parent Market

3.2 Market characteristics

Chart on Market characteristics analysis

3.3 Value chain analysis

Chart on Value chain analysis

4. Market Sizing

4.1 Market definition

Data Table on Offerings of companies included in the market definition

4.2 Market segment analysis

Market segments

4.3 Market size 2025

4.4 Market outlook: Forecast for 2025-2030

Chart on Global - Market size and forecast 2025-2030 ($ million)
Data Table on Global - Market size and forecast 2025-2030 ($ million)
Chart on Global Market: Year-over-year growth 2025-2030 (%)
Data Table on Global Market: Year-over-year growth 2025-2030 (%)

5. Historic Market Size

5.1 Global Computerized Maintenance Management System (CMMS) Market 2020 - 2024

Historic Market Size - Data Table on Global Computerized Maintenance Management System (CMMS) Market 2020 - 2024 ($ million)

5.2 Deployment segment analysis 2020 - 2024

Historic Market Size - Deployment Segment 2020 - 2024 ($ million)

5.3 End-user segment analysis 2020 - 2024

Historic Market Size - End-user Segment 2020 - 2024 ($ million)

5.4 Application segment analysis 2020 - 2024

Historic Market Size - Application Segment 2020 - 2024 ($ million)

5.5 Geography segment analysis 2020 - 2024

Historic Market Size - Geography Segment 2020 - 2024 ($ million)

5.6 Country segment analysis 2020 - 2024

Historic Market Size - Country Segment 2020 - 2024 ($ million)

6. Qualitative Analysis

6.1 The impact of AI on global computerized maintenance management system (CMMS) market

7. Five Forces Analysis

7.1 Five forces summary

Five forces analysis - Comparison between 2025 and 2030

7.2 Bargaining power of buyers

Bargaining power of buyers - Impact of key factors 2025 and 2030

7.3 Bargaining power of suppliers

Bargaining power of suppliers - Impact of key factors in 2025 and 2030

7.4 Threat of new entrants

Threat of new entrants - Impact of key factors in 2025 and 2030

7.5 Threat of substitutes

Threat of substitutes - Impact of key factors in 2025 and 2030

7.6 Threat of rivalry

Threat of rivalry - Impact of key factors in 2025 and 2030

7.7 Market condition

Chart on Market condition - Five forces 2025 and 2030

8. Market Segmentation by Deployment

8.1 Market segments

Chart on Deployment - Market share 2025-2030 (%)
Data Table on Deployment - Market share 2025-2030 (%)

8.2 Comparison by Deployment

Chart on Comparison by Deployment
Data Table on Comparison by Deployment

8.3 On-premises - Market size and forecast 2025-2030

Chart on On-premises - Market size and forecast 2025-2030 ($ million)
Data Table on On-premises - Market size and forecast 2025-2030 ($ million)
Chart on On-premises - Year-over-year growth 2025-2030 (%)
Data Table on On-premises - Year-over-year growth 2025-2030 (%)

8.4 Cloud - Market size and forecast 2025-2030

Chart on Cloud - Market size and forecast 2025-2030 ($ million)
Data Table on Cloud - Market size and forecast 2025-2030 ($ million)
Chart on Cloud - Year-over-year growth 2025-2030 (%)
Data Table on Cloud - Year-over-year growth 2025-2030 (%)

8.5 Market opportunity by Deployment

Market opportunity by Deployment ($ million)
Data Table on Market opportunity by Deployment ($ million)

9. Market Segmentation by End-user

9.1 Market segments

Chart on End-user - Market share 2025-2030 (%)
Data Table on End-user - Market share 2025-2030 (%)

9.2 Comparison by End-user

Chart on Comparison by End-user
Data Table on Comparison by End-user

9.3 Large enterprises - Market size and forecast 2025-2030

Chart on Large enterprises - Market size and forecast 2025-2030 ($ million)
Data Table on Large enterprises - Market size and forecast 2025-2030 ($ million)
Chart on Large enterprises - Year-over-year growth 2025-2030 (%)
Data Table on Large enterprises - Year-over-year growth 2025-2030 (%)

9.4 Small and medium enterprises - Market size and forecast 2025-2030

Chart on Small and medium enterprises - Market size and forecast 2025-2030 ($ million)
Data Table on Small and medium enterprises - Market size and forecast 2025-2030 ($ million)
Chart on Small and medium enterprises - Year-over-year growth 2025-2030 (%)
Data Table on Small and medium enterprises - Year-over-year growth 2025-2030 (%)

9.5 Market opportunity by End-user

Market opportunity by End-user ($ million)
Data Table on Market opportunity by End-user ($ million)

10. Market Segmentation by Application

10.1 Market segments

Chart on Application - Market share 2025-2030 (%)
Data Table on Application - Market share 2025-2030 (%)

10.2 Comparison by Application

Chart on Comparison by Application
Data Table on Comparison by Application

10.3 Facility management - Market size and forecast 2025-2030

Chart on Facility management - Market size and forecast 2025-2030 ($ million)
Data Table on Facility management - Market size and forecast 2025-2030 ($ million)
Chart on Facility management - Year-over-year growth 2025-2030 (%)
Data Table on Facility management - Year-over-year growth 2025-2030 (%)

10.4 Healthcare - Market size and forecast 2025-2030

Chart on Healthcare - Market size and forecast 2025-2030 ($ million)
Data Table on Healthcare - Market size and forecast 2025-2030 ($ million)
Chart on Healthcare - Year-over-year growth 2025-2030 (%)
Data Table on Healthcare - Year-over-year growth 2025-2030 (%)

10.5 Education - Market size and forecast 2025-2030

Chart on Education - Market size and forecast 2025-2030 ($ million)
Data Table on Education - Market size and forecast 2025-2030 ($ million)
Chart on Education - Year-over-year growth 2025-2030 (%)
Data Table on Education - Year-over-year growth 2025-2030 (%)

10.6 Government - Market size and forecast 2025-2030

Chart on Government - Market size and forecast 2025-2030 ($ million)
Data Table on Government - Market size and forecast 2025-2030 ($ million)
Chart on Government - Year-over-year growth 2025-2030 (%)
Data Table on Government - Year-over-year growth 2025-2030 (%)

10.7 Others - Market size and forecast 2025-2030

Chart on Others - Market size and forecast 2025-2030 ($ million)
Data Table on Others - Market size and forecast 2025-2030 ($ million)
Chart on Others - Year-over-year growth 2025-2030 (%)
Data Table on Others - Year-over-year growth 2025-2030 (%)

10.8 Market opportunity by Application

Market opportunity by Application ($ million)
Data Table on Market opportunity by Application ($ million)

11. Customer Landscape

11.1 Customer landscape overview

Analysis of price sensitivity, lifecycle, customer purchase basket, adoption rates, and purchase criteria

12. Geographic Landscape

12.1 Geographic segmentation

Chart on Market share by geography 2025-2030 (%)
Data Table on Market share by geography 2025-2030 (%)

12.2 Geographic comparison

Chart on Geographic comparison
Data Table on Geographic comparison

12.3 North America - Market size and forecast 2025-2030

Chart on North America - Market size and forecast 2025-2030 ($ million)
Data Table on North America - Market size and forecast 2025-2030 ($ million)
Chart on North America - Year-over-year growth 2025-2030 (%)
Data Table on North America - Year-over-year growth 2025-2030 (%)
Chart on Regional Comparison - North America
Data Table on Regional Comparison - North America

12.3.1 US - Market size and forecast 2025-2030

Chart on US - Market size and forecast 2025-2030 ($ million)
Data Table on US - Market size and forecast 2025-2030 ($ million)
Chart on US - Year-over-year growth 2025-2030 (%)
Data Table on US - Year-over-year growth 2025-2030 (%)

12.3.2 Canada - Market size and forecast 2025-2030

Chart on Canada - Market size and forecast 2025-2030 ($ million)
Data Table on Canada - Market size and forecast 2025-2030 ($ million)
Chart on Canada - Year-over-year growth 2025-2030 (%)
Data Table on Canada - Year-over-year growth 2025-2030 (%)

12.3.3 Mexico - Market size and forecast 2025-2030

Chart on Mexico - Market size and forecast 2025-2030 ($ million)
Data Table on Mexico - Market size and forecast 2025-2030 ($ million)
Chart on Mexico - Year-over-year growth 2025-2030 (%)
Data Table on Mexico - Year-over-year growth 2025-2030 (%)

12.4 Europe - Market size and forecast 2025-2030

Chart on Europe - Market size and forecast 2025-2030 ($ million)
Data Table on Europe - Market size and forecast 2025-2030 ($ million)
Chart on Europe - Year-over-year growth 2025-2030 (%)
Data Table on Europe - Year-over-year growth 2025-2030 (%)
Chart on Regional Comparison - Europe
Data Table on Regional Comparison - Europe

12.4.1 Germany - Market size and forecast 2025-2030

Chart on Germany - Market size and forecast 2025-2030 ($ million)
Data Table on Germany - Market size and forecast 2025-2030 ($ million)
Chart on Germany - Year-over-year growth 2025-2030 (%)
Data Table on Germany - Year-over-year growth 2025-2030 (%)

12.4.2 UK - Market size and forecast 2025-2030

Chart on UK - Market size and forecast 2025-2030 ($ million)
Data Table on UK - Market size and forecast 2025-2030 ($ million)
Chart on UK - Year-over-year growth 2025-2030 (%)
Data Table on UK - Year-over-year growth 2025-2030 (%)

12.4.3 France - Market size and forecast 2025-2030

Chart on France - Market size and forecast 2025-2030 ($ million)
Data Table on France - Market size and forecast 2025-2030 ($ million)
Chart on France - Year-over-year growth 2025-2030 (%)
Data Table on France - Year-over-year growth 2025-2030 (%)

12.4.4 Italy - Market size and forecast 2025-2030

Chart on Italy - Market size and forecast 2025-2030 ($ million)
Data Table on Italy - Market size and forecast 2025-2030 ($ million)
Chart on Italy - Year-over-year growth 2025-2030 (%)
Data Table on Italy - Year-over-year growth 2025-2030 (%)

12.4.5 Spain - Market size and forecast 2025-2030

Chart on Spain - Market size and forecast 2025-2030 ($ million)
Data Table on Spain - Market size and forecast 2025-2030 ($ million)
Chart on Spain - Year-over-year growth 2025-2030 (%)
Data Table on Spain - Year-over-year growth 2025-2030 (%)

12.4.6 The Netherlands - Market size and forecast 2025-2030

Chart on The Netherlands - Market size and forecast 2025-2030 ($ million)
Data Table on The Netherlands - Market size and forecast 2025-2030 ($ million)
Chart on The Netherlands - Year-over-year growth 2025-2030 (%)
Data Table on The Netherlands - Year-over-year growth 2025-2030 (%)

12.5 APAC - Market size and forecast 2025-2030

Chart on APAC - Market size and forecast 2025-2030 ($ million)
Data Table on APAC - Market size and forecast 2025-2030 ($ million)
Chart on APAC - Year-over-year growth 2025-2030 (%)
Data Table on APAC - Year-over-year growth 2025-2030 (%)
Chart on Regional Comparison - APAC
Data Table on Regional Comparison - APAC

12.5.1 China - Market size and forecast 2025-2030

Chart on China - Market size and forecast 2025-2030 ($ million)
Data Table on China - Market size and forecast 2025-2030 ($ million)
Chart on China - Year-over-year growth 2025-2030 (%)
Data Table on China - Year-over-year growth 2025-2030 (%)

12.5.2 Japan - Market size and forecast 2025-2030

Chart on Japan - Market size and forecast 2025-2030 ($ million)
Data Table on Japan - Market size and forecast 2025-2030 ($ million)
Chart on Japan - Year-over-year growth 2025-2030 (%)
Data Table on Japan - Year-over-year growth 2025-2030 (%)

12.5.3 India - Market size and forecast 2025-2030

Chart on India - Market size and forecast 2025-2030 ($ million)
Data Table on India - Market size and forecast 2025-2030 ($ million)
Chart on India - Year-over-year growth 2025-2030 (%)
Data Table on India - Year-over-year growth 2025-2030 (%)

12.5.4 South Korea - Market size and forecast 2025-2030

Chart on South Korea - Market size and forecast 2025-2030 ($ million)
Data Table on South Korea - Market size and forecast 2025-2030 ($ million)
Chart on South Korea - Year-over-year growth 2025-2030 (%)
Data Table on South Korea - Year-over-year growth 2025-2030 (%)

12.5.5 Australia - Market size and forecast 2025-2030

Chart on Australia - Market size and forecast 2025-2030 ($ million)
Data Table on Australia - Market size and forecast 2025-2030 ($ million)
Chart on Australia - Year-over-year growth 2025-2030 (%)
Data Table on Australia - Year-over-year growth 2025-2030 (%)

12.5.6 Indonesia - Market size and forecast 2025-2030

Chart on Indonesia - Market size and forecast 2025-2030 ($ million)
Data Table on Indonesia - Market size and forecast 2025-2030 ($ million)
Chart on Indonesia - Year-over-year growth 2025-2030 (%)
Data Table on Indonesia - Year-over-year growth 2025-2030 (%)

12.6 South America - Market size and forecast 2025-2030

Chart on South America - Market size and forecast 2025-2030 ($ million)
Data Table on South America - Market size and forecast 2025-2030 ($ million)
Chart on South America - Year-over-year growth 2025-2030 (%)
Data Table on South America - Year-over-year growth 2025-2030 (%)
Chart on Regional Comparison - South America
Data Table on Regional Comparison - South America

12.6.1 Brazil - Market size and forecast 2025-2030

Chart on Brazil - Market size and forecast 2025-2030 ($ million)
Data Table on Brazil - Market size and forecast 2025-2030 ($ million)
Chart on Brazil - Year-over-year growth 2025-2030 (%)
Data Table on Brazil - Year-over-year growth 2025-2030 (%)

12.6.2 Argentina - Market size and forecast 2025-2030

Chart on Argentina - Market size and forecast 2025-2030 ($ million)
Data Table on Argentina - Market size and forecast 2025-2030 ($ million)
Chart on Argentina - Year-over-year growth 2025-2030 (%)
Data Table on Argentina - Year-over-year growth 2025-2030 (%)

12.6.3 Chile - Market size and forecast 2025-2030

Chart on Chile - Market size and forecast 2025-2030 ($ million)
Data Table on Chile - Market size and forecast 2025-2030 ($ million)
Chart on Chile - Year-over-year growth 2025-2030 (%)
Data Table on Chile - Year-over-year growth 2025-2030 (%)

12.7 Middle East and Africa - Market size and forecast 2025-2030

Chart on Middle East and Africa - Market size and forecast 2025-2030 ($ million)
Data Table on Middle East and Africa - Market size and forecast 2025-2030 ($ million)
Chart on Middle East and Africa - Year-over-year growth 2025-2030 (%)
Data Table on Middle East and Africa - Year-over-year growth 2025-2030 (%)
Chart on Regional Comparison - Middle East and Africa
Data Table on Regional Comparison - Middle East and Africa

12.7.1 Saudi Arabia - Market size and forecast 2025-2030

Chart on Saudi Arabia - Market size and forecast 2025-2030 ($ million)
Data Table on Saudi Arabia - Market size and forecast 2025-2030 ($ million)
Chart on Saudi Arabia - Year-over-year growth 2025-2030 (%)
Data Table on Saudi Arabia - Year-over-year growth 2025-2030 (%)

12.7.2 UAE - Market size and forecast 2025-2030

Chart on UAE - Market size and forecast 2025-2030 ($ million)
Data Table on UAE - Market size and forecast 2025-2030 ($ million)
Chart on UAE - Year-over-year growth 2025-2030 (%)
Data Table on UAE - Year-over-year growth 2025-2030 (%)

12.7.3 South Africa - Market size and forecast 2025-2030

Chart on South Africa - Market size and forecast 2025-2030 ($ million)
Data Table on South Africa - Market size and forecast 2025-2030 ($ million)
Chart on South Africa - Year-over-year growth 2025-2030 (%)
Data Table on South Africa - Year-over-year growth 2025-2030 (%)

12.7.4 Turkey - Market size and forecast 2025-2030

Chart on Turkey - Market size and forecast 2025-2030 ($ million)
Data Table on Turkey - Market size and forecast 2025-2030 ($ million)
Chart on Turkey - Year-over-year growth 2025-2030 (%)
Data Table on Turkey - Year-over-year growth 2025-2030 (%)

12.7.5 Egypt - Market size and forecast 2025-2030

Chart on Egypt - Market size and forecast 2025-2030 ($ million)
Data Table on Egypt - Market size and forecast 2025-2030 ($ million)
Chart on Egypt - Year-over-year growth 2025-2030 (%)
Data Table on Egypt - Year-over-year growth 2025-2030 (%)

12.8 Market opportunity by geography

Market opportunity by geography ($ million)
Data Tables on Market opportunity by geography ($ million)

13. Drivers, Challenges, and Opportunity

13.1 Market drivers

Increasing focus on operational efficiency and extending asset lifespan
Rising adoption of cloud computing and integration of advanced technologies
Increasing importance of regulatory compliance and workplace safety

13.2 Market challenges

High initial investment and implementation complexity
Challenges of integration with cybersecurity risks
Intense market fragmentation and company differentiation difficulties

13.3 Impact of drivers and challenges

Impact of drivers and challenges in 2025 and 2030

13.4 Market opportunities

Ascendancy of mobile-first platforms and focus on user experience
Deepening integration of CMMS into broader enterprise technology ecosystem
Shift towards predictive and prescriptive maintenance through artificial intelligence

14. Competitive Landscape

14.1 Overview

14.2

Overview on criticality of inputs and factors of differentiation

14.3 Landscape disruption

Overview on factors of disruption

14.4 Industry risks

Impact of key risks on business

15. Competitive Analysis

15.1 Companies profiled

Companies covered

15.2 Company ranking index

15.3 Market positioning of companies

Matrix on companies position and classification

15.4 Accruent

Accruent - Overview
Accruent - Product / Service
Accruent - Key offerings
SWOT

15.5 Brightly Inc.

Brightly Inc. - Overview
Brightly Inc. - Product / Service
Brightly Inc. - Key offerings
SWOT

15.6 Cryotos

Cryotos - Overview
Cryotos - Product / Service
Cryotos - Key offerings
SWOT

15.7 Eptura Inc.

Eptura Inc. - Overview
Eptura Inc. - Product / Service
Eptura Inc. - Key offerings
SWOT

15.8 Facilio Inc.

Facilio Inc. - Overview
Facilio Inc. - Product / Service
Facilio Inc. - Key offerings
SWOT

15.9 Facilities Management Express

Facilities Management Express - Overview
Facilities Management Express - Product / Service
Facilities Management Express - Key offerings
SWOT

15.10 Hexagon AB

Hexagon AB - Overview
Hexagon AB - Business segments
Hexagon AB - Key news
Hexagon AB - Key offerings
Hexagon AB - Segment focus
SWOT

15.11 IBM Corp.

IBM Corp. - Overview
IBM Corp. - Business segments
IBM Corp. - Key news
IBM Corp. - Key offerings
IBM Corp. - Segment focus
SWOT

15.12 Infor Inc.

Infor Inc. - Overview
Infor Inc. - Product / Service
Infor Inc. - Key news
Infor Inc. - Key offerings
SWOT

15.13 LLumin Inc.

LLumin Inc. - Overview
LLumin Inc. - Product / Service
LLumin Inc. - Key offerings
SWOT

15.14 MaintainX

MaintainX - Overview
MaintainX - Product / Service
MaintainX - Key offerings
SWOT

15.15 Oracle Corp.

Oracle Corp. - Overview
Oracle Corp. - Business segments
Oracle Corp. - Key news
Oracle Corp. - Key offerings
Oracle Corp. - Segment focus
SWOT

15.16 SAP SE

SAP SE - Overview
SAP SE - Business segments
SAP SE - Key news
SAP SE - Key offerings
SAP SE - Segment focus
SWOT

15.17 TMA Systems

TMA Systems - Overview
TMA Systems - Product / Service
TMA Systems - Key offerings
SWOT

15.18 Tractian Technologies Inc

Tractian Technologies Inc - Overview
Tractian Technologies Inc - Product / Service
Tractian Technologies Inc - Key offerings
SWOT

16. Appendix

16.1 Scope of the report

Market definition
Objectives
Notes and caveats

16.2 Inclusions and exclusions checklist

Inclusions checklist
Exclusions checklist

16.3 Currency conversion rates for US$

16.4 Research methodology

16.5 Data procurement

Information sources

16.6 Data validation

16.7 Validation techniques employed for market sizing

16.8 Data synthesis

16.9 360 degree market analysis

16.10 List of abbreviations

Research Methodology

Technavio presents a detailed picture of the market by way of study, synthesis, and summation of data from multiple sources. The analysts have presented the various facets of the market with a particular focus on identifying the key industry influencers. The data thus presented is comprehensive, reliable, and the result of extensive research, both primary and secondary.

INFORMATION SOURCES

Primary sources

  • Manufacturers and suppliers
  • Channel partners
  • Industry experts
  • Strategic decision makers

Secondary sources

  • Industry journals and periodicals
  • Government data
  • Financial reports of key industry players
  • Historical data
  • Press releases

DATA ANALYSIS

Data Synthesis

  • Collation of data
  • Estimation of key figures
  • Analysis of derived insights

Data Validation

  • Triangulation with data models
  • Reference against proprietary databases
  • Corroboration with industry experts

REPORT WRITING

Qualitative

  • Market drivers
  • Market challenges
  • Market trends
  • Five forces analysis

Quantitative

  • Market size and forecast
  • Market segmentation
  • Geographical insights
  • Competitive landscape

Interested in this report?

Get your sample now to see our research methodology and insights!

Download Now

Frequently Asked Questions

Computerized Maintenance Management System (CMMS) market growth will increase by USD 1078.2 million during 2026-2030.

The Computerized Maintenance Management System (CMMS) market is expected to grow at a CAGR of 10.1% during 2026-2030.

Computerized Maintenance Management System (CMMS) market is segmented by Deployment (On-premises, Cloud) End-user (Large enterprises, Small and medium enterprises) Application (Facility management, Healthcare, Education, Government, Others)

Accruent, Brightly Inc., Cryotos, eMaint Enterprises LLC, Eptura Inc., Facilio Inc., Facilities Management Express, Fiix Inc., Hexagon AB, IBM Corp., Infor Inc., Limble Solutions Inc., LLumin Inc., MaintainX, MPulse Software Inc., Oracle Corp., SAP SE, TMA Systems, Tractian Technologies Inc, UpKeep Technologies Inc. are a few of the key vendors in the Computerized Maintenance Management System (CMMS) market.

North America will register the highest growth rate of 44% among the other regions. Therefore, the Computerized Maintenance Management System (CMMS) market in North America is expected to garner significant business opportunities for the vendors during the forecast period.

US, Canada, Mexico, Germany, UK, France, Italy, Spain, The Netherlands, China, Japan, India, South Korea, Australia, Indonesia, Brazil, Argentina, Chile, Saudi Arabia, UAE, South Africa, Turkey, Egypt

  • Increasing focus on operational efficiency and extending asset lifespan is the driving factor this market.

The Computerized Maintenance Management System (CMMS) market vendors should focus on grabbing business opportunities from the Deployment segment as it accounted for the largest market share in the base year.