
Europe Construction Equipment Market Size 2025-2029
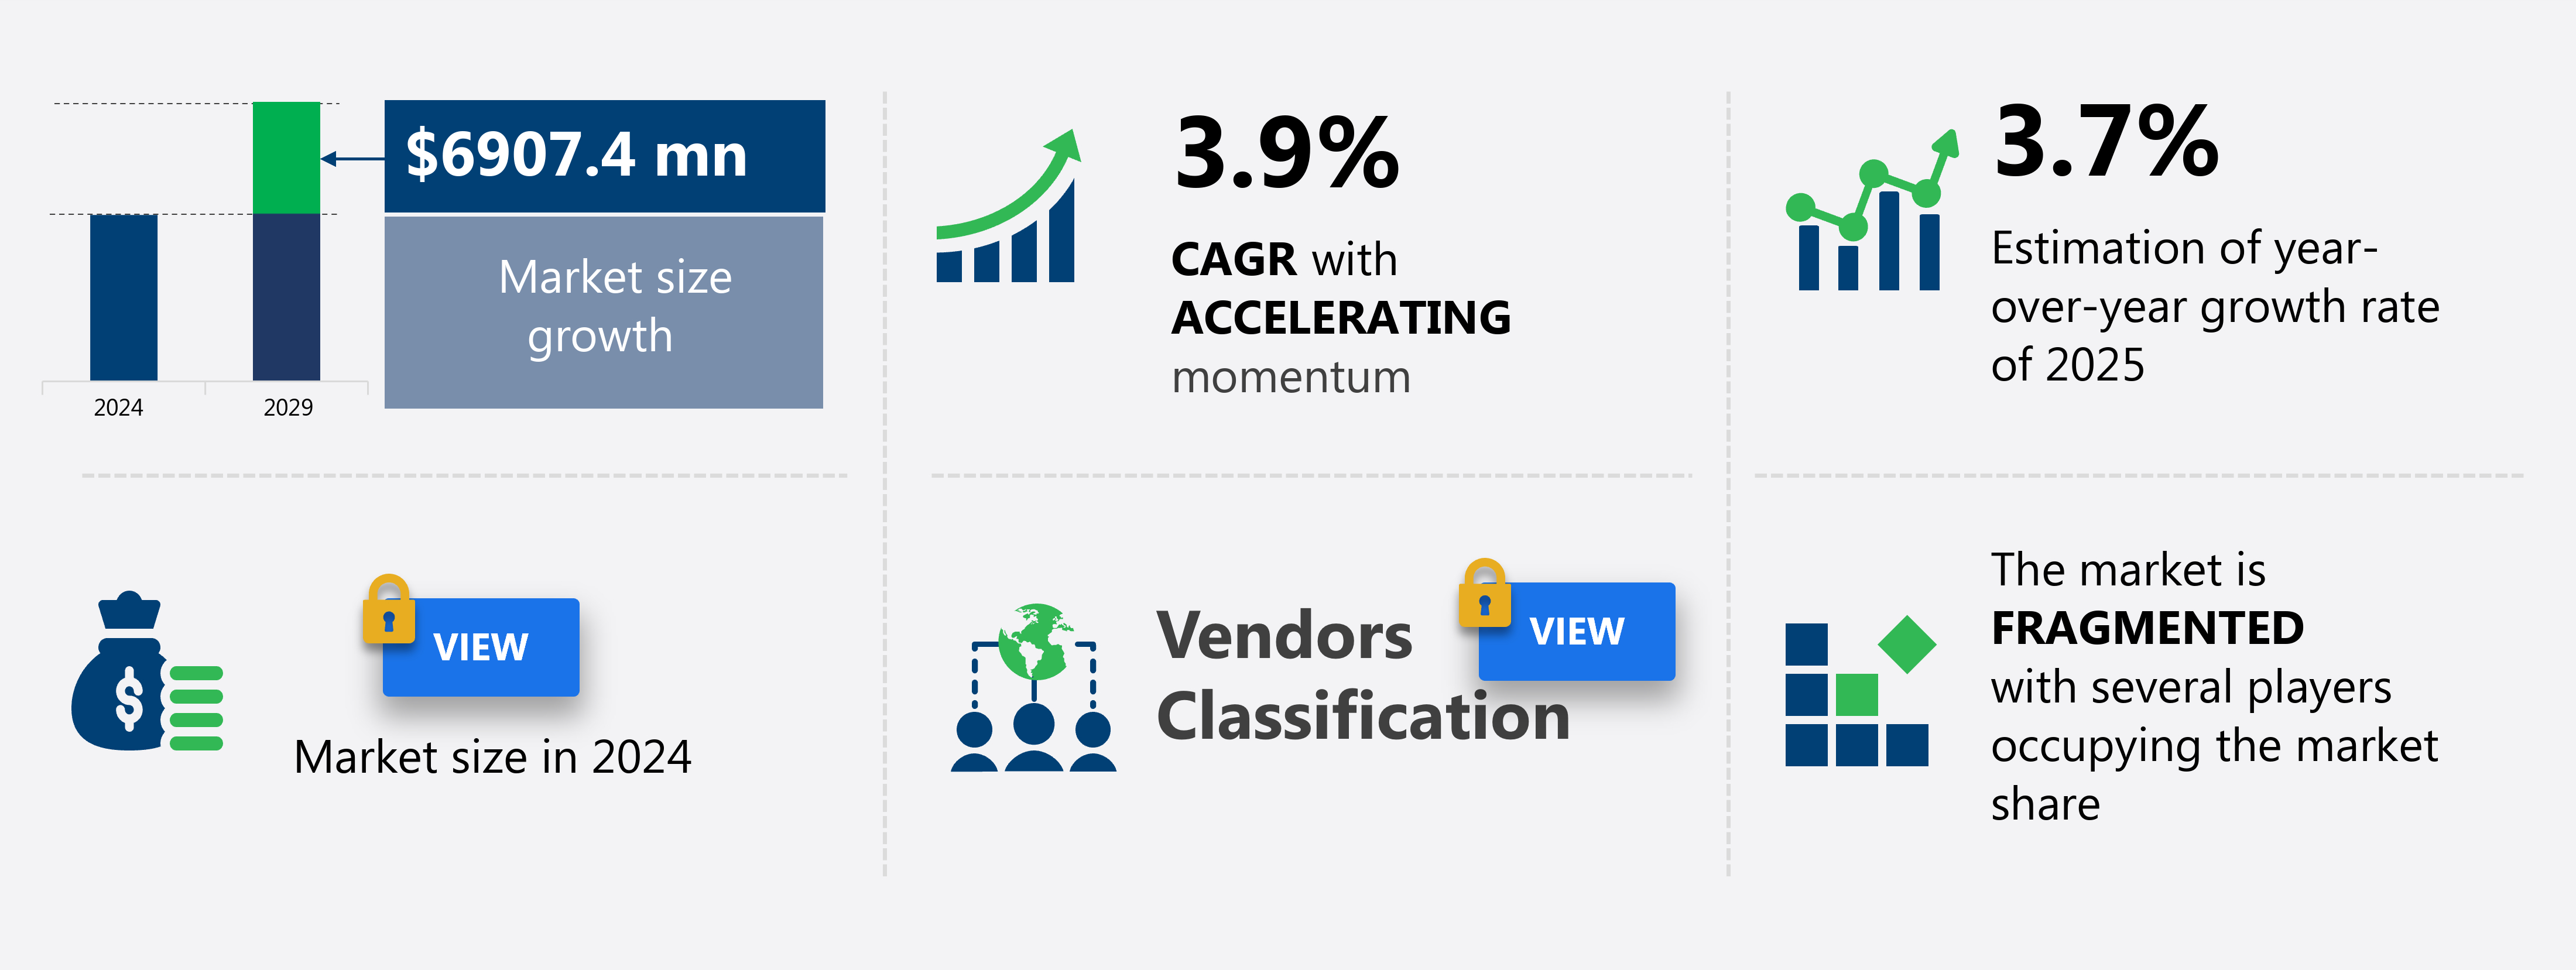
The construction equipment market size in Europe is forecast to increase by USD 6.91 billion at a CAGR of 3.9% between 2024 and 2029.
-
The European construction equipment market is experiencing significant growth, driven by increasing government infrastructure investments and the rising demand for electric construction equipment. These trends are shaping the industry landscape, with electric equipment gaining traction due to its environmental benefits and cost savings over time. The construction equipment landscape is further shaped by the ongoing development of green city projects and the integration of steel and real estate investments. However, the high cost associated with purchasing and maintaining construction equipment remains a challenge for market participants.
-
As governments continue to invest in infrastructure projects and the push for sustainability intensifies, the European construction equipment market is poised for continued growth. Companies in this sector must navigate these trends and address cost concerns to remain competitive and capture market share. Urban expansion, including high-rise apartments, is driving the use of concrete mixer, motor grader, and loaders and backhoe combinations for efficient site preparation.
What will be the Size of the Market During the Forecast Period?
-
The European construction equipment market encompasses various sectors, including IoT-enabled light-duty vehicles, telescopic handling solutions, and OEMs specializing in construction machinery and non-road mobile machinery. This dynamic industry embraces advanced technologies such as automation, AI-driven analytics, virtual reality, and augmented reality. Major players in this domain include Mack Trucks, focusing on IC engine technologies, and those developing AI-based twin technology for earthmoving machinery like excavators and loaders. The housing sector and infrastructure projects fuel market growth, with emission norms driving the adoption of diesel particulate filters and engine technologies. Inland waterway vessels and railroad engines also contribute to the market's diversity, while the transportation sector's increasing focus on green city projects further propels innovation.
-
Trends include the integration of telemetry data and real-time analytics, enabling predictive maintenance and optimization of telescopic handling and crane performance. Moreover, the market witnesses the emergence of autonomous machinery and AI-driven analytics in earthmoving machinery, excavators, and loaders and backhoes. The future of construction equipment lies in the seamless integration of technology and sustainability, ensuring efficient, cost-effective, and eco-friendly solutions for the industry.
How is this market segmented and which is the largest segment?
The market research report provides comprehensive data (region-wise segment analysis), with forecasts and estimates in "USD million" for the period 2025-2029, as well as historical data from 2019-2023 for the following segments.
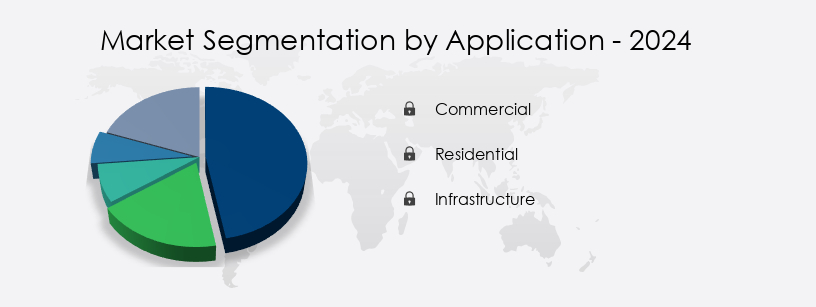
- Application
- Commercial
- Residential
- Infrastructure
- Product
- Earthmoving equipment
- Material handling equipment
- Concrete equipment
- Road construction equipment
- Others
- Fuel Type
- Diesel
- Gasoline
- Others
- Engine Capacity
- Up to 250 HP
- 250 to 500 HP
- More than 500 HP
- Geography
- Europe
- France
- Germany
- Italy
- UK
- Europe
By Application Insights
The commercial segment is estimated to witness significant growth during the forecast period. The European construction industry has witnessed substantial growth, leading to a heightened demand for construction equipment. This trend is driven by various factors, including urbanization, infrastructure development, and increased construction activity. Consequently, the market for construction machinery, including Truck Mounted Cranes, Compact electric excavators, and Earth moving equipment, has experienced significant growth. For instance, the construction of the Nord Stream 2 pipelines in Germany necessitated the use of specialized equipment such as cranes, excavators, and concrete pumps. Furthermore, the housing sector's recovery and the development of Green City Projects have fueled the demand for Construction machinery, Motor Graders, Concrete Mixers, and other equipment.
The European construction equipment market is experiencing significant growth, driven by increasing government infrastructure investments and the rising demand for electric construction equipment. Digitalization and automation have also influenced the market, with AI-driven analytics, IoT, and virtual reality technologies being integrated into various equipment types. The European construction industry's sustainability goals have led to the adoption of IC Engines, Diesel particulate filters, and other emission control technologies. Additionally, the transportation sector's evolution, with the rise of Electric vehicles, Hybrid vehicles, and Gasoline engines, has impacted the market dynamics. The market continues to evolve, with OEMs introducing innovative technologies to meet the industry's demands and regulatory requirements.
The Construction Equipment Market in Europe is undergoing a sustainable transformation, driven by initiatives like the green city project and stricter emission standards. Demand is surging for low-emission machinery such as the electric road roller and versatile loader, supporting eco-friendly concrete and road construction. The popularity of offroad recreational vehicles has also spurred specialized infrastructure needs. Regulatory pressure to reduce nox emissions is influencing equipment design, prompting manufacturers to adopt hybrid and electric alternatives. As the Europe construction industry evolves, innovation and sustainability are becoming key forces shaping the region's equipment landscape.
Get a glance at the market report of share of various segments Request Free Sample
Market Dynamics
Our Europe Construction Equipment Market researchers analyzed the data with 2024 as the base year, along with the key drivers, trends, and challenges. A holistic analysis of drivers will help companies refine their marketing strategies to gain a competitive advantage.
What are the key market drivers leading to the rise in adoption of Europe Construction Equipment Market?
-
Increasing government infrastructure investments is the key driver of the market. The European construction equipment market is experiencing growth due to large-scale infrastructure projects funded by the European Union (EU) and various national governments. These initiatives aim to develop renewable energy projects, modernize urban areas, and enhance transportation networks, leading to increased demand for construction machinery such as excavators, bulldozers, loaders, and cranes.
-
Overall, the European construction equipment market is expected to grow significantly during the forecast period, driven by these market dynamics. The need to replace and upgrade outdated equipment with more efficient and eco-friendly alternatives is driven by stringent emissions and safety regulations in Europe. Additionally, advancements in automation, AI-based twin technology, and hybrid vehicles are transforming the market, with virtual reality and loaders and backhoes gaining popularity in the transportation infrastructure sector.
What are the market trends shaping the Europe Construction Equipment Market?
-
Increasing demand for electric construction equipment is the upcoming trend in the market. The European construction equipment market is experiencing a shift towards electric machinery, including wheel loaders, pavers, and telescopic handling equipment, as stricter emission norms and sustainability concerns gain prominence. Norway is leading this trend, aiming to ban the sale of fossil-fueled construction equipment by 2025.
-
Digitalization is another key trend, with companies investing in advanced technologies to improve efficiency, productivity, and safety. Overall, the European construction equipment market is evolving to meet the demands of a more sustainable and technologically advanced industry. Electric construction equipment offers several advantages, such as lower emissions, reduced noise levels, and lower operating costs, making it an attractive option for companies seeking economical and eco-friendly solutions. Infrastructure projects, railroad engines, and inland waterway vessels are also transitioning to electric power, with diesel engines being gradually replaced by diesel particulate filters and alternative fuels.
What challenges doesEurope Construction Equipment Market face during the growth?
-
High cost associated with construction equipment is a key challenge affecting the market growth. The European construction equipment market faces significant challenges due to the high costs associated with purchasing and maintaining this equipment. Construction companies often grapple with financial constraints, which can hinder their ability to invest in new machinery. This situation can negatively impact market growth. Moreover, the high operational and maintenance costs can compel businesses to use outdated equipment, leading to reduced productivity and efficiency. To foster the market's continued expansion in Europe, it is essential to address the financial burdens that construction companies face. This could involve exploring cost-effective solutions, such as leasing or financing options, or investing in more energy-efficient and durable equipment.
-
Additionally, the integration of advanced technologies, such as AI-driven analytics, can help improve equipment performance and reduce maintenance costs over time. Key players in the market, including manufacturers of Truck Mounted Cranes, Compact electric excavators, Earth moving equipment, Motor Graders, Cranes, Concrete Mixers, Construction Pumps, and Trailer Mounted Cranes, can collaborate with governments and industry bodies to develop policies and initiatives that make construction equipment more affordable and accessible to businesses. Compliance with stringent GHG standards and regulations regarding SOx emissions and particulate matter (PM) can also contribute to the overall cost reduction and improved sustainability of the market.
Exclusive Customer Landscape
The market forecasting report includes the adoption lifecycle of the market, covering from the innovator's stage to the laggard's stage. It focuses on adoption rates in different regions based on penetration. Furthermore, the market report also includes key purchase criteria and drivers of price sensitivity to help companies evaluate and develop their market growth analysis strategies.
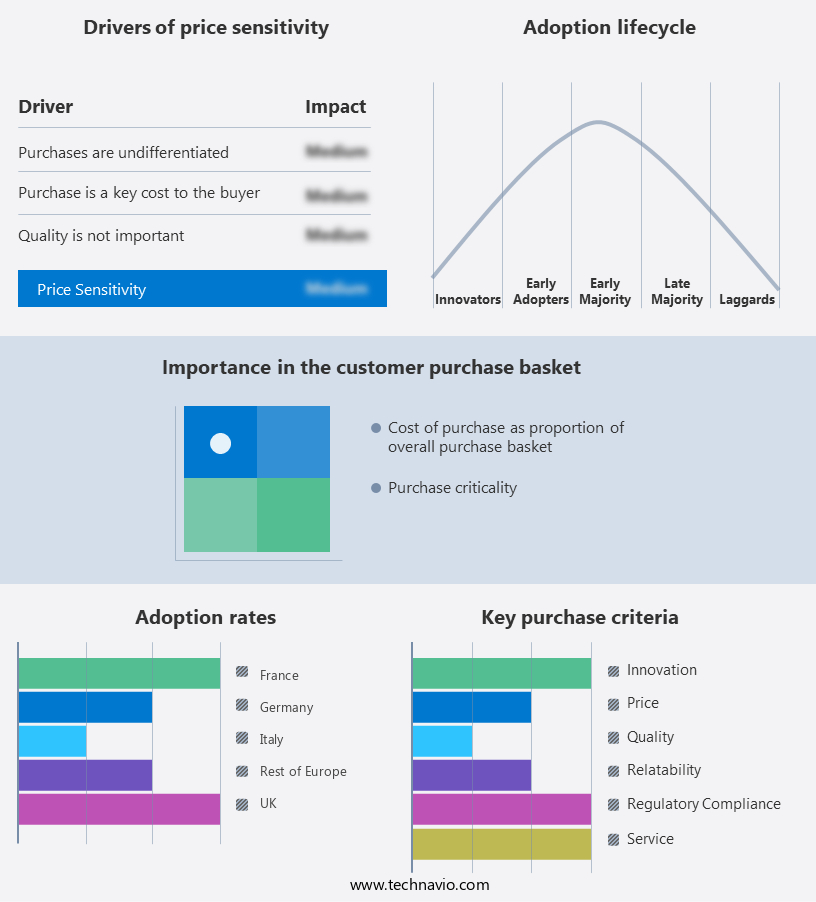
Customer Landscape
Key Companies & Market Insights
Companies are implementing various strategies, such as strategic alliances, market forecast , partnerships, mergers and acquisitions, geographical expansion, and product/service launches, to enhance their presence in the market.
AB Volvo - This company specializes in providing a range of construction equipment solutions.
The market research and growth report includes detailed analyses of the competitive landscape of the market and information about key companies, including:
- AB Volvo
- Atlas Copco AB
- Caterpillar Inc.
- CNH Industrial NV
- Deere and Co.
- Doosan Corp.
- Hitachi Ltd.
- J C Bamford Excavators Ltd.
- Kawasaki Heavy Industries Ltd.
- Kobe Steel Ltd.
- Komatsu Ltd.
- Kubota Corp.
- Liebherr International AG
- Sany Group
- Schaeffler AG
- Terex Corp.
- Xuzhou Construction Machinery Group Co. Ltd.
- Yanmar Holdings Co. Ltd.
- ZEPPELIN GmbH
Qualitative and quantitative analysis of companies has been conducted to help clients understand the wider business environment as well as the strengths and weaknesses of key market players. Data is qualitatively analyzed to categorize companies as pure play, category-focused, industry-focused, and diversified; it is quantitatively analyzed to categorize companies as dominant, leading, strong, tentative, and weak.
Recent Development and News in Construction Equipment Market In Europe
- In January 2024, Caterpillar Inc., a leading construction equipment manufacturer, announced the launch of its new electric compact excavator, the 320 XE, in Europe. This marks the company's continued investment in electric construction equipment, aiming to reduce emissions and improve sustainability (Caterpillar Press Release, 2024).
- In March 2024, Volvo Construction Equipment and Gehlquist Group, a leading dealer in Scandinavia, signed a strategic partnership agreement. This collaboration aimed to enhance Volvo's sales and service network in the region, ensuring better customer support and growth (Volvo Construction Equipment Press Release, 2024).
- In May 2024, Liebherr-International AG, a major construction equipment manufacturer, completed the acquisition of the French concrete pump manufacturer, Schwing-Stetter. This strategic move expanded Liebherr's product portfolio and market presence in Europe (Liebherr Press Release, 2024).
- In January 2025, the European Union (EU) approved the new Machinery Regulation (EU) 2024/1111, which sets new safety, environmental, and information requirements for construction equipment. This regulation, effective from July 2025, aims to improve safety standards and reduce emissions across the European construction sector (EU Press Release, 2025).
Research Analyst Overview
The European construction equipment market continues to evolve, driven by advancements in technology and shifting industry dynamics. Housing rates and construction activity remain key sectors, with earthmoving machinery, such as excavators, and transportation infrastructure projects, including transportation sector applications, seeing significant growth. Automation is a significant trend, with crawler cranes and loaders and backhoes incorporating AI-based twin technology to enhance efficiency and productivity. The transportation sector also witnesses the adoption of electric and hybrid vehicles, including light-duty vehicles and inland waterway vessels, as emission norms become increasingly stringent. The construction industry embraces digitalization, with IoT and virtual reality technologies transforming the way projects are planned and executed.
In the realm of heavy machinery, engine technologies evolve to meet sustainability goals, with IC engines and diesel alternatives, such as diesel particulate filters and electric vehicles, gaining traction. The market's continuous unfolding is reflected in the emergence of new applications, such as telescopic handling and augmented reality, which are poised to revolutionize the industry. Construction pumps, concrete mixers, motor graders, and pavers are other essential components that undergo constant innovation to meet the evolving needs of the sector.
In the transportation infrastructure sector, railroad engines and road networks are subject to similar technological advancements, with gasoline and diesel engines being replaced by cleaner alternatives. The market's dynamic nature ensures a constant flow of new developments and applications, making it an exciting and ever-evolving landscape for businesses and investors alike.
Dive into Technavio's strong research methodology, blending expert interviews, extensive data synthesis, and validated models for unparalleled Construction Equipment Market in Europe insights. See full methodology.
|
Market Scope |
|
|
Report Coverage |
Details |
|
Page number |
228 |
|
Base year |
2024 |
|
Historic period |
2019-2023 |
|
Forecast period |
2025-2029 |
|
Growth momentum & CAGR |
Accelerate at a CAGR of 3.9% |
|
Market growth 2025-2029 |
USD 6.91 billion |
|
Market structure |
Fragmented |
|
YoY growth 2024-2025(%) |
3.7 |
|
Key countries |
UK, Germany, France, Italy, and Rest of Europe |
|
Competitive landscape |
Leading Companies, Market Positioning of Companies, Competitive Strategies, and Industry Risks |
What are the Key Data Covered in this Market Research and Growth Report?
- CAGR of the market during the forecast period
- Detailed information on factors that will drive the market growth and forecasting between 2025 and 2029
- Precise estimation of the size of the market and its contribution of the market in focus to the parent market
- Accurate predictions about upcoming market growth and trends and changes in consumer behaviour
- Growth of the market across Europe
- Thorough analysis of the market's competitive landscape and detailed information about companies
- Comprehensive analysis of factors that will challenge the growth of market companies
We can help! Our analysts can customize this market research report to meet your requirements. Get in touch
 RIA -
RIA - 
