Construction Materials Market Analysis, Size, and Forecast 2026-2030: APAC (China, Japan, and India), Europe (Germany, UK, and France), North America (US, Canada, and Mexico), Middle East and Africa (Saudi Arabia, UAE, and South Africa), South America (Brazil and Argentina), and Rest of World (ROW)

Construction Materials Market Analysis, Size, and Forecast 2026-2030:
APAC (China, Japan, and India), Europe (Germany, UK, and France), North America (US, Canada, and Mexico), Middle East and Africa (Saudi Arabia, UAE, and South Africa), South America (Brazil and Argentina), and Rest of World (ROW)

Published: Mar 2026 309 Pages SKU: IRTNTR70477

Market Overview at a Glance

$1219.5 B
Market Opportunity
10.1%
CAGR 2025 - 2030
43.7%
APAC Growth
$781.7 B
Cement segment 2024

Construction Materials Market Size 2026-2030

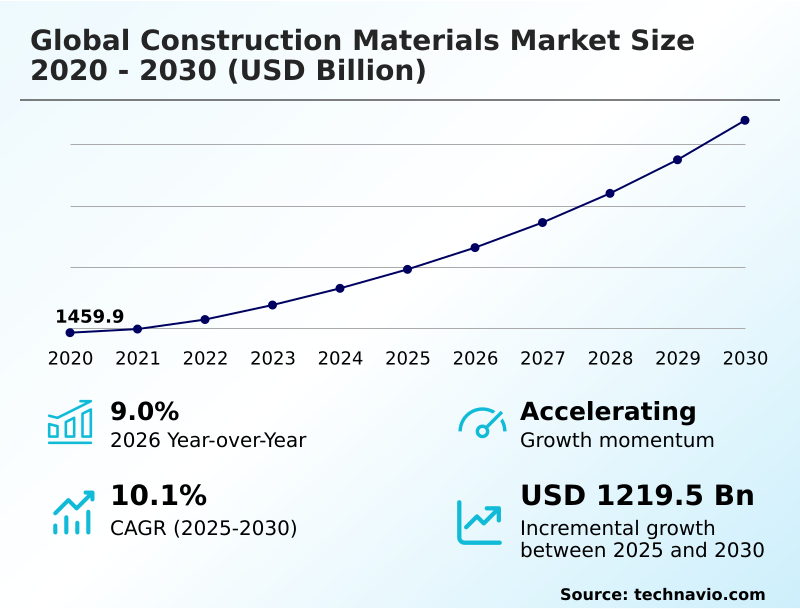
The construction materials market size is valued to increase by USD 1219.5 billion, at a CAGR of 10.1% from 2025 to 2030. Increasing number of smart cities will drive the construction materials market.

Major Market Trends & Insights

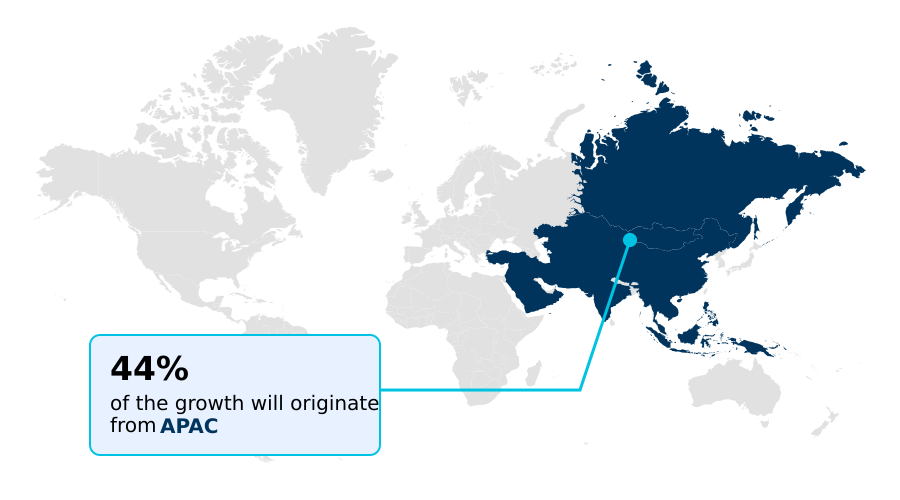
  • APAC dominated the market and accounted for a 43.7% growth during the forecast period.
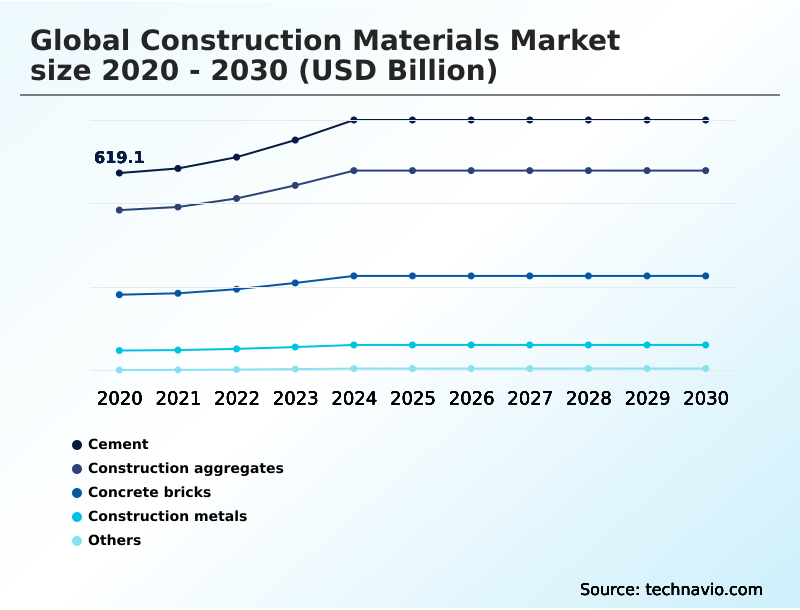
  • By Product - Cement segment was valued at USD 781.7 billion in 2024
  • By End-user - Commercial segment accounted for the largest market revenue share in 2024

Market Size & Forecast

  • Market Opportunities: USD 1737.6 billion
  • Market Future Opportunities: USD 1219.5 billion
  • CAGR from 2025 to 2030 : 10.1%

Market Summary

  • The construction materials market is foundational to global economic development, driven by rapid urbanization, population growth, and extensive government investment in infrastructure. A significant shift toward sustainability is reshaping the industry, with stringent environmental regulations and green building standards compelling a move from traditional materials to innovative, low-carbon alternatives.
  • This has spurred the development of eco-friendly products like low-carbon cement, recycled construction materials, and engineered wood, which are increasingly specified to meet green building certifications.
  • For instance, a contractor managing a large-scale urban development project must now navigate complex supply chains to source materials that not only meet structural requirements but also comply with embodied carbon limits, impacting procurement strategies and project costs.
  • Technological advancements, particularly Building Information Modeling (BIM) and material science innovations such as self-healing concrete, are further enhancing efficiency, optimizing resource usage, and positioning the construction materials market for continued, albeit more complex, evolution.

What will be the Size of the Construction Materials Market during the forecast period?

Get Key Insights on Market Forecast (PDF) Request Free Sample

How is the Construction Materials Market Segmented?

The construction materials industry research report provides comprehensive data (region-wise segment analysis), with forecasts and estimates in "USD billion" for the period 2026-2030, as well as historical data from 2020-2024 for the following segments.

  • Product
    • Cement
    • Construction aggregates
    • Concrete bricks
    • Construction metals
    • Others
  • End-user
    • Commercial
    • Industrial
    • Residential
  • Distribution channel
    • Direct sales
    • Distributors
    • Online retail
    • Specialty stores
  • Geography
    • APAC
      • China
      • Japan
      • India
    • Europe
      • Germany
      • UK
      • France
    • North America
      • US
      • Canada
      • Mexico
    • Middle East and Africa
      • Saudi Arabia
      • UAE
      • South Africa
    • South America
      • Brazil
      • Argentina
    • Rest of World (ROW)

By Product Insights

The cement segment is estimated to witness significant growth during the forecast period.

The cement segment is undergoing a significant transformation, driven by a focus on circular economy principles and stricter environmental regulations.

Demand is shifting from traditional formulations toward low-carbon cement and portland-limestone cement, which utilize supplementary cementitious materials to achieve embodied carbon reduction. This evolution, crucial for meeting net-zero building goals, requires a rigorous lifecycle assessment for new products.

Innovations in this area, while distinct from green steel production, are vital for developing the next generation of high-performance concrete.

The adoption of these advanced cementitious solutions now accounts for over 20% of material specifications in new urban infrastructure projects, demonstrating a clear market pivot toward sustainability and advanced material science, including building-integrated photovoltaics and smart glass technology.

Request Free Sample

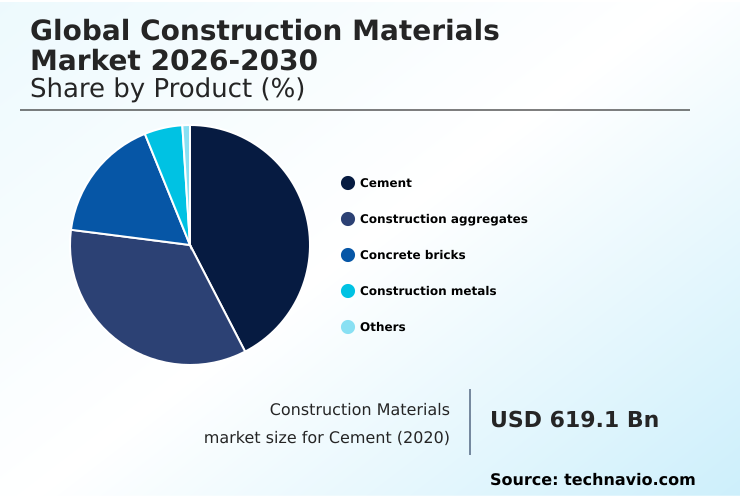
The Cement segment was valued at USD 781.7 billion in 2024 and showed a gradual increase during the forecast period.

Request Free Sample

Regional Analysis

APAC is estimated to contribute 43.7% to the growth of the global market during the forecast period.Technavio’s analysts have elaborately explained the regional trends and drivers that shape the market during the forecast period.

See How Construction Materials Market Demand is Rising in APAC Request Free Sample

The global construction materials market is geographically dominated by the APAC region, which accounts for over 43% of the incremental growth, driven by rapid urbanization and massive infrastructure spending in countries like China and India.

This region exhibits a high-volume demand for traditional products like structural steel and materials for high-performance concrete, but there is also a discernible shift toward sustainable solutions like engineered wood products.

In contrast, the mature markets of North America and Europe, which contribute a combined share of over 42% to market expansion, focus on high-value renovation and retrofitting.

These regions prioritize advanced building composites and structural insulated panels to meet stringent green building certification requirements.

The adoption of prefabricated components in Europe has been shown to reduce on-site waste by up to 25%, reflecting a strong commitment to circular economy principles.

Market Dynamics

Our researchers analyzed the data with 2025 as the base year, along with the key drivers, trends, and challenges. A holistic analysis of drivers will help companies refine their marketing strategies to gain a competitive advantage.

  • Strategic decision-making in the global construction materials market increasingly requires a deep understanding of specific material performance and economic trade-offs. For example, the impact of green steel on construction costs is a critical variable for developers of large-scale commercial projects, as initial premium pricing must be weighed against long-term sustainability benefits and regulatory compliance.
  • Similarly, evaluating the performance of bio-based insulation in cold climates is essential for residential builders aiming to meet stringent energy efficiency standards. A comprehensive lifecycle analysis of recycled aggregates in concrete helps infrastructure planners meet circular economy targets, with some studies showing it can reduce the need for virgin materials by up to 25% without compromising structural integrity.
  • Further advancements in 3d printed construction materials are poised to disrupt traditional building timelines, while the role of fiber-reinforced polymers in retrofitting aging infrastructure offers a cost-effective alternative to complete replacement. These nuanced considerations are reshaping how firms approach material selection, procurement, and project design.

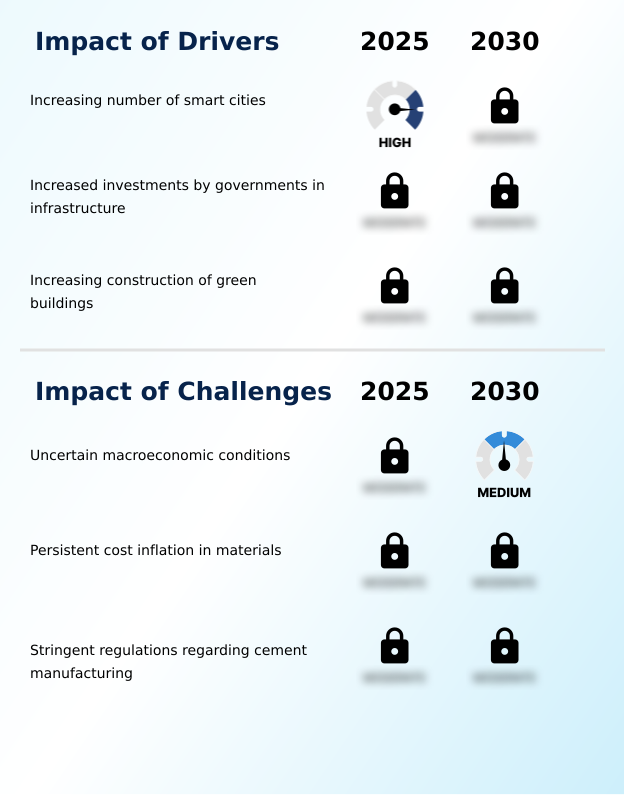
What are the key market drivers leading to the rise in the adoption of Construction Materials Industry?

  • The increasing development of smart cities worldwide is a significant driver, fueling demand for innovative and technologically integrated construction materials.

  • Market growth is significantly propelled by government-led infrastructure modernization and the global push for sustainable urban development.
  • Investments in public works are fueling demand for foundational products like structural steel and precast concrete elements, with spending in some emerging economies increasing by over 10% annually.
  • The rise of smart cities necessitates the use of advanced materials, including those for building-integrated photovoltaics and intelligent structural monitoring. Green building initiatives are also a major driver, increasing the specification of autoclaved aerated concrete and cross-laminated timber.
  • The demand for materials that support decarbonization, such as those used in green steel production and low-carbon cement formulations, is accelerating.
  • This dynamic environment is creating substantial opportunities for suppliers of innovative and eco-efficient building solutions, such as fly ash bricks.

What are the market trends shaping the Construction Materials Industry?

  • The adoption of advanced technologies to enhance operational efficiency and productivity is a prominent trend shaping the market. This includes digitalization, automation, and innovative data management solutions to address long-standing industry challenges.

  • The market is undergoing a significant transformation driven by the adoption of innovative products and processes. There is a strong trend toward using lightweight materials such as lightweight concrete blocks and advanced building composites to reduce structural loads and enhance design flexibility.
  • The use of recycled aggregates and other recycled construction materials is becoming mainstream, with adoption rates increasing by over 15% in regulated markets. Technologies like building information modeling are optimizing material usage, while the demand for high-performance concrete and engineered wood products grows.
  • Innovations in smart glass technology and low-emissivity coatings are improving energy efficiency in commercial buildings, and the adoption of geosynthetic materials is enhancing infrastructure resilience. This evolution reflects a broader industry shift toward materials that deliver superior performance, efficiency, and sustainability.

What challenges does the Construction Materials Industry face during its growth?

  • Uncertain macroeconomic conditions, including slowing economic growth and high inflation, present a key challenge that can impede market growth by delaying projects.

  • The market faces significant hurdles from persistent cost inflation and supply chain volatility, which have increased the price of key inputs like high-strength steel alloys and portland-limestone cement by over 20% in recent periods. Uncertain macroeconomic conditions are delaying project financing, while stringent regulations on cement manufacturing add compliance burdens.
  • The industry must also contend with the complexities of integrating modern methods of construction and ensuring material traceability solutions across fragmented supply networks. The initial high cost of adopting innovative materials such as self-healing concrete and fiber-reinforced polymers presents a barrier for some contractors.
  • Furthermore, the operational shifts required for off-site manufacturing and the use of structural insulated panels challenge traditional business models, creating a complex operating environment.

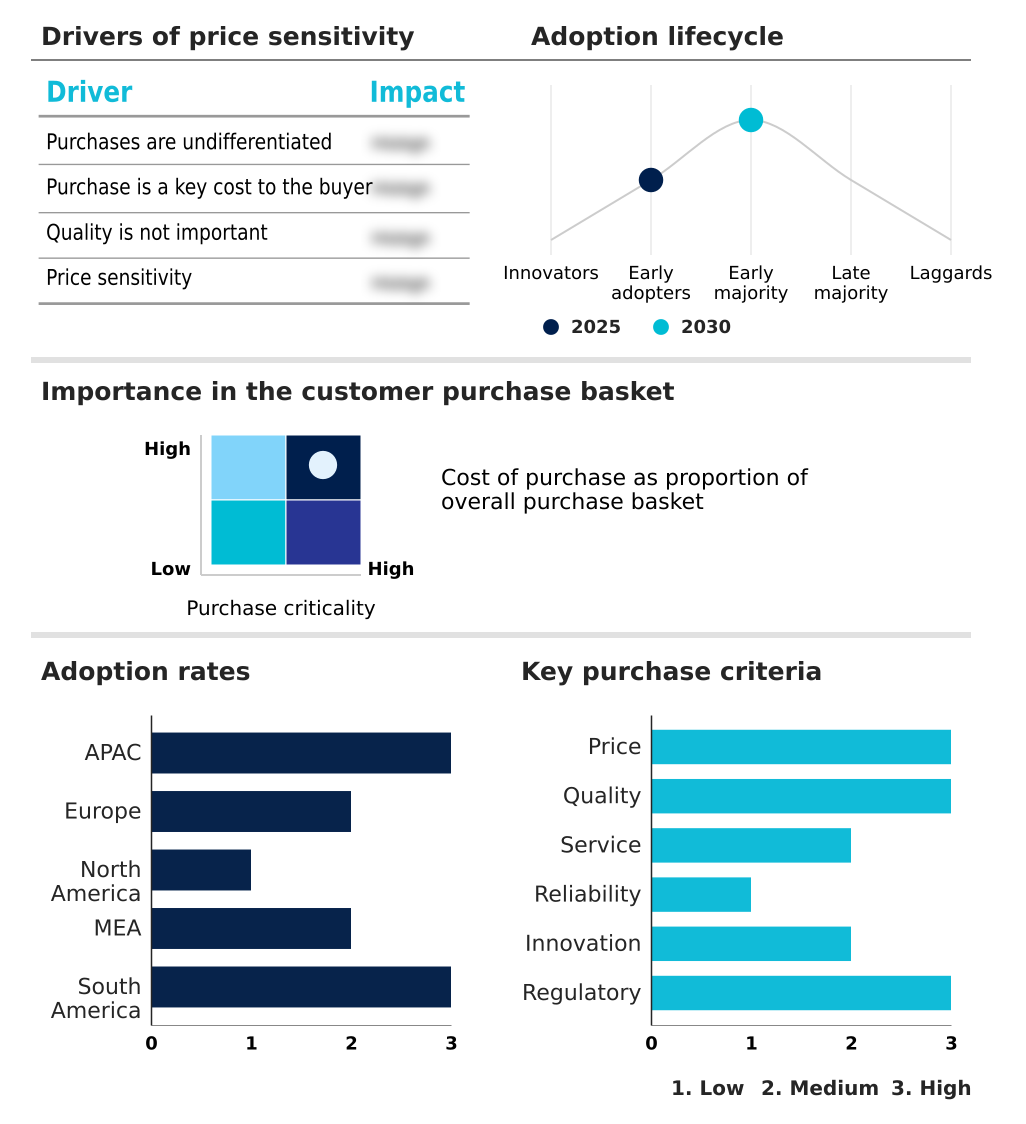
Exclusive Technavio Analysis on Customer Landscape

The construction materials market forecasting report includes the adoption lifecycle of the market, covering from the innovator’s stage to the laggard’s stage. It focuses on adoption rates in different regions based on penetration. Furthermore, the construction materials market report also includes key purchase criteria and drivers of price sensitivity to help companies evaluate and develop their market growth analysis strategies.

Customer Landscape of Construction Materials Industry

Competitive Landscape

Companies are implementing various strategies, such as strategic alliances, construction materials market forecast, partnerships, mergers and acquisitions, geographical expansion, and product/service launches, to enhance their presence in the industry.

Ambuja Cements Ltd. - Key offerings include a diverse portfolio of cement and clinker for domestic and export markets, featuring specialized products for high-strength and dense concrete applications.

The industry research and growth report includes detailed analyses of the competitive landscape of the market and information about key companies, including:

  • Ambuja Cements Ltd.
  • ArcelorMittal SA
  • Boral Ltd.
  • Buzzi S.p.A.
  • Compagnie de Saint Gobain SA
  • CRH Plc
  • EUROCEMENT Group
  • Everest Industries Ltd.
  • Forterra Building Products Ltd.
  • Grasim Industries Ltd.
  • Heidelberg Materials AG
  • Holcim Ltd.
  • INTERCEMENT PARTICIPACOES SA
  • JK Cement Ltd
  • Knauf Digital GmbH
  • LIXIL Corp.
  • Sika AG
  • Taiwan Cement Corp
  • UltraTech Cement Ltd.
  • Vicat

Qualitative and quantitative analysis of companies has been conducted to help clients understand the wider business environment as well as the strengths and weaknesses of key industry players. Data is qualitatively analyzed to categorize companies as pure play, category-focused, industry-focused, and diversified; it is quantitatively analyzed to categorize companies as dominant, leading, strong, tentative, and weak.

Recent Development and News in Construction materials market

  • In September 2025, CRH Plc completed its acquisition of Eco Material Technologies, a leading supplier of supplementary cementitious materials, to bolster its portfolio of low-carbon solutions for the North American construction market.
  • In June 2025, Compagnie de Saint Gobain SA acquired Maturix, a technology firm specializing in wireless sensors for real-time concrete curing monitoring, to integrate into its digital platform for construction chemicals.
  • In February 2025, Holcim Ltd. announced the launch of its ECOPact Prime series, a new range of low-carbon concrete that reduces CO2 emissions by up to 50% compared to standard concrete, targeting green building projects.
  • In November 2024, ArcelorMittal SA entered a strategic partnership with a renewable energy provider to power its European steel mills, advancing its objective of large-scale green steel production for the construction industry.

Dive into Technavio’s robust research methodology, blending expert interviews, extensive data synthesis, and validated models for unparalleled Construction Materials Market insights. See full methodology.

Market Scope
Page number 309
Base year 2025
Historic period 2020-2024
Forecast period 2026-2030
Growth momentum & CAGR Accelerate at a CAGR of 10.1%
Market growth 2026-2030 USD 1219.5 billion
Market structure Fragmented
YoY growth 2025-2026(%) 9.0%
Key countries China, Japan, India, South Korea, Australia, Indonesia, Germany, UK, France, Italy, Spain, The Netherlands, US, Canada, Mexico, Saudi Arabia, UAE, South Africa, Israel, Turkey, Brazil, Argentina and Chile
Competitive landscape Leading Companies, Market Positioning of Companies, Competitive Strategies, and Industry Risks

Request Free Sample

Research Analyst Overview

  • The construction materials market is defined by a crucial pivot toward sustainable and high-performance solutions. The industry is moving beyond conventional products to adopt innovative materials such as low-carbon cement, recycled aggregates, and cross-laminated timber. This transition is driven by stringent environmental regulations and the need for greater efficiency in construction.
  • For boardroom-level strategy, the focus has shifted to integrating materials like autoclaved aerated concrete and high-performance concrete to meet green building standards. The adoption of supplementary cementitious materials and portland-limestone cement is becoming widespread. Companies are also exploring advanced building composites and engineered wood products. Innovations such as self-healing concrete and fiber-reinforced polymers are gaining traction for specialized applications.
  • The push for decarbonization is accelerating green steel production and the use of structural insulated panels. Modular construction components and lightweight concrete blocks are key to improving on-site productivity, with some firms achieving a 20% reduction in assembly time. Materials like fly ash bricks, low-emissivity coatings, and high-strength steel alloys are also becoming standard.
  • The development of smart glass technology and building-integrated photovoltaics further underscores the market's technological evolution, involving geosynthetic materials and precast concrete elements.

What are the Key Data Covered in this Construction Materials Market Research and Growth Report?

  • What is the expected growth of the Construction Materials Market between 2026 and 2030?

    • USD 1219.5 billion, at a CAGR of 10.1%

  • What segmentation does the market report cover?

    • The report is segmented by Product (Cement, Construction aggregates, Concrete bricks, Construction metals, and Others), End-user (Commercial, Industrial, and Residential), Distribution Channel (Direct sales, Distributors, Online retail, and Specialty stores) and Geography (APAC, Europe, North America, Middle East and Africa, South America)

  • Which regions are analyzed in the report?

    • APAC, Europe, North America, Middle East and Africa and South America

  • What are the key growth drivers and market challenges?

    • Increasing number of smart cities, Uncertain macroeconomic conditions

  • Who are the major players in the Construction Materials Market?

    • Ambuja Cements Ltd., ArcelorMittal SA, Boral Ltd., Buzzi S.p.A., Compagnie de Saint Gobain SA, CRH Plc, EUROCEMENT Group, Everest Industries Ltd., Forterra Building Products Ltd., Grasim Industries Ltd., Heidelberg Materials AG, Holcim Ltd., INTERCEMENT PARTICIPACOES SA, JK Cement Ltd, Knauf Digital GmbH, LIXIL Corp., Sika AG, Taiwan Cement Corp, UltraTech Cement Ltd. and Vicat

Market Research Insights

  • The market is shaped by a strategic push toward modern methods of construction, where digital procurement platforms and off-site manufacturing are becoming standard. This shift drives efficiency, with projects adopting prefabricated building systems reporting construction timeline reductions of up to 30%. Concurrently, an emphasis on resilient infrastructure design is increasing the use of materials that meet stringent seismic retrofitting standards.
  • Material traceability solutions are also gaining traction, offering greater transparency and improving supply chain integrity by over 15% in certain applications. The adoption of automated construction robotics and advanced material science is pivotal as the industry addresses persistent labor shortages and strives for higher productivity.

We can help! Our analysts can customize this construction materials market research report to meet your requirements.

Get in touch

1. Executive Summary

1.1 Market overview

Executive Summary - Chart on Market Overview
Executive Summary - Data Table on Market Overview
Executive Summary - Chart on Global Market Characteristics
Executive Summary - Chart on Market by Geography
Executive Summary - Chart on Market Segmentation by Product
Executive Summary - Chart on Market Segmentation by End-user
Executive Summary - Chart on Market Segmentation by Distribution Channel
Executive Summary - Chart on Incremental Growth
Executive Summary - Data Table on Incremental Growth
Executive Summary - Chart on Company Market Positioning

2. Technavio Analysis

2.1 Analysis of price sensitivity, lifecycle, customer purchase basket, adoption rates, and purchase criteria

2.2 Criticality of inputs and Factors of differentiation

Chart on Overview on criticality of inputs and factors of differentiation

2.3 Factors of disruption

Chart on Overview on factors of disruption

2.4 Impact of drivers and challenges

Chart on Impact of drivers and challenges in 2025 and 2030

3. Market Landscape

3.1 Market ecosystem

Chart on Parent Market
Data Table on - Parent Market

3.2 Market characteristics

Chart on Market characteristics analysis

3.3 Value chain analysis

Chart on Value chain analysis

4. Market Sizing

4.1 Market definition

Data Table on Offerings of companies included in the market definition

4.2 Market segment analysis

Market segments

4.3 Market size 2025

4.4 Market outlook: Forecast for 2025-2030

Chart on Global - Market size and forecast 2025-2030 ($ billion)
Data Table on Global - Market size and forecast 2025-2030 ($ billion)
Chart on Global Market: Year-over-year growth 2025-2030 (%)
Data Table on Global Market: Year-over-year growth 2025-2030 (%)

5. Historic Market Size

5.1 Global Construction Materials Market 2020 - 2024

Historic Market Size - Data Table on Global Construction Materials Market 2020 - 2024 ($ billion)

5.2 Product segment analysis 2020 - 2024

Historic Market Size - Product Segment 2020 - 2024 ($ billion)

5.3 End-user segment analysis 2020 - 2024

Historic Market Size - End-user Segment 2020 - 2024 ($ billion)

5.4 Distribution Channel segment analysis 2020 - 2024

Historic Market Size - Distribution Channel Segment 2020 - 2024 ($ billion)

5.5 Geography segment analysis 2020 - 2024

Historic Market Size - Geography Segment 2020 - 2024 ($ billion)

5.6 Country segment analysis 2020 - 2024

Historic Market Size - Country Segment 2020 - 2024 ($ billion)

6. Qualitative Analysis

6.1 The impact of AI in the Global Construction Materials Market

7. Five Forces Analysis

7.1 Five forces summary

Five forces analysis - Comparison between 2025 and 2030

7.2 Bargaining power of buyers

Bargaining power of buyers - Impact of key factors 2025 and 2030

7.3 Bargaining power of suppliers

Bargaining power of suppliers - Impact of key factors in 2025 and 2030

7.4 Threat of new entrants

Threat of new entrants - Impact of key factors in 2025 and 2030

7.5 Threat of substitutes

Threat of substitutes - Impact of key factors in 2025 and 2030

7.6 Threat of rivalry

Threat of rivalry - Impact of key factors in 2025 and 2030

7.7 Market condition

Chart on Market condition - Five forces 2025 and 2030

8. Market Segmentation by Product

8.1 Market segments

Chart on Product - Market share 2025-2030 (%)
Data Table on Product - Market share 2025-2030 (%)

8.2 Comparison by Product

Chart on Comparison by Product
Data Table on Comparison by Product

8.3 Cement - Market size and forecast 2025-2030

Chart on Cement - Market size and forecast 2025-2030 ($ billion)
Data Table on Cement - Market size and forecast 2025-2030 ($ billion)
Chart on Cement - Year-over-year growth 2025-2030 (%)
Data Table on Cement - Year-over-year growth 2025-2030 (%)

8.4 Construction aggregates - Market size and forecast 2025-2030

Chart on Construction aggregates - Market size and forecast 2025-2030 ($ billion)
Data Table on Construction aggregates - Market size and forecast 2025-2030 ($ billion)
Chart on Construction aggregates - Year-over-year growth 2025-2030 (%)
Data Table on Construction aggregates - Year-over-year growth 2025-2030 (%)

8.5 Concrete bricks - Market size and forecast 2025-2030

Chart on Concrete bricks - Market size and forecast 2025-2030 ($ billion)
Data Table on Concrete bricks - Market size and forecast 2025-2030 ($ billion)
Chart on Concrete bricks - Year-over-year growth 2025-2030 (%)
Data Table on Concrete bricks - Year-over-year growth 2025-2030 (%)

8.6 Construction metals - Market size and forecast 2025-2030

Chart on Construction metals - Market size and forecast 2025-2030 ($ billion)
Data Table on Construction metals - Market size and forecast 2025-2030 ($ billion)
Chart on Construction metals - Year-over-year growth 2025-2030 (%)
Data Table on Construction metals - Year-over-year growth 2025-2030 (%)

8.7 Others - Market size and forecast 2025-2030

Chart on Others - Market size and forecast 2025-2030 ($ billion)
Data Table on Others - Market size and forecast 2025-2030 ($ billion)
Chart on Others - Year-over-year growth 2025-2030 (%)
Data Table on Others - Year-over-year growth 2025-2030 (%)

8.8 Market opportunity by Product

Market opportunity by Product ($ billion)
Data Table on Market opportunity by Product ($ billion)

9. Market Segmentation by End-user

9.1 Market segments

Chart on End-user - Market share 2025-2030 (%)
Data Table on End-user - Market share 2025-2030 (%)

9.2 Comparison by End-user

Chart on Comparison by End-user
Data Table on Comparison by End-user

9.3 Commercial - Market size and forecast 2025-2030

Chart on Commercial - Market size and forecast 2025-2030 ($ billion)
Data Table on Commercial - Market size and forecast 2025-2030 ($ billion)
Chart on Commercial - Year-over-year growth 2025-2030 (%)
Data Table on Commercial - Year-over-year growth 2025-2030 (%)

9.4 Industrial - Market size and forecast 2025-2030

Chart on Industrial - Market size and forecast 2025-2030 ($ billion)
Data Table on Industrial - Market size and forecast 2025-2030 ($ billion)
Chart on Industrial - Year-over-year growth 2025-2030 (%)
Data Table on Industrial - Year-over-year growth 2025-2030 (%)

9.5 Residential - Market size and forecast 2025-2030

Chart on Residential - Market size and forecast 2025-2030 ($ billion)
Data Table on Residential - Market size and forecast 2025-2030 ($ billion)
Chart on Residential - Year-over-year growth 2025-2030 (%)
Data Table on Residential - Year-over-year growth 2025-2030 (%)

9.6 Market opportunity by End-user

Market opportunity by End-user ($ billion)
Data Table on Market opportunity by End-user ($ billion)

10. Market Segmentation by Distribution Channel

10.1 Market segments

Chart on Distribution Channel - Market share 2025-2030 (%)
Data Table on Distribution Channel - Market share 2025-2030 (%)

10.2 Comparison by Distribution Channel

Chart on Comparison by Distribution Channel
Data Table on Comparison by Distribution Channel

10.3 Direct sales - Market size and forecast 2025-2030

Chart on Direct sales - Market size and forecast 2025-2030 ($ billion)
Data Table on Direct sales - Market size and forecast 2025-2030 ($ billion)
Chart on Direct sales - Year-over-year growth 2025-2030 (%)
Data Table on Direct sales - Year-over-year growth 2025-2030 (%)

10.4 Distributors - Market size and forecast 2025-2030

Chart on Distributors - Market size and forecast 2025-2030 ($ billion)
Data Table on Distributors - Market size and forecast 2025-2030 ($ billion)
Chart on Distributors - Year-over-year growth 2025-2030 (%)
Data Table on Distributors - Year-over-year growth 2025-2030 (%)

10.5 Online retail - Market size and forecast 2025-2030

Chart on Online retail - Market size and forecast 2025-2030 ($ billion)
Data Table on Online retail - Market size and forecast 2025-2030 ($ billion)
Chart on Online retail - Year-over-year growth 2025-2030 (%)
Data Table on Online retail - Year-over-year growth 2025-2030 (%)

10.6 Specialty stores - Market size and forecast 2025-2030

Chart on Specialty stores - Market size and forecast 2025-2030 ($ billion)
Data Table on Specialty stores - Market size and forecast 2025-2030 ($ billion)
Chart on Specialty stores - Year-over-year growth 2025-2030 (%)
Data Table on Specialty stores - Year-over-year growth 2025-2030 (%)

10.7 Market opportunity by Distribution Channel

Market opportunity by Distribution Channel ($ billion)
Data Table on Market opportunity by Distribution Channel ($ billion)

11. Customer Landscape

11.1 Customer landscape overview

Analysis of price sensitivity, lifecycle, customer purchase basket, adoption rates, and purchase criteria

12. Geographic Landscape

12.1 Geographic segmentation

Chart on Market share by geography 2025-2030 (%)
Data Table on Market share by geography 2025-2030 (%)

12.2 Geographic comparison

Chart on Geographic comparison
Data Table on Geographic comparison

12.3 APAC - Market size and forecast 2025-2030

Chart on APAC - Market size and forecast 2025-2030 ($ billion)
Data Table on APAC - Market size and forecast 2025-2030 ($ billion)
Chart on APAC - Year-over-year growth 2025-2030 (%)
Data Table on APAC - Year-over-year growth 2025-2030 (%)
Chart on Regional Comparison - APAC
Data Table on Regional Comparison - APAC

12.3.1 China - Market size and forecast 2025-2030

Chart on China - Market size and forecast 2025-2030 ($ billion)
Data Table on China - Market size and forecast 2025-2030 ($ billion)
Chart on China - Year-over-year growth 2025-2030 (%)
Data Table on China - Year-over-year growth 2025-2030 (%)

12.3.2 Japan - Market size and forecast 2025-2030

Chart on Japan - Market size and forecast 2025-2030 ($ billion)
Data Table on Japan - Market size and forecast 2025-2030 ($ billion)
Chart on Japan - Year-over-year growth 2025-2030 (%)
Data Table on Japan - Year-over-year growth 2025-2030 (%)

12.3.3 India - Market size and forecast 2025-2030

Chart on India - Market size and forecast 2025-2030 ($ billion)
Data Table on India - Market size and forecast 2025-2030 ($ billion)
Chart on India - Year-over-year growth 2025-2030 (%)
Data Table on India - Year-over-year growth 2025-2030 (%)

12.3.4 South Korea - Market size and forecast 2025-2030

Chart on South Korea - Market size and forecast 2025-2030 ($ billion)
Data Table on South Korea - Market size and forecast 2025-2030 ($ billion)
Chart on South Korea - Year-over-year growth 2025-2030 (%)
Data Table on South Korea - Year-over-year growth 2025-2030 (%)

12.3.5 Australia - Market size and forecast 2025-2030

Chart on Australia - Market size and forecast 2025-2030 ($ billion)
Data Table on Australia - Market size and forecast 2025-2030 ($ billion)
Chart on Australia - Year-over-year growth 2025-2030 (%)
Data Table on Australia - Year-over-year growth 2025-2030 (%)

12.3.6 Indonesia - Market size and forecast 2025-2030

Chart on Indonesia - Market size and forecast 2025-2030 ($ billion)
Data Table on Indonesia - Market size and forecast 2025-2030 ($ billion)
Chart on Indonesia - Year-over-year growth 2025-2030 (%)
Data Table on Indonesia - Year-over-year growth 2025-2030 (%)

12.4 Europe - Market size and forecast 2025-2030

Chart on Europe - Market size and forecast 2025-2030 ($ billion)
Data Table on Europe - Market size and forecast 2025-2030 ($ billion)
Chart on Europe - Year-over-year growth 2025-2030 (%)
Data Table on Europe - Year-over-year growth 2025-2030 (%)
Chart on Regional Comparison - Europe
Data Table on Regional Comparison - Europe

12.4.1 Germany - Market size and forecast 2025-2030

Chart on Germany - Market size and forecast 2025-2030 ($ billion)
Data Table on Germany - Market size and forecast 2025-2030 ($ billion)
Chart on Germany - Year-over-year growth 2025-2030 (%)
Data Table on Germany - Year-over-year growth 2025-2030 (%)

12.4.2 UK - Market size and forecast 2025-2030

Chart on UK - Market size and forecast 2025-2030 ($ billion)
Data Table on UK - Market size and forecast 2025-2030 ($ billion)
Chart on UK - Year-over-year growth 2025-2030 (%)
Data Table on UK - Year-over-year growth 2025-2030 (%)

12.4.3 France - Market size and forecast 2025-2030

Chart on France - Market size and forecast 2025-2030 ($ billion)
Data Table on France - Market size and forecast 2025-2030 ($ billion)
Chart on France - Year-over-year growth 2025-2030 (%)
Data Table on France - Year-over-year growth 2025-2030 (%)

12.4.4 Italy - Market size and forecast 2025-2030

Chart on Italy - Market size and forecast 2025-2030 ($ billion)
Data Table on Italy - Market size and forecast 2025-2030 ($ billion)
Chart on Italy - Year-over-year growth 2025-2030 (%)
Data Table on Italy - Year-over-year growth 2025-2030 (%)

12.4.5 Spain - Market size and forecast 2025-2030

Chart on Spain - Market size and forecast 2025-2030 ($ billion)
Data Table on Spain - Market size and forecast 2025-2030 ($ billion)
Chart on Spain - Year-over-year growth 2025-2030 (%)
Data Table on Spain - Year-over-year growth 2025-2030 (%)

12.4.6 The Netherlands - Market size and forecast 2025-2030

Chart on The Netherlands - Market size and forecast 2025-2030 ($ billion)
Data Table on The Netherlands - Market size and forecast 2025-2030 ($ billion)
Chart on The Netherlands - Year-over-year growth 2025-2030 (%)
Data Table on The Netherlands - Year-over-year growth 2025-2030 (%)

12.5 North America - Market size and forecast 2025-2030

Chart on North America - Market size and forecast 2025-2030 ($ billion)
Data Table on North America - Market size and forecast 2025-2030 ($ billion)
Chart on North America - Year-over-year growth 2025-2030 (%)
Data Table on North America - Year-over-year growth 2025-2030 (%)
Chart on Regional Comparison - North America
Data Table on Regional Comparison - North America

12.5.1 US - Market size and forecast 2025-2030

Chart on US - Market size and forecast 2025-2030 ($ billion)
Data Table on US - Market size and forecast 2025-2030 ($ billion)
Chart on US - Year-over-year growth 2025-2030 (%)
Data Table on US - Year-over-year growth 2025-2030 (%)

12.5.2 Canada - Market size and forecast 2025-2030

Chart on Canada - Market size and forecast 2025-2030 ($ billion)
Data Table on Canada - Market size and forecast 2025-2030 ($ billion)
Chart on Canada - Year-over-year growth 2025-2030 (%)
Data Table on Canada - Year-over-year growth 2025-2030 (%)

12.5.3 Mexico - Market size and forecast 2025-2030

Chart on Mexico - Market size and forecast 2025-2030 ($ billion)
Data Table on Mexico - Market size and forecast 2025-2030 ($ billion)
Chart on Mexico - Year-over-year growth 2025-2030 (%)
Data Table on Mexico - Year-over-year growth 2025-2030 (%)

12.6 Middle East and Africa - Market size and forecast 2025-2030

Chart on Middle East and Africa - Market size and forecast 2025-2030 ($ billion)
Data Table on Middle East and Africa - Market size and forecast 2025-2030 ($ billion)
Chart on Middle East and Africa - Year-over-year growth 2025-2030 (%)
Data Table on Middle East and Africa - Year-over-year growth 2025-2030 (%)
Chart on Regional Comparison - Middle East and Africa
Data Table on Regional Comparison - Middle East and Africa

12.6.1 Saudi Arabia - Market size and forecast 2025-2030

Chart on Saudi Arabia - Market size and forecast 2025-2030 ($ billion)
Data Table on Saudi Arabia - Market size and forecast 2025-2030 ($ billion)
Chart on Saudi Arabia - Year-over-year growth 2025-2030 (%)
Data Table on Saudi Arabia - Year-over-year growth 2025-2030 (%)

12.6.2 UAE - Market size and forecast 2025-2030

Chart on UAE - Market size and forecast 2025-2030 ($ billion)
Data Table on UAE - Market size and forecast 2025-2030 ($ billion)
Chart on UAE - Year-over-year growth 2025-2030 (%)
Data Table on UAE - Year-over-year growth 2025-2030 (%)

12.6.3 South Africa - Market size and forecast 2025-2030

Chart on South Africa - Market size and forecast 2025-2030 ($ billion)
Data Table on South Africa - Market size and forecast 2025-2030 ($ billion)
Chart on South Africa - Year-over-year growth 2025-2030 (%)
Data Table on South Africa - Year-over-year growth 2025-2030 (%)

12.6.4 Israel - Market size and forecast 2025-2030

Chart on Israel - Market size and forecast 2025-2030 ($ billion)
Data Table on Israel - Market size and forecast 2025-2030 ($ billion)
Chart on Israel - Year-over-year growth 2025-2030 (%)
Data Table on Israel - Year-over-year growth 2025-2030 (%)

12.6.5 Turkey - Market size and forecast 2025-2030

Chart on Turkey - Market size and forecast 2025-2030 ($ billion)
Data Table on Turkey - Market size and forecast 2025-2030 ($ billion)
Chart on Turkey - Year-over-year growth 2025-2030 (%)
Data Table on Turkey - Year-over-year growth 2025-2030 (%)

12.7 South America - Market size and forecast 2025-2030

Chart on South America - Market size and forecast 2025-2030 ($ billion)
Data Table on South America - Market size and forecast 2025-2030 ($ billion)
Chart on South America - Year-over-year growth 2025-2030 (%)
Data Table on South America - Year-over-year growth 2025-2030 (%)
Chart on Regional Comparison - South America
Data Table on Regional Comparison - South America

12.7.1 Brazil - Market size and forecast 2025-2030

Chart on Brazil - Market size and forecast 2025-2030 ($ billion)
Data Table on Brazil - Market size and forecast 2025-2030 ($ billion)
Chart on Brazil - Year-over-year growth 2025-2030 (%)
Data Table on Brazil - Year-over-year growth 2025-2030 (%)

12.7.2 Argentina - Market size and forecast 2025-2030

Chart on Argentina - Market size and forecast 2025-2030 ($ billion)
Data Table on Argentina - Market size and forecast 2025-2030 ($ billion)
Chart on Argentina - Year-over-year growth 2025-2030 (%)
Data Table on Argentina - Year-over-year growth 2025-2030 (%)

12.7.3 Chile - Market size and forecast 2025-2030

Chart on Chile - Market size and forecast 2025-2030 ($ billion)
Data Table on Chile - Market size and forecast 2025-2030 ($ billion)
Chart on Chile - Year-over-year growth 2025-2030 (%)
Data Table on Chile - Year-over-year growth 2025-2030 (%)

12.8 Market opportunity by geography

Market opportunity by geography ($ billion)
Data Tables on Market opportunity by geography ($ billion)

13. Drivers, Challenges, and Opportunity

13.1 Market drivers

Increasing number of smart cities
Increased investments by governments in infrastructure
Increasing construction of green buildings

13.2 Market challenges

Uncertain macroeconomic conditions
Persistent cost inflation in materials
Stringent regulations regarding cement manufacturing

13.3 Impact of drivers and challenges

Impact of drivers and challenges in 2025 and 2030

13.4 Market opportunities

Adoption of technologies to improve efficiency
Introduction of smart and self-curing concrete materials and ferrocement
Adoption of new construction materials

14. Competitive Landscape

14.1 Overview

14.2

Overview on criticality of inputs and factors of differentiation

14.3 Landscape disruption

Overview on factors of disruption

14.4 Industry risks

Impact of key risks on business

15. Competitive Analysis

15.1 Companies profiled

Companies covered

15.2 Company ranking index

15.3 Market positioning of companies

Matrix on companies position and classification

15.4 Ambuja Cements Ltd.

Ambuja Cements Ltd. - Overview
Ambuja Cements Ltd. - Product / Service
Ambuja Cements Ltd. - Key offerings
SWOT

15.5 ArcelorMittal SA

ArcelorMittal SA - Overview
ArcelorMittal SA - Business segments
ArcelorMittal SA - Key news
ArcelorMittal SA - Key offerings
ArcelorMittal SA - Segment focus
SWOT

15.6 Boral Ltd.

Boral Ltd. - Overview
Boral Ltd. - Business segments
Boral Ltd. - Key offerings
Boral Ltd. - Segment focus
SWOT

15.7 Compagnie de Saint Gobain SA

Compagnie de Saint Gobain SA - Overview
Compagnie de Saint Gobain SA - Business segments
Compagnie de Saint Gobain SA - Key news
Compagnie de Saint Gobain SA - Key offerings
Compagnie de Saint Gobain SA - Segment focus
SWOT

15.8 CRH Plc

CRH Plc - Overview
CRH Plc - Business segments
CRH Plc - Key news
CRH Plc - Key offerings
CRH Plc - Segment focus
SWOT

15.9 Everest Industries Ltd.

Everest Industries Ltd. - Overview
Everest Industries Ltd. - Product / Service
Everest Industries Ltd. - Key offerings
SWOT

15.10 Forterra Building Products Ltd.

Forterra Building Products Ltd. - Overview
Forterra Building Products Ltd. - Product / Service
Forterra Building Products Ltd. - Key offerings
SWOT

15.11 Grasim Industries Ltd.

Grasim Industries Ltd. - Overview
Grasim Industries Ltd. - Business segments
Grasim Industries Ltd. - Key offerings
Grasim Industries Ltd. - Segment focus
SWOT

15.12 Heidelberg Materials AG

Heidelberg Materials AG - Overview
Heidelberg Materials AG - Business segments
Heidelberg Materials AG - Key news
Heidelberg Materials AG - Key offerings
Heidelberg Materials AG - Segment focus
SWOT

15.13 Holcim Ltd.

Holcim Ltd. - Overview
Holcim Ltd. - Business segments
Holcim Ltd. - Key news
Holcim Ltd. - Key offerings
Holcim Ltd. - Segment focus
SWOT

15.14 INTERCEMENT PARTICIPACOES SA

INTERCEMENT PARTICIPACOES SA - Overview
INTERCEMENT PARTICIPACOES SA - Product / Service
INTERCEMENT PARTICIPACOES SA - Key offerings
SWOT

15.15 JK Cement Ltd

JK Cement Ltd - Overview
JK Cement Ltd - Product / Service
JK Cement Ltd - Key offerings
SWOT

15.16 Knauf Digital GmbH

Knauf Digital GmbH - Overview
Knauf Digital GmbH - Product / Service
Knauf Digital GmbH - Key offerings
SWOT

15.17 Sika AG

Sika AG - Overview
Sika AG - Business segments
Sika AG - Key news
Sika AG - Key offerings
Sika AG - Segment focus
SWOT

15.18 Taiwan Cement Corp

Taiwan Cement Corp - Overview
Taiwan Cement Corp - Business segments
Taiwan Cement Corp - Key offerings
Taiwan Cement Corp - Segment focus
SWOT

16. Appendix

16.1 Scope of the report

Market definition
Objectives
Notes and caveats

16.2 Inclusions and exclusions checklist

Inclusions checklist
Exclusions checklist

16.3 Currency conversion rates for US$

16.4 Research methodology

16.5 Data procurement

Information sources

16.6 Data validation

16.7 Validation techniques employed for market sizing

16.8 Data synthesis

16.9 360 degree market analysis

16.10 List of abbreviations

Research Methodology

Technavio presents a detailed picture of the market by way of study, synthesis, and summation of data from multiple sources. The analysts have presented the various facets of the market with a particular focus on identifying the key industry influencers. The data thus presented is comprehensive, reliable, and the result of extensive research, both primary and secondary.

INFORMATION SOURCES

Primary sources

  • Manufacturers and suppliers
  • Channel partners
  • Industry experts
  • Strategic decision makers

Secondary sources

  • Industry journals and periodicals
  • Government data
  • Financial reports of key industry players
  • Historical data
  • Press releases

DATA ANALYSIS

Data Synthesis

  • Collation of data
  • Estimation of key figures
  • Analysis of derived insights

Data Validation

  • Triangulation with data models
  • Reference against proprietary databases
  • Corroboration with industry experts

REPORT WRITING

Qualitative

  • Market drivers
  • Market challenges
  • Market trends
  • Five forces analysis

Quantitative

  • Market size and forecast
  • Market segmentation
  • Geographical insights
  • Competitive landscape

Interested in this report?

Get your sample now to see our research methodology and insights!

Download Now

Frequently Asked Questions

Construction Materials market growth will increase by USD 1219.5 billion during 2026-2030.

The Construction Materials market is expected to grow at a CAGR of 10.1% during 2026-2030.

Construction Materials market is segmented by Product (Cement, Construction aggregates, Concrete bricks, Construction metals, Others) End-user (Commercial, Industrial, Residential) Distribution channel (Direct sales, Distributors, Online retail, Specialty stores)

Ambuja Cements Ltd., ArcelorMittal SA, Boral Ltd., Buzzi S.p.A., Compagnie de Saint Gobain SA, CRH Plc, EUROCEMENT Group, Everest Industries Ltd., Forterra Building Products Ltd., Grasim Industries Ltd., Heidelberg Materials AG, Holcim Ltd., INTERCEMENT PARTICIPACOES SA, JK Cement Ltd, Knauf Digital GmbH, LIXIL Corp., Sika AG, Taiwan Cement Corp, UltraTech Cement Ltd., Vicat are a few of the key vendors in the Construction Materials market.

APAC will register the highest growth rate of 43.7% among the other regions. Therefore, the Construction Materials market in APAC is expected to garner significant business opportunities for the vendors during the forecast period.

China, Japan, India, South Korea, Australia, Indonesia, Germany, UK, France, Italy, Spain, The Netherlands, US, Canada, Mexico, Saudi Arabia, UAE, South Africa, Israel, Turkey, Brazil, Argentina, Chile

  • Increasing number of smart cities is the driving factor this market.

The Construction Materials market vendors should focus on grabbing business opportunities from the Product segment as it accounted for the largest market share in the base year.
RIA - Research AI Assistant
Ask RIA