India Consumer Electronics And Home Appliances Market Size 2026-2030
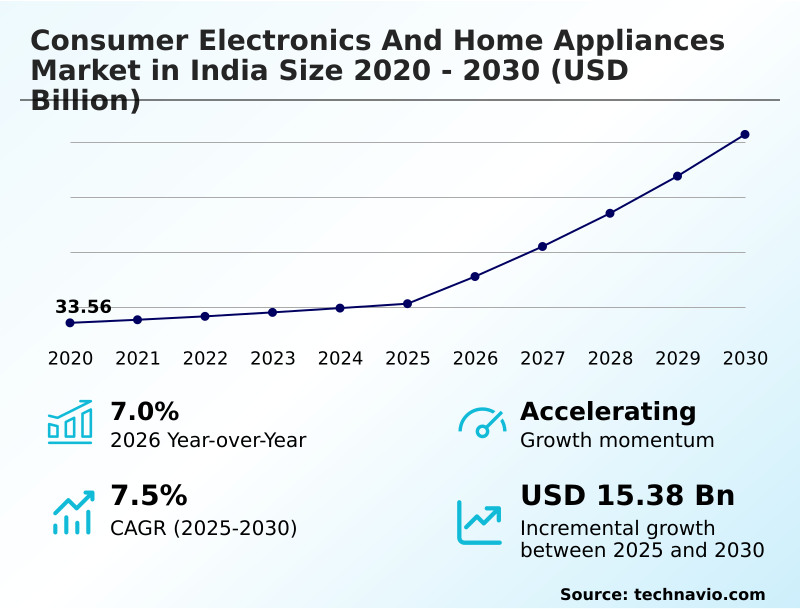
The india consumer electronics and home appliances market size is valued to increase by USD 15.38 billion, at a CAGR of 7.5% from 2025 to 2030. Growth in government initiatives for electronic products will drive the india consumer electronics and home appliances market.
Major Market Trends & Insights
- By Product - Consumer electronics segment was valued at USD 24.40 billion in 2024
- By Distribution Channel - Offline segment accounted for the largest market revenue share in 2024
Market Size & Forecast
- Market Opportunities: USD 17.13 billion
- Market Future Opportunities: USD 15.38 billion
- CAGR from 2025 to 2030 : 7.5%
Market Summary
- The consumer electronics and home appliances market in India is characterized by a rapid evolution in both technology and consumer expectations. A significant driver is the government's push for domestic manufacturing, which encourages the local production of items equipped with features like an inverter cooling system and turbo drum technology.
- Concurrently, a prominent trend is the increasing consumer appetite for premium, connected devices that are part of a larger smart home ecosystem. This demand is met with products featuring IoT connectivity and AI-driven functionalities. For instance, a manufacturer must strategically navigate complex BIS certification and BEE star rating requirements to ensure compliance for its new line of energy-efficient air conditioners.
- This involves not only redesigning products to meet stringent energy consumption standards but also managing the supply chain for critical components like advanced semiconductors and OLED display panels. This balancing act between innovation, regulatory adherence, and supply chain efficiency defines the competitive landscape, where success depends on integrating advanced technology while managing the complexities of e-waste management and production costs.
What will be the Size of the India Consumer Electronics And Home Appliances Market during the forecast period?
Get Key Insights on Market Forecast (PDF) Get Free Sample
How is the India Consumer Electronics And Home Appliances Market Segmented?
The india consumer electronics and home appliances industry research report provides comprehensive data (region-wise segment analysis), with forecasts and estimates in "USD million" for the period 2026-2030, as well as historical data from 2020-2024 for the following segments.
- Product
- Consumer electronics
- Home appliances
- Distribution channel
- Offline
- Online
- Price range
- Mid-range
- Premium
- Entry-level
- Geography
- APAC
- India
- APAC
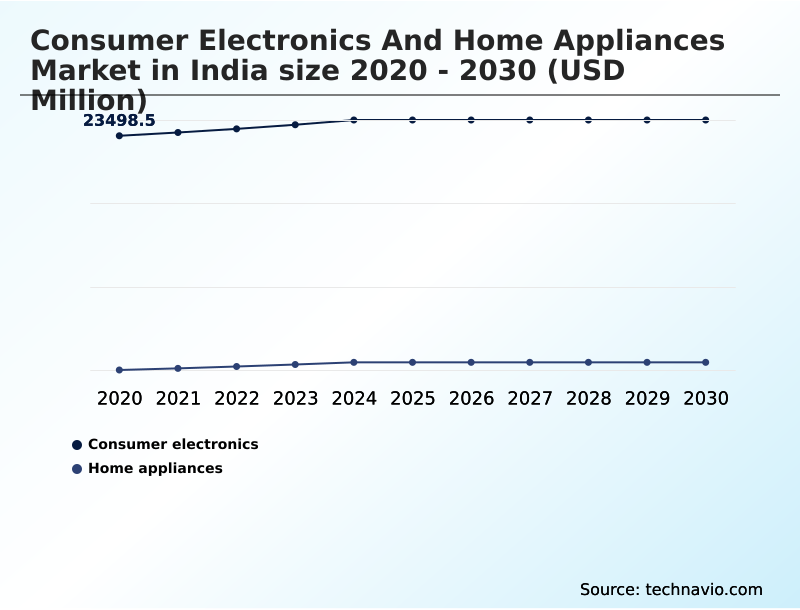
By Product Insights
The consumer electronics segment is estimated to witness significant growth during the forecast period.
The consumer electronics sector is undergoing a significant transformation, driven by heightened internet penetration and the broad acceptance of IoT technology.
The market is shifting away from basic functional items toward devices offering advanced connectivity and smart capabilities, expanding at a rate exceeding 7.0% annually.
This evolution is evident in the demand for products featuring an inverter cooling system and advanced semiconductors, which are integral to modern home automation systems.
The integration of a smart home ecosystem is becoming a standard expectation, influencing both product development and consumer purchasing criteria.
Key to this segment's expansion is the focus on smart home integration and the development of connected home devices that align with modern kitchen layouts, reflecting a strategic pivot to meet sophisticated user demands.
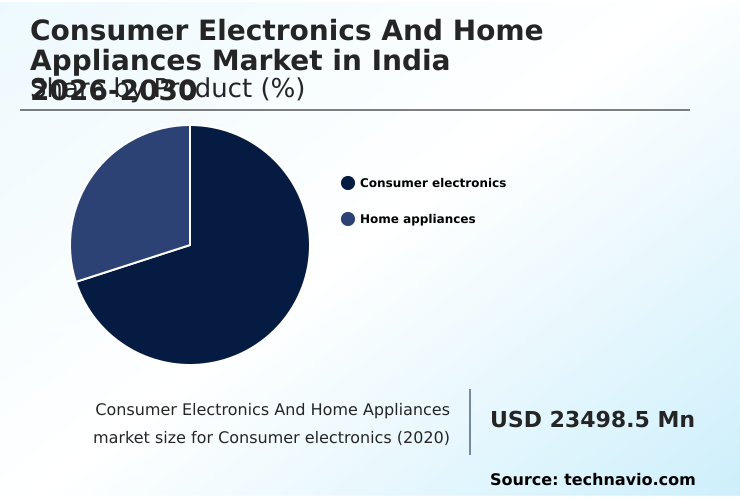
The Consumer electronics segment was valued at USD 24.40 billion in 2024 and showed a gradual increase during the forecast period.
Market Dynamics
Our researchers analyzed the data with 2025 as the base year, along with the key drivers, trends, and challenges. A holistic analysis of drivers will help companies refine their marketing strategies to gain a competitive advantage.
- The strategic direction of the consumer electronics and home appliances market in India is shaped by a complex interplay of regulatory frameworks and technological advancements. The impact of FDI on electronics manufacturing is profoundly positive, stimulating local production and competition. Simultaneously, the role of the PLI scheme in home appliances is crucial for reducing import dependency for key components.
- This creates an environment where consumer preference for premium smart TVs with QLED televisions and cognitive processor XR technology can be met more effectively by domestic assembly lines. However, manufacturers face significant operational hurdles.
- Navigating intricate e-waste management rules presents a logistical challenge that is operationally distinct from meeting energy efficiency standards for air conditioners, where compliance can improve margins by reducing material and energy costs. The advancements in robotic vacuum cleaner technology and the growing demand for built-in kitchen appliances highlight a trend towards automation and integrated living.
- This is compounded by data privacy concerns in smart refrigerators, which require robust security protocols. Furthermore, the supply chain for semiconductor components remains a critical vulnerability, affecting the production of everything from basic appliances to sophisticated electronics.
- Success hinges on a company's ability to balance innovation, manage the challenges of omnichannel retail strategy for consumer durables, and adapt to evolving consumer demands and regulatory pressures.
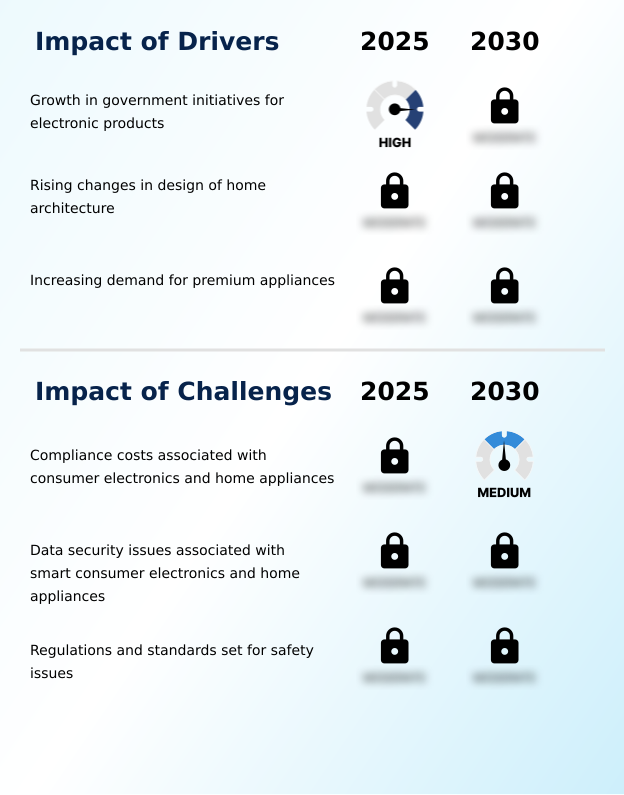
What are the key market drivers leading to the rise in the adoption of India Consumer Electronics And Home Appliances Industry?
- Growth in government initiatives supporting domestic manufacturing and foreign investment for electronic products is a key driver for the market.
- Market growth is significantly propelled by supportive government policies and evolving consumer lifestyles. Initiatives promoting 100% foreign direct investment in manufacturing are creating a robust ecosystem for product development.
- This is complemented by the near-universal household electrification rate of 99.99%, which has vastly expanded the addressable market. Urbanization is also a key factor, influencing modern home designs and increasing the demand for space-efficient, multifunctional home solutions.
- These architectural shifts are driving sales of products that fit compact appliance design principles.
- As a result, the market is experiencing strong momentum, underpinned by a favorable regulatory environment, expanding infrastructure, and the changing needs of urban living appliances which are increasingly sought after by consumers.
What are the market trends shaping the India Consumer Electronics And Home Appliances Industry?
- The adoption of smart and advanced features in home appliances is a prominent market trend. This shift is driven by consumer demand for convenience, connectivity, and remote monitoring capabilities.
- Key trends are reshaping the market, driven by consumer demand for efficiency and connectivity. The adoption of smart grid technology is pivotal, enabling appliances to optimize power usage, with some energy-efficient products reducing consumption by over 50%.
- This push for efficiency is mirrored in the design of direct-cool refrigerators and semi-automatic washing machines, which are being engineered for lower operational costs. There's a growing appetite for premium appliance features, reflecting a shift in consumer priorities toward performance and convenience.
- Furthermore, the market is seeing a convergence of functionality, with voice-enabled air conditioners and automated home cleaning systems gaining traction. This evolution highlights a clear movement towards more intelligent and sustainable household management solutions, compelling manufacturers to innovate continually.
What challenges does the India Consumer Electronics And Home Appliances Industry face during its growth?
- The increasing compliance costs associated with evolving energy efficiency and safety standards for consumer electronics and home appliances present a key challenge to industry growth.
- The market faces notable challenges related to regulatory compliance and technological risks. The frequent updating of home appliance regulations, with some energy standards changing almost biennially, imposes significant redesign and testing costs on manufacturers. This creates complexity in maintaining compliance with consumer electronics safety standards.
- In parallel, the proliferation of connected devices raises serious concerns around smart appliance security, as vulnerabilities can expose user data. Addressing these issues requires substantial investment in both compliance management and cybersecurity measures.
- These factors, combined with the need to adhere to strict production protocols, create a challenging operating environment where managing costs and mitigating risks are paramount for sustained growth.
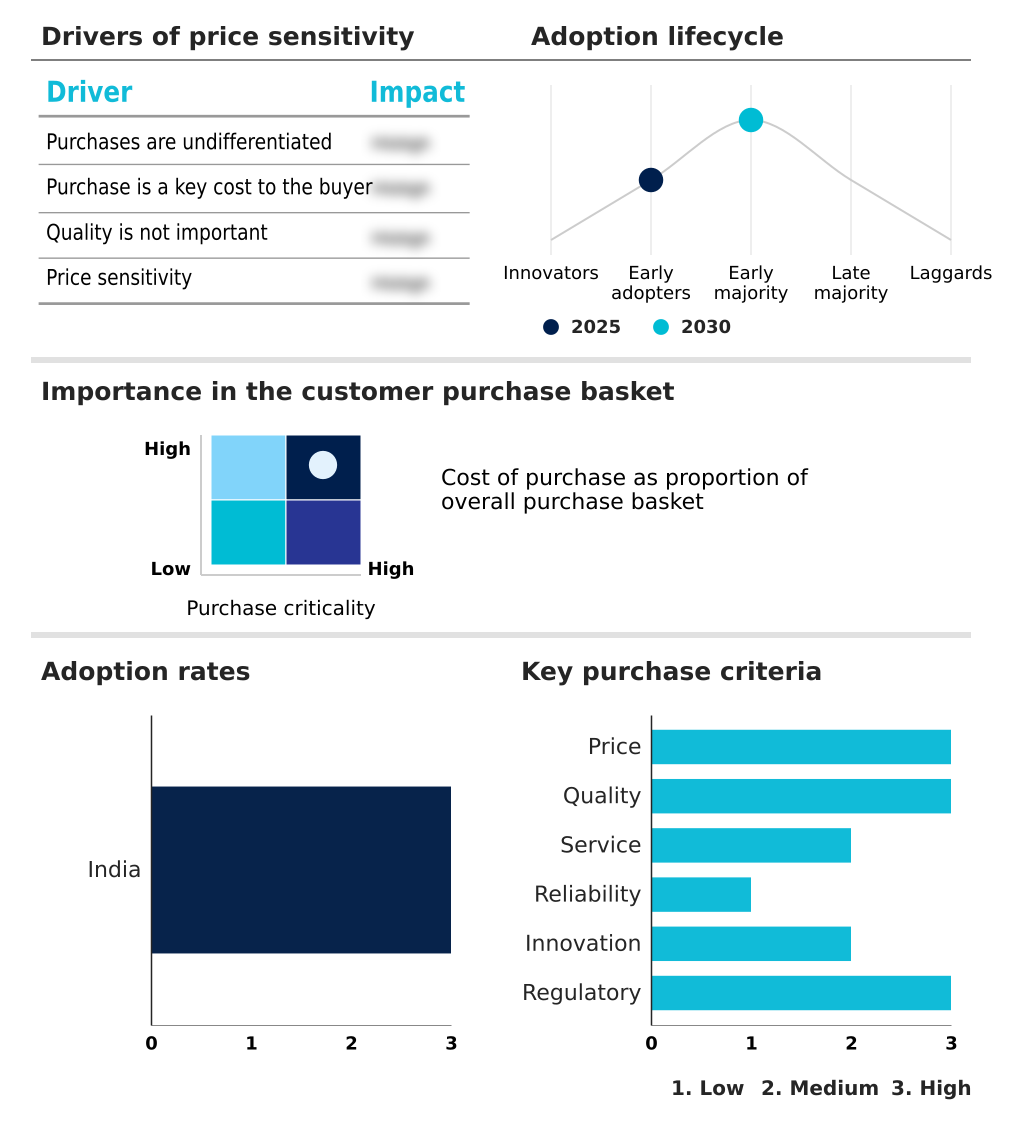
Exclusive Technavio Analysis on Customer Landscape
The india consumer electronics and home appliances market forecasting report includes the adoption lifecycle of the market, covering from the innovator’s stage to the laggard’s stage. It focuses on adoption rates in different regions based on penetration. Furthermore, the india consumer electronics and home appliances market report also includes key purchase criteria and drivers of price sensitivity to help companies evaluate and develop their market growth analysis strategies.
Customer Landscape of India Consumer Electronics And Home Appliances Industry
Competitive Landscape
Companies are implementing various strategies, such as strategic alliances, india consumer electronics and home appliances market forecast, partnerships, mergers and acquisitions, geographical expansion, and product/service launches, to enhance their presence in the industry.
AB Electrolux - Key offerings focus on integrated smart home solutions, emphasizing energy efficiency, advanced connectivity, and enhanced user convenience through AI-driven features.
The industry research and growth report includes detailed analyses of the competitive landscape of the market and information about key companies, including:
- AB Electrolux
- Arcelik A.S.
- Bajaj Electricals Ltd.
- Blue Star Ltd.
- Haier Smart Home Co. Ltd.
- Havells India Ltd.
- Hitachi Ltd.
- Irobot Corp.
- Koninklijke Philips NV
- LG Electronics Inc.
- Midea Group Co. Ltd.
- Miele and Cie. KG
- Panasonic Holdings Corp.
- Robert Bosch GmbH
- Samsung Electronics Co. Ltd.
- Sony Group Corp.
- Toshiba Corp.
- Usha International Ltd.
- Voltas Ltd.
- Whirlpool Corp.
Qualitative and quantitative analysis of companies has been conducted to help clients understand the wider business environment as well as the strengths and weaknesses of key industry players. Data is qualitatively analyzed to categorize companies as pure play, category-focused, industry-focused, and diversified; it is quantitatively analyzed to categorize companies as dominant, leading, strong, tentative, and weak.
Recent Development and News in India consumer electronics and home appliances market
- In May 2025, BSH Home Appliances launched its new XXL Top Freezer Refrigerator range in India, featuring large capacities and smart cooling technology to cater to modern household storage needs.
- In May 2025, LG Electronics announced a USD 600 million investment in its third manufacturing plant in Sri City, Andhra Pradesh, to enhance its production capacity and research and development capabilities in India.
- In April 2025, Samsung introduced its Bespoke AI series of air conditioners and refrigerators in the Indian market, featuring AI algorithms optimized for local power supply conditions.
- In January 2025, the government of India is expected to enforce The Safety of Household, Commercial and Similar Electrical Appliances (Quality Control) Order-QCO 2025, mandating stricter BIS certification for a wide range of electronic products.
Dive into Technavio’s robust research methodology, blending expert interviews, extensive data synthesis, and validated models for unparalleled India Consumer Electronics And Home Appliances Market insights. See full methodology.
| Market Scope | |
|---|---|
| Page number | 185 |
| Base year | 2025 |
| Historic period | 2020-2024 |
| Forecast period | 2026-2030 |
| Growth momentum & CAGR | Accelerate at a CAGR of 7.5% |
| Market growth 2026-2030 | USD 15380.9 million |
| Market structure | Fragmented |
| YoY growth 2025-2026(%) | 7.0% |
| Key countries | India |
| Competitive landscape | Leading Companies, Market Positioning of Companies, Competitive Strategies, and Industry Risks |
Research Analyst Overview
- The consumer electronics and home appliances market in India is advancing through significant technological integration and a focus on premiumization. The adoption of AI-driven functionalities and IoT connectivity is transforming standard products into elements of a cohesive smart home ecosystem.
- Key product innovations include the frost self-clean feature in air conditioners and advanced turbo drum technology in washing machines, which enhance user convenience and operational efficiency. Central to this evolution is the integration of advanced semiconductors and high-definition OLED display panels, which are critical for delivering superior performance in premium devices.
- However, navigating the regulatory environment, which includes stringent BEE star rating requirements and complex BIS certification processes, remains a primary operational challenge. For instance, adherence to updated energy protocols can lead to products that reduce energy consumption by over 50%, a compelling value proposition for consumers.
- This dynamic necessitates a strategic focus on R&D to develop energy-efficient construction while also managing the complexities of e-waste management and the sourcing of critical components, shaping the competitive landscape for all participants.
What are the Key Data Covered in this India Consumer Electronics And Home Appliances Market Research and Growth Report?
-
What is the expected growth of the India Consumer Electronics And Home Appliances Market between 2026 and 2030?
-
USD 15.38 billion, at a CAGR of 7.5%
-
-
What segmentation does the market report cover?
-
The report is segmented by Product (Consumer electronics, and Home appliances), Distribution Channel (Offline, and Online), Price Range (Mid-range, Premium, and Entry-level) and Geography (APAC)
-
-
Which regions are analyzed in the report?
-
APAC
-
-
What are the key growth drivers and market challenges?
-
Growth in government initiatives for electronic products, Compliance costs associated with consumer electronics and home appliances
-
-
Who are the major players in the India Consumer Electronics And Home Appliances Market?
-
AB Electrolux, Arcelik A.S., Bajaj Electricals Ltd., Blue Star Ltd., Haier Smart Home Co. Ltd., Havells India Ltd., Hitachi Ltd., Irobot Corp., Koninklijke Philips NV, LG Electronics Inc., Midea Group Co. Ltd., Miele and Cie. KG, Panasonic Holdings Corp., Robert Bosch GmbH, Samsung Electronics Co. Ltd., Sony Group Corp., Toshiba Corp., Usha International Ltd., Voltas Ltd. and Whirlpool Corp.
-
Market Research Insights
- The market's dynamics are heavily influenced by the convergence of technological adoption and shifting consumer values. A key factor is the heightened focus on household energy efficiency, with updated energy consumption standards enabling certain appliances to reduce power use by up to 50%. This aligns with a growing preference for sustainable home technology.
- Furthermore, with the national electrical grid now reaching nearly 100% of households, a vast new consumer base has emerged, fundamentally reshaping the last-mile distribution network and creating opportunities for both digital retail channels and traditional stores. This expansion, coupled with readily available consumer financing options, is making modern appliances more accessible.
- Firms are responding by adapting their product lifecycle management to cater to this diverse and evolving market, where remote device monitoring is becoming a standard feature.
We can help! Our analysts can customize this india consumer electronics and home appliances market research report to meet your requirements.
 RIA -
RIA - 
