Commercial Kitchen Knives Market Analysis, Size, and Forecast 2026-2030: APAC (China, Japan, and India), North America (US, Canada, and Mexico), Europe (Germany, UK, and France), Middle East and Africa (Saudi Arabia, UAE, and South Africa), South America (Brazil and Argentina), and Rest of World (ROW)

Commercial Kitchen Knives Market Analysis, Size, and Forecast 2026-2030:
APAC (China, Japan, and India), North America (US, Canada, and Mexico), Europe (Germany, UK, and France), Middle East and Africa (Saudi Arabia, UAE, and South Africa), South America (Brazil and Argentina), and Rest of World (ROW)

Published: Mar 2026 294 Pages SKU: IRTNTR41358

Market Overview at a Glance

$191.3 Mn
Market Opportunity
5.9%
CAGR 2025 - 2030
46.8%
APAC Growth
$220.4 Mn
Chefs knives segment 2024

Commercial Kitchen Knives Market Size 2026-2030

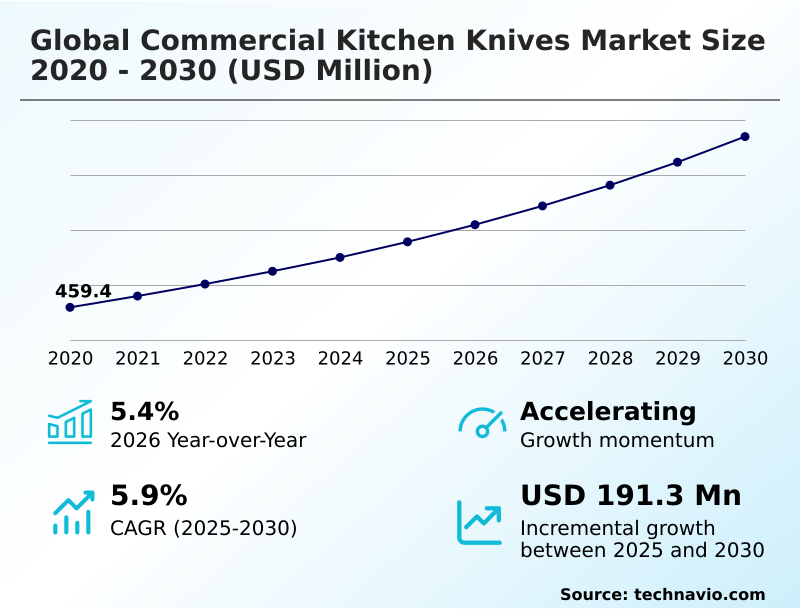
The commercial kitchen knives market size is valued to increase by USD 191.3 million, at a CAGR of 5.9% from 2025 to 2030. Expansion of hospitality sector and culinary tourism will drive the commercial kitchen knives market.

Major Market Trends & Insights

  • APAC dominated the market and accounted for a 46.8% growth during the forecast period.
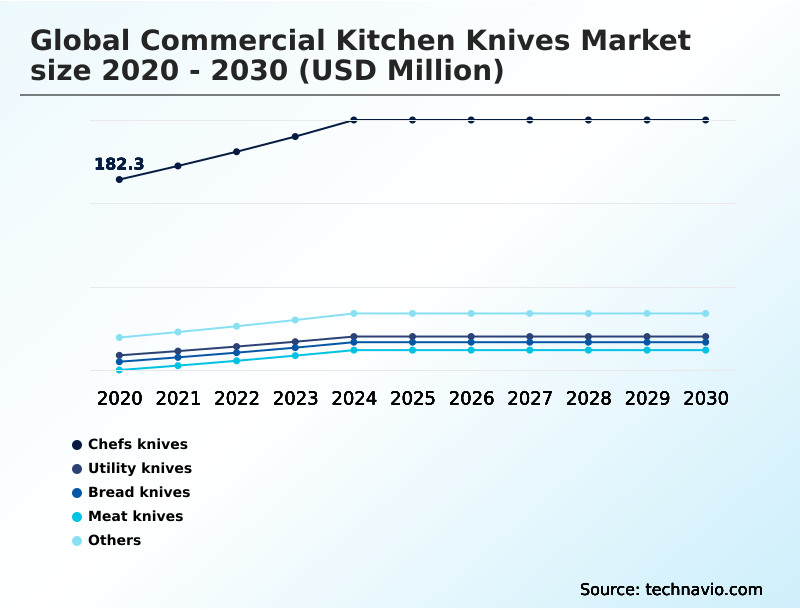
  • By Type - Chefs knives segment was valued at USD 220.4 million in 2024
  • By Distribution Channel - Offline segment accounted for the largest market revenue share in 2024

Market Size & Forecast

  • Market Opportunities: USD 310.4 million
  • Market Future Opportunities: USD 191.3 million
  • CAGR from 2025 to 2030 : 5.9%

Market Summary

  • The commercial kitchen knives market is shaped by the operational demands of the global food service industry, where efficiency and safety are paramount. Growth is propelled by the expansion of the hospitality sector and a heightened focus on occupational health, leading to innovations in ergonomic design and material science.
  • Establishments are increasingly adopting knives with superior edge retention and corrosion resistance to minimize downtime and maintenance costs. A key trend is the integration of technology, such as RFID tags for inventory management, transforming knives into connected assets within a smart kitchen ecosystem. However, the industry faces challenges from raw material price volatility and the proliferation of counterfeit products.
  • For instance, a large hotel chain might implement a leasing program for smart-tracked knife kits, optimizing their procurement budget by leveraging predictive purchasing data and reducing losses from theft, which directly improves operational efficiency without a large capital outlay. This reflects a broader shift towards data-driven asset management in professional culinary environments.

What will be the Size of the Commercial Kitchen Knives Market during the forecast period?

Get Key Insights on Market Forecast (PDF) Request Free Sample

How is the Commercial Kitchen Knives Market Segmented?

The commercial kitchen knives industry research report provides comprehensive data (region-wise segment analysis), with forecasts and estimates in "USD million" for the period 2026-2030, as well as historical data from 2020-2024 for the following segments.

  • Type
    • Chefs knives
    • Utility knives
    • Bread knives
    • Meat knives
    • Others
  • Distribution channel
    • Offline
    • Online
  • End-user
    • HoReCa
    • Slaughterhouse
    • Others
  • Geography
    • APAC
      • China
      • Japan
      • India
    • North America
      • US
      • Canada
      • Mexico
    • Europe
      • Germany
      • UK
      • France
    • Middle East and Africa
      • Saudi Arabia
      • UAE
      • South Africa
    • South America
      • Brazil
      • Argentina
    • Rest of World (ROW)

By Type Insights

The chefs knives segment is estimated to witness significant growth during the forecast period.

The chefs knife segment is foundational to the commercial kitchen knives market, serving as the primary multi-purpose tool for culinary professionals. Its versatility supports a range of tasks from chopping to fine mincing, making its design critical for kitchen efficiency.

A focus on handle ergonomics and a balanced blade balance point is becoming standard to reduce repetitive strain injury among staff during long shifts.

The market is seeing a shift toward hybrid blade geometry, combining Western durability with the paring knife precision of Japanese design.

The use of advanced materials, such as martensitic stainless steel that offers a 40% increase in edge retention, is a key purchasing driver, ensuring longevity and reducing maintenance overhead for high-volume establishments that prioritize food safety compliance and professional cutlery care.

Request Free Sample

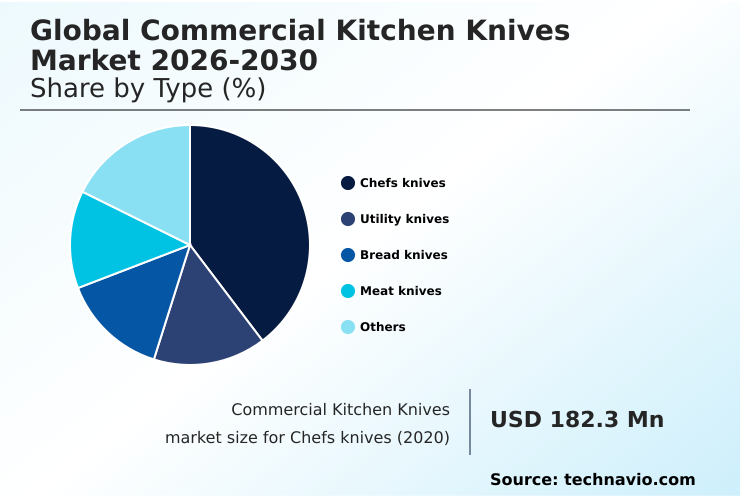
The Chefs knives segment was valued at USD 220.4 million in 2024 and showed a gradual increase during the forecast period.

Request Free Sample

Regional Analysis

APAC is estimated to contribute 46.8% to the growth of the global market during the forecast period.Technavio’s analysts have elaborately explained the regional trends and drivers that shape the market during the forecast period.

See How Commercial Kitchen Knives Market Demand is Rising in APAC Request Free Sample

The geographic landscape of the market reveals distinct regional dynamics. APAC is the fastest-growing region, with its market expansion outpacing Europe's by nearly 1.5%.

This growth is fueled by massive hospitality projects and a strong cultural appreciation for blade geometry and Sujihiki slicing knife designs. North America remains a mature market heavily influenced by stringent food safety compliance and NSF certification requirements.

Europe distinguishes itself through a focus on sustainable handle materials and circular economy in cutlery, with heritage manufacturers leading innovation in recycled steel blades.

The Middle East and Africa represent a significant opportunity driven by luxury tourism development, creating demand for premium forged construction and Damascus cladding.

In contrast, South America's market is characterized by strong domestic production and price sensitivity, with a focus on meat cleaver durability and cleaver blade weight for its robust meat processing industry.

Market Dynamics

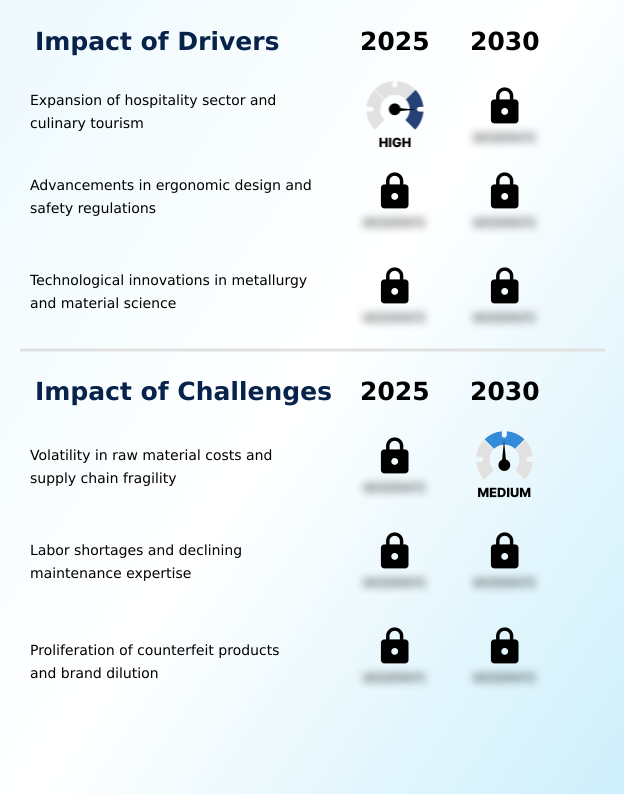
Our researchers analyzed the data with 2025 as the base year, along with the key drivers, trends, and challenges. A holistic analysis of drivers will help companies refine their marketing strategies to gain a competitive advantage.

  • When evaluating the global commercial kitchen knives market 2026-2030, procurement managers face complex decisions. A primary consideration is the debate over high-carbon vs stainless steel knives, where edge retention must be balanced against corrosion resistance. Determining the best knife for commercial kitchen use involves assessing the durability of forged vs stamped knives, with forged options typically offering superior longevity.
  • The Japanese vs German chef knives comparison highlights differing philosophies in blade geometry and weight. For chefs with specific health concerns, finding an ergonomic chef knife for carpal tunnel is critical. Furthermore, a deep understanding of what is a Kiritsuke knife used for or how to select cleavers for heavy-duty use informs specialized purchasing.
  • Adherence to standards is non-negotiable, making NSF certified knives for restaurants a baseline requirement. Operators are increasingly looking into the cost-benefit of powdered steel knives, as their advanced metallurgy can extend the sharpening interval by more than 50% compared to conventional blades. This directly impacts operational costs and aligns with commercial knife maintenance best practices.
  • Key initiatives now focus on reducing cross-contamination with color-coded knives and leveraging the benefits of nitrogen steel in cutlery for harsh environments. Implementing RFID tracking for kitchen inventory control and choosing a boning knife for butchery with the right flexibility are also crucial decisions.
  • Finally, understanding Rockwell hardness in knives and the advantages of a full-tang knife, along with knowing the proper sharpening technique for serrated blades, are essential for maximizing the value of these vital culinary assets and understanding the value of sustainable materials in professional cutlery.

What are the key market drivers leading to the rise in the adoption of Commercial Kitchen Knives Industry?

  • The primary market driver is the robust expansion of the hospitality sector, coupled with a concurrent rise in culinary tourism, particularly within emerging economies.

  • The market's primary driver is the expansion of the hospitality sector, exemplified by projects involving the development of over 75 new properties in a single region, which directly fuels demand for full culinary school knife kits and institutional catering equipment.
  • This growth is paired with a heightened focus on occupational health, leading to advancements in food processing ergonomics. Manufacturers are investing heavily in ergonomic handle design to support repetitive strain injury reduction, a critical factor for staff retention.
  • Furthermore, technological progress in metallurgy is a powerful catalyst. The commercial release of new alloys that provide a 40% increase in edge retention allows for the production of blades like the Kiritsuke knife profile that require less knife sharpening services.
  • This improved performance is a key selling point for hotel procurement standards, where durability and reduced maintenance are paramount, influencing decisions on everything from the Yanagiba slicer design to industrial dishwasher safety.

What are the market trends shaping the Commercial Kitchen Knives Industry?

  • A significant market trend involves integrating sustainable materials and adhering to circular economy principles. This shift is largely driven by evolving environmental regulations and the corporate social responsibility mandates of major hospitality groups.

  • A significant shift in the market is the convergence of sustainability and technology. The adoption of recycled steel blades and sustainable handle materials is accelerating, with some product lines now featuring up to 90% recycled steel content, driven by corporate ESG mandates and circular economy in cutlery initiatives.
  • This trend involves metallurgical fusion and blade hybridization to create global standard knife lines. Concurrently, kitchen asset management is being revolutionized by smart kitchen integration. The use of RFID knife tracking and other asset tracking systems allows for precise inventory control, with pilot programs demonstrating a significant reduction in tool loss.
  • The Nakiri vegetable knife and bread knife serration designs are also evolving with new materials, while antimicrobial handle agents and commercial blade coating technologies like Diamond-Like Carbon (DLC) are enhancing both safety and performance in professional settings.

What challenges does the Commercial Kitchen Knives Industry face during its growth?

  • A key challenge impacting industry growth is the volatility in raw material costs, such as high-carbon stainless steel, alongside the inherent fragility of the global supply chain.

  • The market faces significant headwinds from supply chain volatility and intellectual property theft. A sudden 30% spike in the cost of high-carbon steel can severely disrupt production budgets, challenging manufacturers who rely on this material for its superior Rockwell hardness and performance in products like the paring knife precision and utility knife versatility.
  • This instability forces a constant re-evaluation of the restaurant supply chain. Simultaneously, the proliferation of counterfeit goods undermines brand equity and poses safety risks. A single enforcement action recently seized over 50,000 counterfeit knives, highlighting the scale of the problem.
  • This environment makes it difficult for legitimate producers to maintain quality standards for features like the bolster design and full-tang design, while also investing in essential compliance areas like HACCP color coding and cross-contamination prevention.

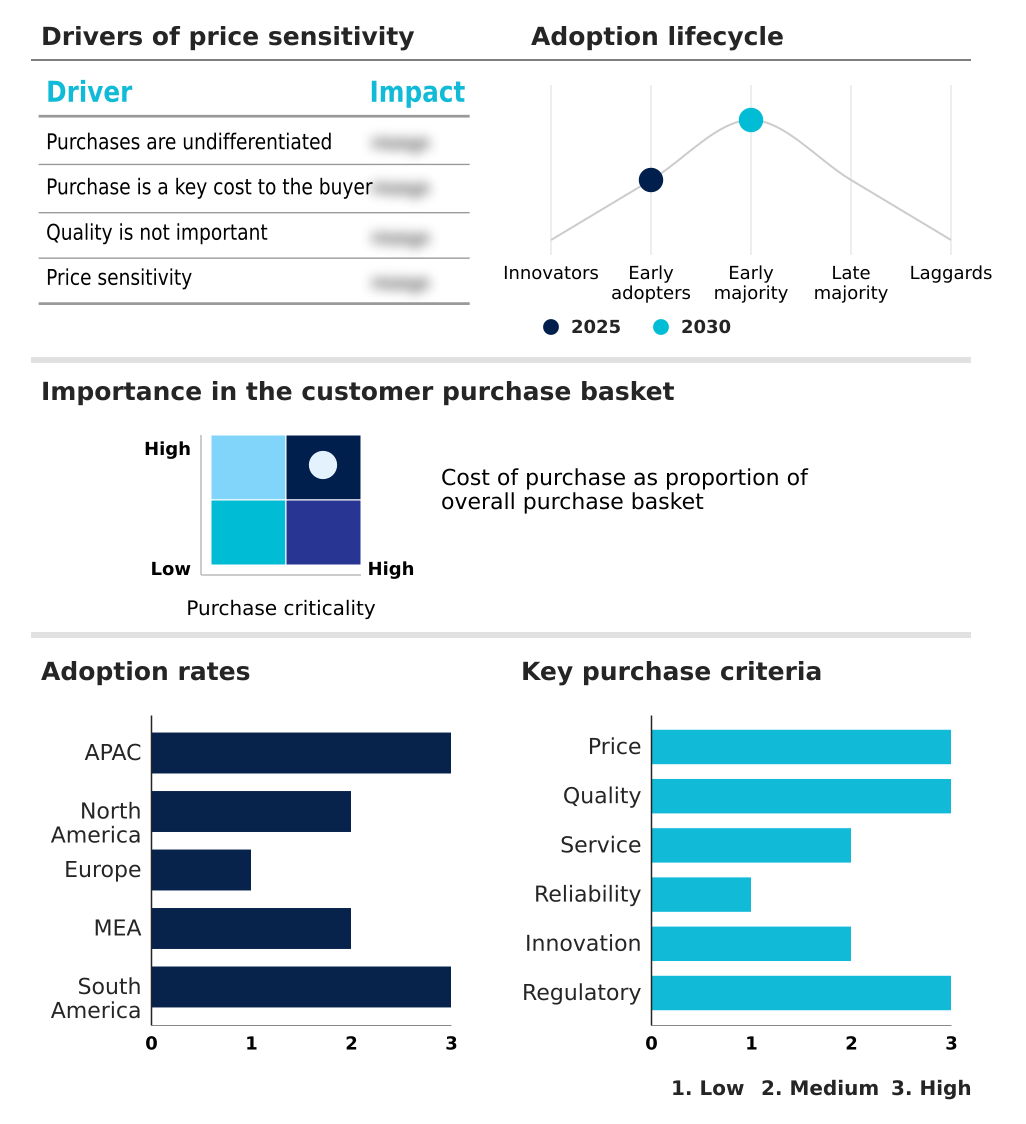
Exclusive Technavio Analysis on Customer Landscape

The commercial kitchen knives market forecasting report includes the adoption lifecycle of the market, covering from the innovator’s stage to the laggard’s stage. It focuses on adoption rates in different regions based on penetration. Furthermore, the commercial kitchen knives market report also includes key purchase criteria and drivers of price sensitivity to help companies evaluate and develop their market growth analysis strategies.

Customer Landscape of Commercial Kitchen Knives Industry

Competitive Landscape

Companies are implementing various strategies, such as strategic alliances, commercial kitchen knives market forecast, partnerships, mergers and acquisitions, geographical expansion, and product/service launches, to enhance their presence in the industry.

Coltellerie Sanelli Srl - Offers patented knife designs and specialized tools for professional chefs and the hotel and restaurant trade, focusing on unique functionality and commercial-grade durability.

The industry research and growth report includes detailed analyses of the competitive landscape of the market and information about key companies, including:

  • Coltellerie Sanelli Srl
  • Dalstrong Inc.
  • Deglon SAS
  • Dexter Russell Inc.
  • Johannes Giesser Messerfabrik
  • Kai Corp.
  • Kyocera Corp.
  • MAC Knife Inc.
  • Masamoto Sohonten Co. Ltd.
  • Mercer Tool Corp.
  • Messermeister Inc.
  • Misono Knives
  • Nenohi Cutlery Co. Ltd.
  • Tojiro Co. Ltd.
  • Victorinox AG
  • Wusthof GmbH
  • Yoshihiro Cutlery
  • Zwilling JA Henckels AG

Qualitative and quantitative analysis of companies has been conducted to help clients understand the wider business environment as well as the strengths and weaknesses of key industry players. Data is qualitatively analyzed to categorize companies as pure play, category-focused, industry-focused, and diversified; it is quantitatively analyzed to categorize companies as dominant, leading, strong, tentative, and weak.

Recent Development and News in Commercial kitchen knives market

  • In August 2024, the Kai Group inaugurated a new manufacturing facility in Long A Province, Vietnam, to increase production capacity for its mid-range commercial series targeted at the Southeast Asian hospitality market.
  • In February 2025, CFS Brands acquired Mercer Culinary, integrating Mercer's commercial cutlery portfolio into its global distribution network to enhance offline availability for hospitality operators worldwide.
  • In May 2025, Sandvik Materials Technology partnered with several European cutlery brands to commercially release a new grade of martensitic stainless steel engineered to provide a 40% increase in edge retention over traditional alloys.
  • In May 2025, Accor Group announced a strategic partnership with Wusthof to standardize culinary equipment with the Wusthof Classic Ikon series across its premium hotel brands in Europe and North America.

Dive into Technavio’s robust research methodology, blending expert interviews, extensive data synthesis, and validated models for unparalleled Commercial Kitchen Knives Market insights. See full methodology.

Market Scope
Page number 294
Base year 2025
Historic period 2020-2024
Forecast period 2026-2030
Growth momentum & CAGR Accelerate at a CAGR of 5.9%
Market growth 2026-2030 USD 191.3 million
Market structure Fragmented
YoY growth 2025-2026(%) 5.4%
Key countries China, Japan, India, South Korea, Australia, Indonesia, US, Canada, Mexico, Germany, UK, France, Italy, Spain, The Netherlands, Saudi Arabia, UAE, South Africa, Israel, Turkey, Brazil, Argentina and Chile
Competitive landscape Leading Companies, Market Positioning of Companies, Competitive Strategies, and Industry Risks

Request Free Sample

Research Analyst Overview

  • The commercial kitchen knives market is defined by a continuous push toward material science innovation and functional specialization. Boardroom decisions on capital expenditure are now heavily influenced by the total cost of ownership, weighing the upfront investment in advanced powdered metallurgy steel against long-term savings from enhanced edge retention and corrosion resistance.
  • The adoption of blades with nitrogen-enriched steel, offering superior durability, is a key factor. Manufacturers are perfecting blade geometry, spine thickness, and blade balance point to optimize performance for specific tasks, from the utility knife versatility to the demands of a heavy meat cleaver durability.
  • The market is seeing widespread use of full-tang design, forged construction, and hollow ground blades to meet professional standards. Innovations in serrated edge patterns and Damascus cladding are driven by both function and aesthetics. The Rockwell hardness of a blade, achieved through precise blade tempering, is a critical metric for procurement.
  • Handle ergonomics are paramount, with non-slip grip materials like TPE handle material becoming standard. Specialized tools, including those with a Santoku knife design, Gyuto knife profile, cleaver blade weight, and boning knife flexibility, are essential.
  • Products with NSF certification that feature a distinct bolster design and heel of knife construction ensure compliance and safety, with some advanced alloys delivering a 40% increase in performance over previous standards.

What are the Key Data Covered in this Commercial Kitchen Knives Market Research and Growth Report?

  • What is the expected growth of the Commercial Kitchen Knives Market between 2026 and 2030?

    • USD 191.3 million, at a CAGR of 5.9%

  • What segmentation does the market report cover?

    • The report is segmented by Type (Chefs knives, Utility knives, Bread knives, Meat knives, and Others), Distribution Channel (Offline, and Online), End-user (HoReCa, Slaughterhouse, and Others) and Geography (APAC, North America, Europe, Middle East and Africa, South America)

  • Which regions are analyzed in the report?

    • APAC, North America, Europe, Middle East and Africa and South America

  • What are the key growth drivers and market challenges?

    • Expansion of hospitality sector and culinary tourism, Volatility in raw material costs and supply chain fragility

  • Who are the major players in the Commercial Kitchen Knives Market?

    • Coltellerie Sanelli Srl, Dalstrong Inc., Deglon SAS, Dexter Russell Inc., Johannes Giesser Messerfabrik, Kai Corp., Kyocera Corp., MAC Knife Inc., Masamoto Sohonten Co. Ltd., Mercer Tool Corp., Messermeister Inc., Misono Knives, Nenohi Cutlery Co. Ltd., Tojiro Co. Ltd., Victorinox AG, Wusthof GmbH, Yoshihiro Cutlery and Zwilling JA Henckels AG

Market Research Insights

  • Market dynamics are increasingly influenced by the need for operational efficiency and risk mitigation. For example, the adoption of ergonomic handle design has been linked to a projected 15% reduction in musculoskeletal disorder claims in some food processing environments, demonstrating a clear return on investment. This focus on worker safety and butchery tool precision drives procurement toward higher-value tools.
  • Simultaneously, the industry grapples with supply chain instability, where a sudden 30% spike in specialty steel costs can immediately impact production budgets and pricing for hotel procurement standards.
  • This volatility pressures manufacturers to optimize their restaurant supply chain and explore innovations like culinary tool leasing and smart kitchen integration to provide predictable costing models for commercial clients, balancing performance with financial sustainability.

We can help! Our analysts can customize this commercial kitchen knives market research report to meet your requirements.

Get in touch

1. Executive Summary

1.1 Market overview

Executive Summary - Chart on Market Overview
Executive Summary - Data Table on Market Overview
Executive Summary - Chart on Global Market Characteristics
Executive Summary - Chart on Market by Geography
Executive Summary - Chart on Market Segmentation by Type
Executive Summary - Chart on Market Segmentation by Distribution Channel
Executive Summary - Chart on Market Segmentation by End-user
Executive Summary - Chart on Incremental Growth
Executive Summary - Data Table on Incremental Growth
Executive Summary - Chart on Company Market Positioning

2. Technavio Analysis

2.1 Analysis of price sensitivity, lifecycle, customer purchase basket, adoption rates, and purchase criteria

2.2 Criticality of inputs and Factors of differentiation

Chart on Overview on criticality of inputs and factors of differentiation

2.3 Factors of disruption

Chart on Overview on factors of disruption

2.4 Impact of drivers and challenges

Chart on Impact of drivers and challenges in 2025 and 2030

3. Market Landscape

3.1 Market ecosystem

Chart on Parent Market
Data Table on - Parent Market

3.2 Market characteristics

Chart on Market characteristics analysis

3.3 Value chain analysis

Chart on Value chain analysis

4. Market Sizing

4.1 Market definition

Data Table on Offerings of companies included in the market definition

4.2 Market segment analysis

Market segments

4.3 Market size 2025

4.4 Market outlook: Forecast for 2025-2030

Chart on Global - Market size and forecast 2025-2030 ($ million)
Data Table on Global - Market size and forecast 2025-2030 ($ million)
Chart on Global Market: Year-over-year growth 2025-2030 (%)
Data Table on Global Market: Year-over-year growth 2025-2030 (%)

5. Historic Market Size

5.1 Global Commercial Kitchen Knives Market 2020 - 2024

Historic Market Size - Data Table on Global Commercial Kitchen Knives Market 2020 - 2024 ($ million)

5.2 Type segment analysis 2020 - 2024

Historic Market Size - Type Segment 2020 - 2024 ($ million)

5.3 Distribution Channel segment analysis 2020 - 2024

Historic Market Size - Distribution Channel Segment 2020 - 2024 ($ million)

5.4 End-user segment analysis 2020 - 2024

Historic Market Size - End-user Segment 2020 - 2024 ($ million)

5.5 Geography segment analysis 2020 - 2024

Historic Market Size - Geography Segment 2020 - 2024 ($ million)

5.6 Country segment analysis 2020 - 2024

Historic Market Size - Country Segment 2020 - 2024 ($ million)

6. Qualitative Analysis

6.1 Impact of AI on Global Commercial Kitchen Knives Market

7. Five Forces Analysis

7.1 Five forces summary

Five forces analysis - Comparison between 2025 and 2030

7.2 Bargaining power of buyers

Bargaining power of buyers - Impact of key factors 2025 and 2030

7.3 Bargaining power of suppliers

Bargaining power of suppliers - Impact of key factors in 2025 and 2030

7.4 Threat of new entrants

Threat of new entrants - Impact of key factors in 2025 and 2030

7.5 Threat of substitutes

Threat of substitutes - Impact of key factors in 2025 and 2030

7.6 Threat of rivalry

Threat of rivalry - Impact of key factors in 2025 and 2030

7.7 Market condition

Chart on Market condition - Five forces 2025 and 2030

8. Market Segmentation by Type

8.1 Market segments

Chart on Type - Market share 2025-2030 (%)
Data Table on Type - Market share 2025-2030 (%)

8.2 Comparison by Type

Chart on Comparison by Type
Data Table on Comparison by Type

8.3 Chefs knives - Market size and forecast 2025-2030

Chart on Chefs knives - Market size and forecast 2025-2030 ($ million)
Data Table on Chefs knives - Market size and forecast 2025-2030 ($ million)
Chart on Chefs knives - Year-over-year growth 2025-2030 (%)
Data Table on Chefs knives - Year-over-year growth 2025-2030 (%)

8.4 Utility knives - Market size and forecast 2025-2030

Chart on Utility knives - Market size and forecast 2025-2030 ($ million)
Data Table on Utility knives - Market size and forecast 2025-2030 ($ million)
Chart on Utility knives - Year-over-year growth 2025-2030 (%)
Data Table on Utility knives - Year-over-year growth 2025-2030 (%)

8.5 Bread knives - Market size and forecast 2025-2030

Chart on Bread knives - Market size and forecast 2025-2030 ($ million)
Data Table on Bread knives - Market size and forecast 2025-2030 ($ million)
Chart on Bread knives - Year-over-year growth 2025-2030 (%)
Data Table on Bread knives - Year-over-year growth 2025-2030 (%)

8.6 Meat knives - Market size and forecast 2025-2030

Chart on Meat knives - Market size and forecast 2025-2030 ($ million)
Data Table on Meat knives - Market size and forecast 2025-2030 ($ million)
Chart on Meat knives - Year-over-year growth 2025-2030 (%)
Data Table on Meat knives - Year-over-year growth 2025-2030 (%)

8.7 Others - Market size and forecast 2025-2030

Chart on Others - Market size and forecast 2025-2030 ($ million)
Data Table on Others - Market size and forecast 2025-2030 ($ million)
Chart on Others - Year-over-year growth 2025-2030 (%)
Data Table on Others - Year-over-year growth 2025-2030 (%)

8.8 Market opportunity by Type

Market opportunity by Type ($ million)
Data Table on Market opportunity by Type ($ million)

9. Market Segmentation by Distribution Channel

9.1 Market segments

Chart on Distribution Channel - Market share 2025-2030 (%)
Data Table on Distribution Channel - Market share 2025-2030 (%)

9.2 Comparison by Distribution Channel

Chart on Comparison by Distribution Channel
Data Table on Comparison by Distribution Channel

9.3 Offline - Market size and forecast 2025-2030

Chart on Offline - Market size and forecast 2025-2030 ($ million)
Data Table on Offline - Market size and forecast 2025-2030 ($ million)
Chart on Offline - Year-over-year growth 2025-2030 (%)
Data Table on Offline - Year-over-year growth 2025-2030 (%)

9.4 Online - Market size and forecast 2025-2030

Chart on Online - Market size and forecast 2025-2030 ($ million)
Data Table on Online - Market size and forecast 2025-2030 ($ million)
Chart on Online - Year-over-year growth 2025-2030 (%)
Data Table on Online - Year-over-year growth 2025-2030 (%)

9.5 Market opportunity by Distribution Channel

Market opportunity by Distribution Channel ($ million)
Data Table on Market opportunity by Distribution Channel ($ million)

10. Market Segmentation by End-user

10.1 Market segments

Chart on End-user - Market share 2025-2030 (%)
Data Table on End-user - Market share 2025-2030 (%)

10.2 Comparison by End-user

Chart on Comparison by End-user
Data Table on Comparison by End-user

10.3 HoReCa - Market size and forecast 2025-2030

Chart on HoReCa - Market size and forecast 2025-2030 ($ million)
Data Table on HoReCa - Market size and forecast 2025-2030 ($ million)
Chart on HoReCa - Year-over-year growth 2025-2030 (%)
Data Table on HoReCa - Year-over-year growth 2025-2030 (%)

10.4 Slaughterhouse - Market size and forecast 2025-2030

Chart on Slaughterhouse - Market size and forecast 2025-2030 ($ million)
Data Table on Slaughterhouse - Market size and forecast 2025-2030 ($ million)
Chart on Slaughterhouse - Year-over-year growth 2025-2030 (%)
Data Table on Slaughterhouse - Year-over-year growth 2025-2030 (%)

10.5 Others - Market size and forecast 2025-2030

Chart on Others - Market size and forecast 2025-2030 ($ million)
Data Table on Others - Market size and forecast 2025-2030 ($ million)
Chart on Others - Year-over-year growth 2025-2030 (%)
Data Table on Others - Year-over-year growth 2025-2030 (%)

10.6 Market opportunity by End-user

Market opportunity by End-user ($ million)
Data Table on Market opportunity by End-user ($ million)

11. Customer Landscape

11.1 Customer landscape overview

Analysis of price sensitivity, lifecycle, customer purchase basket, adoption rates, and purchase criteria

12. Geographic Landscape

12.1 Geographic segmentation

Chart on Market share by geography 2025-2030 (%)
Data Table on Market share by geography 2025-2030 (%)

12.2 Geographic comparison

Chart on Geographic comparison
Data Table on Geographic comparison

12.3 APAC - Market size and forecast 2025-2030

Chart on APAC - Market size and forecast 2025-2030 ($ million)
Data Table on APAC - Market size and forecast 2025-2030 ($ million)
Chart on APAC - Year-over-year growth 2025-2030 (%)
Data Table on APAC - Year-over-year growth 2025-2030 (%)
Chart on Regional Comparison - APAC
Data Table on Regional Comparison - APAC

12.3.1 China - Market size and forecast 2025-2030

Chart on China - Market size and forecast 2025-2030 ($ million)
Data Table on China - Market size and forecast 2025-2030 ($ million)
Chart on China - Year-over-year growth 2025-2030 (%)
Data Table on China - Year-over-year growth 2025-2030 (%)

12.3.2 Japan - Market size and forecast 2025-2030

Chart on Japan - Market size and forecast 2025-2030 ($ million)
Data Table on Japan - Market size and forecast 2025-2030 ($ million)
Chart on Japan - Year-over-year growth 2025-2030 (%)
Data Table on Japan - Year-over-year growth 2025-2030 (%)

12.3.3 India - Market size and forecast 2025-2030

Chart on India - Market size and forecast 2025-2030 ($ million)
Data Table on India - Market size and forecast 2025-2030 ($ million)
Chart on India - Year-over-year growth 2025-2030 (%)
Data Table on India - Year-over-year growth 2025-2030 (%)

12.3.4 South Korea - Market size and forecast 2025-2030

Chart on South Korea - Market size and forecast 2025-2030 ($ million)
Data Table on South Korea - Market size and forecast 2025-2030 ($ million)
Chart on South Korea - Year-over-year growth 2025-2030 (%)
Data Table on South Korea - Year-over-year growth 2025-2030 (%)

12.3.5 Australia - Market size and forecast 2025-2030

Chart on Australia - Market size and forecast 2025-2030 ($ million)
Data Table on Australia - Market size and forecast 2025-2030 ($ million)
Chart on Australia - Year-over-year growth 2025-2030 (%)
Data Table on Australia - Year-over-year growth 2025-2030 (%)

12.3.6 Indonesia - Market size and forecast 2025-2030

Chart on Indonesia - Market size and forecast 2025-2030 ($ million)
Data Table on Indonesia - Market size and forecast 2025-2030 ($ million)
Chart on Indonesia - Year-over-year growth 2025-2030 (%)
Data Table on Indonesia - Year-over-year growth 2025-2030 (%)

12.4 North America - Market size and forecast 2025-2030

Chart on North America - Market size and forecast 2025-2030 ($ million)
Data Table on North America - Market size and forecast 2025-2030 ($ million)
Chart on North America - Year-over-year growth 2025-2030 (%)
Data Table on North America - Year-over-year growth 2025-2030 (%)
Chart on Regional Comparison - North America
Data Table on Regional Comparison - North America

12.4.1 US - Market size and forecast 2025-2030

Chart on US - Market size and forecast 2025-2030 ($ million)
Data Table on US - Market size and forecast 2025-2030 ($ million)
Chart on US - Year-over-year growth 2025-2030 (%)
Data Table on US - Year-over-year growth 2025-2030 (%)

12.4.2 Canada - Market size and forecast 2025-2030

Chart on Canada - Market size and forecast 2025-2030 ($ million)
Data Table on Canada - Market size and forecast 2025-2030 ($ million)
Chart on Canada - Year-over-year growth 2025-2030 (%)
Data Table on Canada - Year-over-year growth 2025-2030 (%)

12.4.3 Mexico - Market size and forecast 2025-2030

Chart on Mexico - Market size and forecast 2025-2030 ($ million)
Data Table on Mexico - Market size and forecast 2025-2030 ($ million)
Chart on Mexico - Year-over-year growth 2025-2030 (%)
Data Table on Mexico - Year-over-year growth 2025-2030 (%)

12.5 Europe - Market size and forecast 2025-2030

Chart on Europe - Market size and forecast 2025-2030 ($ million)
Data Table on Europe - Market size and forecast 2025-2030 ($ million)
Chart on Europe - Year-over-year growth 2025-2030 (%)
Data Table on Europe - Year-over-year growth 2025-2030 (%)
Chart on Regional Comparison - Europe
Data Table on Regional Comparison - Europe

12.5.1 Germany - Market size and forecast 2025-2030

Chart on Germany - Market size and forecast 2025-2030 ($ million)
Data Table on Germany - Market size and forecast 2025-2030 ($ million)
Chart on Germany - Year-over-year growth 2025-2030 (%)
Data Table on Germany - Year-over-year growth 2025-2030 (%)

12.5.2 UK - Market size and forecast 2025-2030

Chart on UK - Market size and forecast 2025-2030 ($ million)
Data Table on UK - Market size and forecast 2025-2030 ($ million)
Chart on UK - Year-over-year growth 2025-2030 (%)
Data Table on UK - Year-over-year growth 2025-2030 (%)

12.5.3 France - Market size and forecast 2025-2030

Chart on France - Market size and forecast 2025-2030 ($ million)
Data Table on France - Market size and forecast 2025-2030 ($ million)
Chart on France - Year-over-year growth 2025-2030 (%)
Data Table on France - Year-over-year growth 2025-2030 (%)

12.5.4 Italy - Market size and forecast 2025-2030

Chart on Italy - Market size and forecast 2025-2030 ($ million)
Data Table on Italy - Market size and forecast 2025-2030 ($ million)
Chart on Italy - Year-over-year growth 2025-2030 (%)
Data Table on Italy - Year-over-year growth 2025-2030 (%)

12.5.5 Spain - Market size and forecast 2025-2030

Chart on Spain - Market size and forecast 2025-2030 ($ million)
Data Table on Spain - Market size and forecast 2025-2030 ($ million)
Chart on Spain - Year-over-year growth 2025-2030 (%)
Data Table on Spain - Year-over-year growth 2025-2030 (%)

12.5.6 The Netherlands - Market size and forecast 2025-2030

Chart on The Netherlands - Market size and forecast 2025-2030 ($ million)
Data Table on The Netherlands - Market size and forecast 2025-2030 ($ million)
Chart on The Netherlands - Year-over-year growth 2025-2030 (%)
Data Table on The Netherlands - Year-over-year growth 2025-2030 (%)

12.6 Middle East and Africa - Market size and forecast 2025-2030

Chart on Middle East and Africa - Market size and forecast 2025-2030 ($ million)
Data Table on Middle East and Africa - Market size and forecast 2025-2030 ($ million)
Chart on Middle East and Africa - Year-over-year growth 2025-2030 (%)
Data Table on Middle East and Africa - Year-over-year growth 2025-2030 (%)
Chart on Regional Comparison - Middle East and Africa
Data Table on Regional Comparison - Middle East and Africa

12.6.1 Saudi Arabia - Market size and forecast 2025-2030

Chart on Saudi Arabia - Market size and forecast 2025-2030 ($ million)
Data Table on Saudi Arabia - Market size and forecast 2025-2030 ($ million)
Chart on Saudi Arabia - Year-over-year growth 2025-2030 (%)
Data Table on Saudi Arabia - Year-over-year growth 2025-2030 (%)

12.6.2 UAE - Market size and forecast 2025-2030

Chart on UAE - Market size and forecast 2025-2030 ($ million)
Data Table on UAE - Market size and forecast 2025-2030 ($ million)
Chart on UAE - Year-over-year growth 2025-2030 (%)
Data Table on UAE - Year-over-year growth 2025-2030 (%)

12.6.3 South Africa - Market size and forecast 2025-2030

Chart on South Africa - Market size and forecast 2025-2030 ($ million)
Data Table on South Africa - Market size and forecast 2025-2030 ($ million)
Chart on South Africa - Year-over-year growth 2025-2030 (%)
Data Table on South Africa - Year-over-year growth 2025-2030 (%)

12.6.4 Israel - Market size and forecast 2025-2030

Chart on Israel - Market size and forecast 2025-2030 ($ million)
Data Table on Israel - Market size and forecast 2025-2030 ($ million)
Chart on Israel - Year-over-year growth 2025-2030 (%)
Data Table on Israel - Year-over-year growth 2025-2030 (%)

12.6.5 Turkey - Market size and forecast 2025-2030

Chart on Turkey - Market size and forecast 2025-2030 ($ million)
Data Table on Turkey - Market size and forecast 2025-2030 ($ million)
Chart on Turkey - Year-over-year growth 2025-2030 (%)
Data Table on Turkey - Year-over-year growth 2025-2030 (%)

12.7 South America - Market size and forecast 2025-2030

Chart on South America - Market size and forecast 2025-2030 ($ million)
Data Table on South America - Market size and forecast 2025-2030 ($ million)
Chart on South America - Year-over-year growth 2025-2030 (%)
Data Table on South America - Year-over-year growth 2025-2030 (%)
Chart on Regional Comparison - South America
Data Table on Regional Comparison - South America

12.7.1 Brazil - Market size and forecast 2025-2030

Chart on Brazil - Market size and forecast 2025-2030 ($ million)
Data Table on Brazil - Market size and forecast 2025-2030 ($ million)
Chart on Brazil - Year-over-year growth 2025-2030 (%)
Data Table on Brazil - Year-over-year growth 2025-2030 (%)

12.7.2 Argentina - Market size and forecast 2025-2030

Chart on Argentina - Market size and forecast 2025-2030 ($ million)
Data Table on Argentina - Market size and forecast 2025-2030 ($ million)
Chart on Argentina - Year-over-year growth 2025-2030 (%)
Data Table on Argentina - Year-over-year growth 2025-2030 (%)

12.7.3 Chile - Market size and forecast 2025-2030

Chart on Chile - Market size and forecast 2025-2030 ($ million)
Data Table on Chile - Market size and forecast 2025-2030 ($ million)
Chart on Chile - Year-over-year growth 2025-2030 (%)
Data Table on Chile - Year-over-year growth 2025-2030 (%)

12.8 Market opportunity by geography

Market opportunity by geography ($ million)
Data Tables on Market opportunity by geography ($ million)

13. Drivers, Challenges, and Opportunity

13.1 Market drivers

Expansion of hospitality sector and culinary tourism
Advancements in ergonomic design and safety regulations
Technological innovations in metallurgy and material science

13.2 Market challenges

Volatility in raw material costs and supply chain fragility
Labor shortages and declining maintenance expertise
Proliferation of counterfeit products and brand dilution

13.3 Impact of drivers and challenges

Impact of drivers and challenges in 2025 and 2030

13.4 Market opportunities

Integration of sustainable materials and circular economy principles
Adoption of smart asset management and RFID technology
Hybridization of blade geometries and metallurgical fusion

14. Competitive Landscape

14.1 Overview

14.2

Overview on criticality of inputs and factors of differentiation

14.3 Landscape disruption

Overview on factors of disruption

14.4 Industry risks

Impact of key risks on business

15. Competitive Analysis

15.1 Companies profiled

Companies covered

15.2 Company ranking index

15.3 Market positioning of companies

Matrix on companies position and classification

15.4 Coltellerie Sanelli Srl

Coltellerie Sanelli Srl - Overview
Coltellerie Sanelli Srl - Product / Service
Coltellerie Sanelli Srl - Key offerings
SWOT

15.5 Dalstrong Inc.

Dalstrong Inc. - Overview
Dalstrong Inc. - Product / Service
Dalstrong Inc. - Key offerings
SWOT

15.6 Kai Corp.

Kai Corp. - Overview
Kai Corp. - Product / Service
Kai Corp. - Key offerings
SWOT

15.7 Kyocera Corp.

Kyocera Corp. - Overview
Kyocera Corp. - Business segments
Kyocera Corp. - Key news
Kyocera Corp. - Key offerings
Kyocera Corp. - Segment focus
SWOT

15.8 MAC Knife Inc.

MAC Knife Inc. - Overview
MAC Knife Inc. - Product / Service
MAC Knife Inc. - Key offerings
SWOT

15.9 Masamoto Sohonten Co. Ltd.

Masamoto Sohonten Co. Ltd. - Overview
Masamoto Sohonten Co. Ltd. - Product / Service
Masamoto Sohonten Co. Ltd. - Key offerings
SWOT

15.10 Mercer Tool Corp.

Mercer Tool Corp. - Overview
Mercer Tool Corp. - Product / Service
Mercer Tool Corp. - Key offerings
SWOT

15.11 Messermeister Inc.

Messermeister Inc. - Overview
Messermeister Inc. - Product / Service
Messermeister Inc. - Key offerings
SWOT

15.12 Misono Knives

Misono Knives - Overview
Misono Knives - Product / Service
Misono Knives - Key offerings
SWOT

15.13 Nenohi Cutlery Co. Ltd.

Nenohi Cutlery Co. Ltd. - Overview
Nenohi Cutlery Co. Ltd. - Product / Service
Nenohi Cutlery Co. Ltd. - Key offerings
SWOT

15.14 Tojiro Co. Ltd.

Tojiro Co. Ltd. - Overview
Tojiro Co. Ltd. - Product / Service
Tojiro Co. Ltd. - Key offerings
SWOT

15.15 Victorinox AG

Victorinox AG - Overview
Victorinox AG - Product / Service
Victorinox AG - Key offerings
SWOT

15.16 Wusthof GmbH

Wusthof GmbH - Overview
Wusthof GmbH - Product / Service
Wusthof GmbH - Key offerings
SWOT

15.17 Yoshihiro Cutlery

Yoshihiro Cutlery - Overview
Yoshihiro Cutlery - Product / Service
Yoshihiro Cutlery - Key offerings
SWOT

15.18 Zwilling JA Henckels AG

Zwilling JA Henckels AG - Overview
Zwilling JA Henckels AG - Product / Service
Zwilling JA Henckels AG - Key offerings
SWOT

16. Appendix

16.1 Scope of the report

Market definition
Objectives
Notes and caveats

16.2 Inclusions and exclusions checklist

Inclusions checklist
Exclusions checklist

16.3 Currency conversion rates for US$

16.4 Research methodology

16.5 Data procurement

Information sources

16.6 Data validation

16.7 Validation techniques employed for market sizing

16.8 Data synthesis

16.9 360 degree market analysis

16.10 List of abbreviations

Research Methodology

Technavio presents a detailed picture of the market by way of study, synthesis, and summation of data from multiple sources. The analysts have presented the various facets of the market with a particular focus on identifying the key industry influencers. The data thus presented is comprehensive, reliable, and the result of extensive research, both primary and secondary.

INFORMATION SOURCES

Primary sources

  • Manufacturers and suppliers
  • Channel partners
  • Industry experts
  • Strategic decision makers

Secondary sources

  • Industry journals and periodicals
  • Government data
  • Financial reports of key industry players
  • Historical data
  • Press releases

DATA ANALYSIS

Data Synthesis

  • Collation of data
  • Estimation of key figures
  • Analysis of derived insights

Data Validation

  • Triangulation with data models
  • Reference against proprietary databases
  • Corroboration with industry experts

REPORT WRITING

Qualitative

  • Market drivers
  • Market challenges
  • Market trends
  • Five forces analysis

Quantitative

  • Market size and forecast
  • Market segmentation
  • Geographical insights
  • Competitive landscape

Interested in this report?

Get your sample now to see our research methodology and insights!

Download Now

Frequently Asked Questions

Commercial Kitchen Knives market growth will increase by USD 191.3 million during 2026-2030.

The Commercial Kitchen Knives market is expected to grow at a CAGR of 5.9% during 2026-2030.

Commercial Kitchen Knives market is segmented by Type (Chefs knives, Utility knives, Bread knives, Meat knives, Others) Distribution channel (Offline, Online) End-user (HoReCa, Slaughterhouse, Others)

Coltellerie Sanelli Srl, Dalstrong Inc., Deglon SAS, Dexter Russell Inc., Johannes Giesser Messerfabrik, Kai Corp., Kyocera Corp., MAC Knife Inc., Masamoto Sohonten Co. Ltd., Mercer Tool Corp., Messermeister Inc., Misono Knives, Nenohi Cutlery Co. Ltd., Tojiro Co. Ltd., Victorinox AG, Wusthof GmbH, Yoshihiro Cutlery, Zwilling JA Henckels AG are a few of the key vendors in the Commercial Kitchen Knives market.

APAC will register the highest growth rate of 46.8% among the other regions. Therefore, the Commercial Kitchen Knives market in APAC is expected to garner significant business opportunities for the vendors during the forecast period.

China, Japan, India, South Korea, Australia, Indonesia, US, Canada, Mexico, Germany, UK, France, Italy, Spain, The Netherlands, Saudi Arabia, UAE, South Africa, Israel, Turkey, Brazil, Argentina, Chile

  • Expansion of hospitality sector and culinary tourism is the driving factor this market.

The Commercial Kitchen Knives market vendors should focus on grabbing business opportunities from the Type segment as it accounted for the largest market share in the base year.