Consumer Shopping Cart Market Size 2025-2029
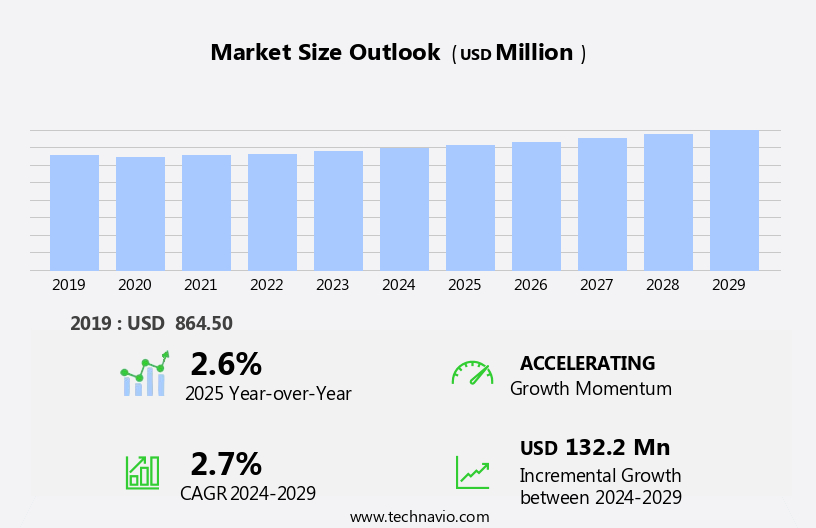
The consumer shopping cart market size is forecast to increase by USD 132.2 million at a CAGR of 2.7% between 2024 and 2029.
- The market is experiencing significant growth, driven primarily by the expansion of the retail sector worldwide. This trend is particularly evident in emerging economies, where increasing disposable income and urbanization are leading to an increase in retail sales. Another key driver is the emergence of smart shopping carts, which offer advanced features such as self-checkout, product recommendations, and real-time inventory management. These innovations are enhancing the shopping experience for consumers and providing retailers with valuable data to optimize their operations. However, the market is not without challenges. The market is experiencing significant growth, driven by the increasing trend towards e-commerce and the resulting demand for efficient and sustainable solutions. Fluctuations in raw material prices, particularly for metals and plastics, can significantly impact the cost of producing shopping carts. Additionally, consumer preferences are shifting towards more eco-friendly options, creating a strong demand for sustainable materials and recyclable packaging solutions.
- Additionally, the increasing popularity of e-commerce and contactless shopping solutions may limit the growth of the traditional shopping cart market. To capitalize on market opportunities and navigate these challenges effectively, companies must stay abreast of industry trends and invest in research and development to offer innovative and cost-effective solutions. By doing so, they can differentiate themselves from competitors and maintain a competitive edge in the evolving retail landscape.
What will be the Size of the Consumer Shopping Cart Market during the forecast period?
- The market encompasses a range of solutions designed to facilitate and enhance the online shopping experience. These offerings include cart management tools, training, hosting, and consulting services. Key trends in this market include a focus on usability, cart flow optimization, checkout experience optimization, and personalized shopping experiences. Cart features such as multi-platform integration, security, and analytics are also crucial. Additionally, cart testing, design, and support are essential for ensuring a seamless customer journey. Key market drivers include the growing demand for plastic-based packaging, particularly in sectors such as food and beverage, pharmaceuticals, and industrial chemicals.
- Cart abandonment analysis and reduction techniques are also vital for improving conversion rates. Overall, the market is a dynamic and growing sector, with ongoing innovation in functionality, accessibility, and integration.
How is this Consumer Shopping Cart Industry segmented?
The consumer shopping cart industry research report provides comprehensive data (region-wise segment analysis), with forecasts and estimates in "USD million" for the period 2025-2029, as well as historical data from 2019-2023 for the following segments.
- Product
- Steel carts
- Plastic carts
- Others
- Distribution Channel
- Direct sales
- Distributors
- Type
- Traditional shopping carts
- Smart shopping carts
- Product Type
- Roller basket
- Child cart
- Others
- Geography
- North America
- US
- Canada
- Europe
- France
- Germany
- Italy
- UK
- APAC
- Australia
- China
- Japan
- South Korea
- Middle East and Africa
- South America
- North America
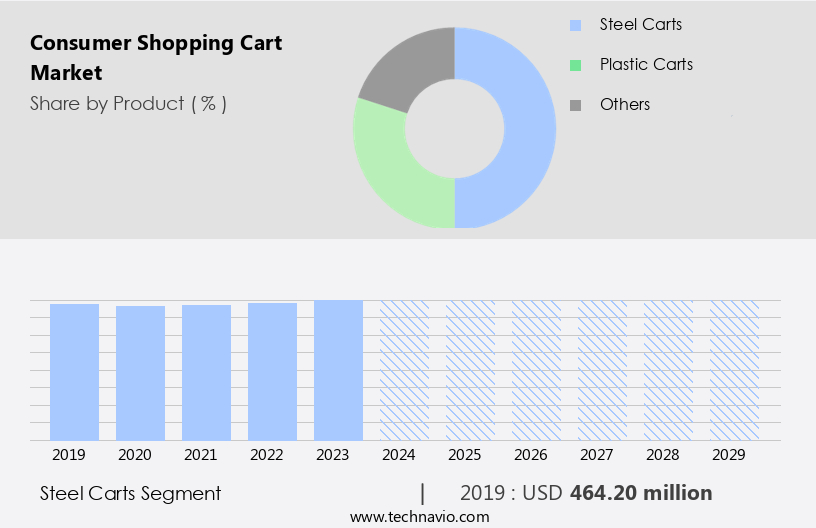
By Product Insights
The steel carts segment is estimated to witness significant growth during the forecast period. The market is a dynamic and evolving industry, driven by various factors that enhance the online shopping experience. Cart recovery and abandoned cart recovery are crucial elements of conversion optimization, ensuring that businesses maximize sales opportunities. Website optimization, customer service, and user interface design are essential components of the customer journey, which can significantly impact conversion rates. Subscription services, machine learning, and targeted marketing are key trends, leveraging big data to personalize the shopping experience. Inventory management, order fulfillment, and payment processing are essential operational functions, requiring efficient and secure solutions. Mobile commerce, social commerce, voice commerce, and augmented reality are emerging channels, expanding the reach of online shopping. This market is driven by the growing demand for packaged products in various industries, including food and beverage, cosmetics, and e-commerce.
Get a glance at the market report of share of various segments Request Free Sample
The Steel carts segment was valued at USD 464.20 million in 2019 and showed a gradual increase during the forecast period.
Regional Analysis
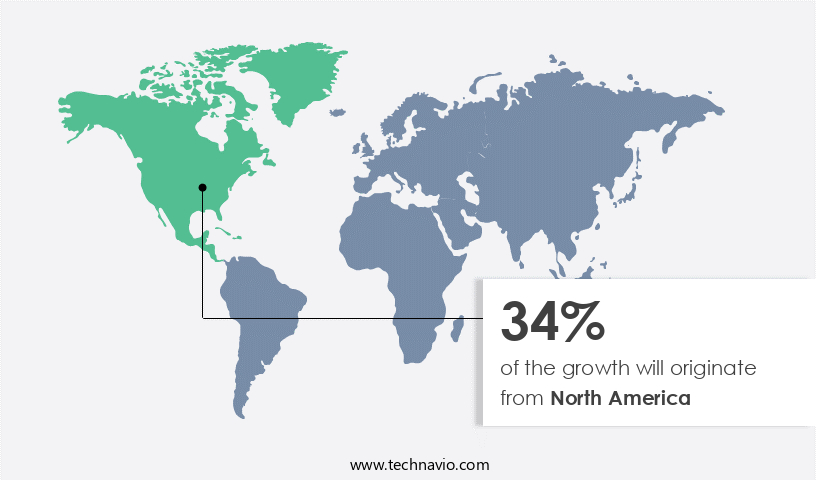
North America is estimated to contribute 34% to the growth of the global market during the forecast period. Technavio's analysts have elaborately explained the regional trends and drivers that shape the market during the forecast period.
For more insights on the market size of various regions, Request Free Sample
The market in North America is experiencing significant growth, with the US and Canada being key contributors. Driven by the entry of innovative startups, this market is focused on optimizing the shopping experience. For instance, Caper, a US-based company, offers AI-powered shopping carts that utilize machine learning to scan and weigh products, enabling customers to pay and leave the store without waiting in long checkout lines. This enhances the customer journey and boosts conversion rates. Other trends include cart recovery, website optimization, customer service, and subscription services. Conversion optimization, data security, payment processing, order fulfillment, mobile commerce, and targeted marketing are also essential elements of this market. The circular economy concept highlights sustainability, reducing carbon footprint, and implementing sustainable practices. Key raw materials include paper, cattle, soybeans, and palm oil.
Furthermore, emerging technologies like machine learning, inventory management, product recommendations, and customer segmentation are transforming the online shopping landscape. Mobile app development, shopping cart optimization, artificial intelligence, and virtual reality are also gaining popularity. Cart abandonment rate reduction, cart management, and customer experience are critical areas of focus. Cloud computing, checkout flow, product ratings, voice commerce, and user interface design are other essential aspects of the market.
Market Dynamics
Our researchers analyzed the data with 2024 as the base year, along with the key drivers, trends, and challenges. A holistic analysis of drivers will help companies refine their marketing strategies to gain a competitive advantage.
What are the key market drivers leading to the rise in the adoption of Consumer Shopping Cart Industry?
- Expansion of retail sector worldwide is the key driver of the market. The retail sector's expansion, driven by economic growth and rising consumer spending power, fuels the demand for consumer shopping carts worldwide. As new retail outlets open and existing ones expand, the need for shopping carts increases in various retail formats, including supermarkets, hypermarkets, department stores, and specialty shops. In densely populated areas, the proliferation of retail establishments necessitates shopping carts to provide customers with efficient and convenient shopping experiences. The growing foot traffic in these retail spaces necessitates the use of shopping carts for transporting goods, enhancing the overall shopping experience, and ensuring customer satisfaction.
- Customer segmentation, product recommendations, and loyalty programs are effective strategies for retaining customers and increasing sales. Cart management, checkout flow, and user experience are critical areas for conversion rate optimization. Data security and customer feedback are essential for maintaining trust and building long-term relationships. Shopping cart software, cloud computing, and mobile app development are essential technologies, enabling businesses to provide seamless shopping experiences across multiple channels. Artificial intelligence and virtual reality are transforming the shopping landscape, offering interactive experiences.
What are the market trends shaping the Consumer Shopping Cart Industry?
- Emergence of smart shopping carts is the upcoming market trend. The market has witnessed significant advancements, with companies integrating technology to enhance the in-store shopping experience. Smart shopping carts, a new addition to the market, utilize artificial intelligence (AI) to scan and weigh items as they are added to the cart. Equipped with a touchscreen near the handle, these carts display the total number of items and their corresponding prices. Furthermore, the attached card terminal enables customers to make payments directly from the cart, eliminating the need to wait in long checkout lines. The implementation of these technologies aims to streamline the shopping process and provide a more convenient and efficient experience for customers.
- The packaging sector continues to innovate, with a focus on sustainable green packaging, energy-efficient containers, and biodegradable and recyclable options. Key end-user sectors include healthcare, personal care, home care, and industrialization. The market is continuously evolving, with ongoing innovation in customer experience, cart abandonment rate reduction, and sales conversion optimization.
What challenges does the Consumer Shopping Cart Industry face during its growth?
- Fluctuations in raw material prices of shopping carts is a key challenge affecting the industry growth. The market is influenced by the volatility of raw material prices, particularly those of steel and aluminum, which are commonly used in cart production. Fluctuations in these prices can significantly impact manufacturing costs for shopping cart producers and, consequently, the pricing strategies of retailers. Geopolitical tensions, trade policies, and supply chain disruptions are some factors contributing to the unpredictability of steel and aluminum markets. For instance, an increase in demand from the construction and manufacturing sectors can lead to an increase in steel prices, while aluminum prices may be affected by mining output and environmental regulations. These price variations can pose a challenge for shopping cart manufacturers and retailers, necessitating careful cost management and pricing strategies.
- Customer service is another essential element, with prompt and effective assistance helping to address any queries or concerns, ultimately contributing to a positive customer journey. Subscription services have gained popularity in the shopping cart market, providing consumers with the convenience of recurring deliveries and automated payments. Conversion optimization is another key focus area, with businesses utilizing various techniques such as data security, payment processing, and order fulfillment to minimize friction in the purchasing process. Mobile commerce is a rapidly growing segment within the shopping cart market. Optimizing the shopping cart experience for mobile devices is essential to cater to the increasing number of consumers who prefer shopping on their smartphones and tablets.
Exclusive Customer Landscape
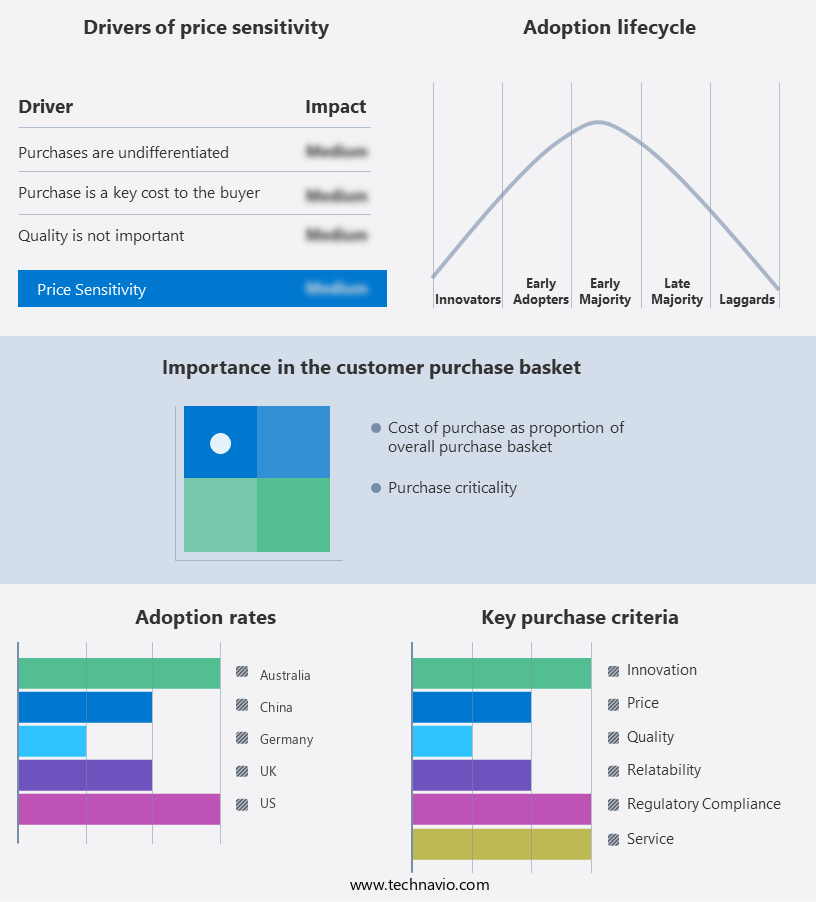
The consumer shopping cart market forecasting report includes the adoption lifecycle of the market, covering from the innovator's stage to the laggard's stage. It focuses on adoption rates in different regions based on penetration. Furthermore, the consumer shopping cart market report also includes key purchase criteria and drivers of price sensitivity to help companies evaluate and develop their market growth analysis strategies.
Customer Landscape
Key Companies & Market Insights
Companies are implementing various strategies, such as strategic alliances, consumer shopping cart market forecast, partnerships, mergers and acquisitions, geographical expansion, and product/service launches, to enhance their presence in the industry.
Advance Carts Inc. - The company provides a range of innovative consumer shopping cart solutions, including the x series, boomrang series, and flavor series, catering to diverse market needs. These carts are engineered for optimal functionality, user experience, and design, setting new standards in the retail industry. By integrating advanced technology and ergonomic features, the company continues to push the boundaries of shopping cart innovation.
The industry research and growth report includes detailed analyses of the competitive landscape of the market and information about key companies, including:
- Advance Carts Inc.
- Americana Co.
- Bemis retail Solutions
- Changshu Jinsheng Metal Products Factory
- Changshu Whale Metal Products Co. Ltd.
- Changshu Yirunda Business Equipment Factory
- CREACIONES MARSANZ S.A
- Foshan Yongchuangyi Shelf Manufacturing Co. Ltd.
- Kailiou Commercial Equipment Co. Ltd.
- National Cart Co.
- R.W. Rogers Co.
- Sambo Corp.
- Shanghai Rongxin PetProduct Co. Ltd.
- The Peggs Co. Inc.
- Unarco Industries LLC
- Van Keulen Interieurbouw BV
- Versacart Systems Inc.
- Wanzl GmbH and Co. KGaA
Qualitative and quantitative analysis of companies has been conducted to help clients understand the wider business environment as well as the strengths and weaknesses of key industry players. Data is qualitatively analyzed to categorize companies as pure play, category-focused, industry-focused, and diversified; it is quantitatively analyzed to categorize companies as dominant, leading, strong, tentative, and weak.
Research Analyst Overview
The market is a critical component of the e-commerce industry, facilitating the seamless transition of products from a digital catalog to a virtual shopping cart. This market encompasses various elements that optimize the shopping experience for consumers, ensuring a streamlined and efficient process from browsing to purchase. One significant aspect of the market is cart recovery. This process involves re-engaging consumers who have abandoned their carts before completing a purchase. By implementing effective cart recovery strategies, businesses can recover lost sales and enhance customer engagement. Website optimization plays a crucial role in the market. A well-designed website that is easy to navigate and offers an intuitive user interface can significantly improve the shopping experience and increase conversion rates.
Machine learning (ML) and artificial intelligence (AI) are being increasingly adopted to personalize the shopping experience, with product recommendations and targeted marketing strategies based on customer segmentation and behavioral data. Inventory management is a critical component of the market, ensuring that businesses have accurate and up-to-date stock information to meet consumer demand. Online shopping continues to be a dominant force, with businesses investing in cart abandonment rate reduction strategies, checkout flow optimization, and product ratings to improve the overall customer experience. The market is also witnessing the emergence of new technologies such as voice commerce, augmented reality (AR), and virtual reality (VR).
These innovations offer unique opportunities to enhance the shopping experience and differentiate businesses in a competitive landscape. Cloud computing is increasingly being adopted in the market to enable scalability, flexibility, and cost savings. A/B testing is another essential technique used to optimize the experience, with businesses continually refining their strategies based on user feedback and data analysis. Social commerce is another growing trend in the market, with businesses leveraging social media platforms to reach new customers and engage with existing ones. Loyalty programs are another effective tool to retain customers and incentivize repeat purchases. Shopping cart integration is a crucial aspect of e-commerce businesses, enabling seamless transition from product browsing to checkout. To reduce cart abandonment and enhance customer experience, businesses must focus on cart optimization techniques, cart management software, and features.
Customer journey mapping is essential in the xperience. Shopping cart analytics and tracking provide valuable insights into user behavior, helping to identify areas for improvement. Cart abandonment reduction strategies, such as simplifying the checkout process, offering multiple payment options, and ensuring security, are key. Multiplatform cart integration is necessary for businesses selling across multiple channels. Shopping cart design and functionality should be user-friendly, with easy-to-use shopping cart addons, plugins, themes, and templates. Hosting, development, maintenance, and support are also important considerations. Shopping cart testing and usability assessments help ensure a smooth shopping cart experience. Accessibility features, such as screen reader compatibility and mobile optimization, are essential for catering to diverse user needs. Consulting and training services can provide expert guidance on shopping cart implementation and optimization. Effective shopping cart integration and optimization require a comprehensive approach, addressing cart management, design, functionality, security, and customer experience. By focusing on these aspects, businesses can minimize cart abandonment and maximize sales.
The market is a dynamic and evolving landscape, with businesses continually investing in innovative technologies and strategies to optimize the shopping experience and drive sales. By focusing on elements such as cart recovery, website optimization, customer service, subscription services, conversion optimization, data security, payment processing, order fulfillment, mobile commerce, machine learning, inventory management, online shopping, targeted marketing, product recommendations, shopping cart software, loyalty programs, cart abandonment, big data, A/B testing, social commerce, sales conversion, customer reviews, customer feedback, user interface, abandoned cart recovery, augmented reality, user experience, cart abandonment rate, cloud computing, checkout flow, product ratings, voice commerce, and cart management, businesses can stay competitive and meet the evolving demands of consumers.
|
Market Scope |
|
|
Report Coverage |
Details |
|
Page number |
228 |
|
Base year |
2024 |
|
Historic period |
2019-2023 |
|
Forecast period |
2025-2029 |
|
Growth momentum & CAGR |
Accelerate at a CAGR of 2.7% |
|
Market growth 2025-2029 |
USD 132.2 million |
|
Market structure |
Fragmented |
|
YoY growth 2024-2025(%) |
2.6 |
|
Key countries |
US, Canada, UK, Germany, China, Australia, France, Japan, Italy, and South Korea |
|
Competitive landscape |
Leading Companies, Market Positioning of Companies, Competitive Strategies, and Industry Risks |
What are the Key Data Covered in this Consumer Shopping Cart Market Research and Growth Report?
- CAGR of the Consumer Shopping Cart industry during the forecast period
- Detailed information on factors that will drive the growth and forecasting between 2025 and 2029
- Precise estimation of the size of the market and its contribution of the industry in focus to the parent market
- Accurate predictions about upcoming growth and trends and changes in consumer behaviour
- Growth of the market across North America, Europe, APAC, Middle East and Africa, and South America
- Thorough analysis of the market's competitive landscape and detailed information about companies
- Comprehensive analysis of factors that will challenge the consumer shopping cart market growth of industry companies
We can help! Our analysts can customize this consumer shopping cart market research report to meet your requirements.
 RIA -
RIA - 
