Content Protection Market Analysis North America, Europe, APAC, South America, Middle East and Africa - US, Canada, China, UK, France - Size and Forecast 2024-2028

Content Protection Market Analysis North America, Europe, APAC, South America, Middle East and Africa - US, Canada, China, UK, France - Size and Forecast 2024-2028

Published: Nov 2023 164 Pages SKU: IRTNTR76749

Market Overview at a Glance

$1.03 B
Market Opportunity
11.24%
CAGR
10.1
YoY growth 2023-2024(%)

Content Protection Market Size 2024-2028 

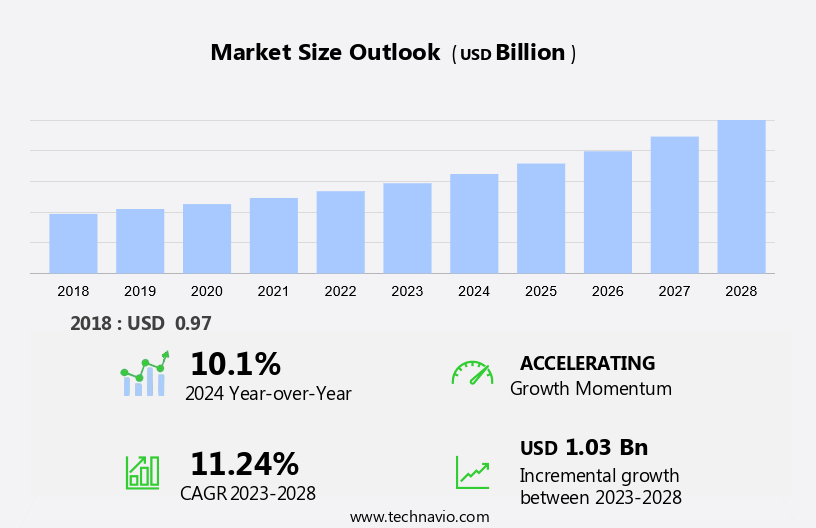
The content protection market size is forecast to increase by USD 1.03 billion at a CAGR of 11.24% between 2023 and 2028.

  • The market is experiencing significant growth due to the increasing adoption of digital content in various industries, including healthcare and corporate sectors. With the rise of streaming platforms and expansive digital libraries, the infrastructure required for content protection has become increasingly complex. This complexity introduces new challenges, such as the threat of ransomware incidents, data theft, and copyright infringement. As the number of cyber threats continues to grow, the importance of these strong solutions, enhanced by IoT and artificial intelligence, becomes more evident. Movies and TV shows are prime targets for piracy, with AI-driven security systems helping to detect and prevent unauthorized access, while IoT-enabled devices ensure real-time monitoring. This escalating threat leads to significant financial losses for content creators and distributors. Moreover, it also explores potential failures during implementation and the consequences that can result. By understanding these factors, businesses can make informed decisions about the solutions they adopt to safeguard their digital assets. 

What will be the Size of the Market During the Forecast Period?

Content Protection Market Size

 Request Free Sample

  • The market is a critical segment in the digital business arena, as the proliferation of digital content and the increasing threat of unauthorized access pose significant challenges for content creators and owners. The protection of digital rights, intellectual property, and sensitive data is paramount in today's digital economy. Content protection, a fundamental aspect of digital security, encompasses various strategies and technologies aimed at securing digital content from unauthorized access, copying, tampering, and sharing. Digital Rights Management (DRM) policies are a key component of content protection, enabling content creators and owners to control access to their digital assets and monetize them effectively.
  • Digital content, in its various forms, is a valuable asset for businesses. Intellectual property, including text, images, audio, and video, is a significant investment for content creators and owners. Unauthorized access, copying, or sharing can lead to substantial financial losses and reputational damage. To mitigate these risks, these solutions employ encryption, rendering digital content in an unreadable format for unauthorized users. Advanced algorithms and cryptographic keys are used to ensure that only authorized users can access and decrypt the content. Digital watermarking, both visible and invisible, is another effective strategy for proving ownership and tracking content distribution.

How is this market segmented and which is the largest segment?

The market research report provides comprehensive data (region-wise segment analysis), with forecasts and estimates in "USD billion" for the period 2024-2028, as well as historical data from 2018-2022 for the following segments.

  • End-user
    • Large enterprise
    • Small
    • medium enterprise
  • Type
    • Conditional access systems
    • Digital rights management
    • Digital watermarking
    • Others
  • Geography
    • North America
      • Canada
      • US
    • Europe
      • UK
      • France
    • APAC
      • China
    • South America
    • Middle East and Africa

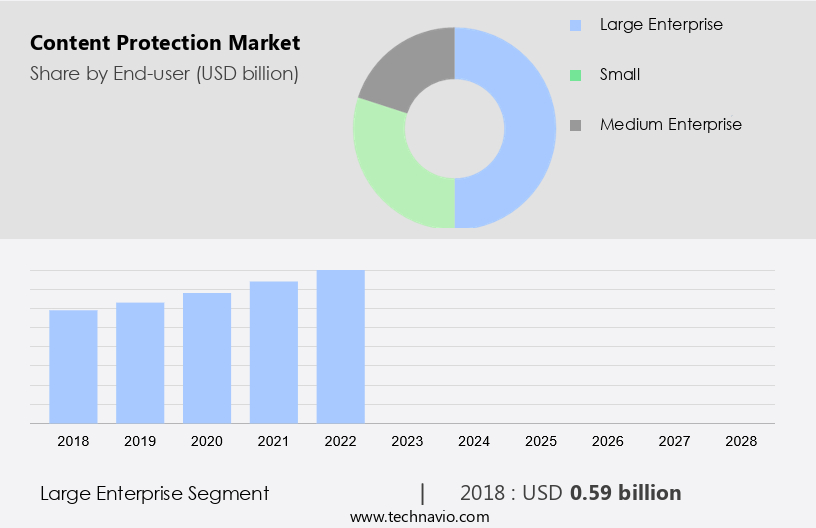
By End-user Insights

  • The large enterprise segment is estimated to witness significant growth during the forecast period.

In today's business landscape, large enterprises are leading the charge in the market. The increasing generation of content within organizations necessitates a more adaptable and expansive approach to content protection. By implementing these solutions, businesses can efficiently manage and secure their digital assets, enabling them to expand or contract their protection measures as required. Moreover, the heightened threat of data breaches and cyber-attacks has intensified the importance of strong content protection. Content protection offers encryption techniques, such as algorithms and cryptographic keys, to ensure authorized users have access while keeping the content unreadable for unauthorized individuals. Decryption keys are provided to authorized users, allowing them to access the content while maintaining the integrity of the original data. As the need for advanced security measures continues to grow, content protection will remain a vital investment for large enterprises in safeguarding their future projects and valuable intellectual property.

Content Protection Market Size

Get a glance at the market report of share of various segments Request Free Sample

The Large enterprise segment was valued at USD 0.59 billion in 2018 and showed a gradual increase during the forecast period.
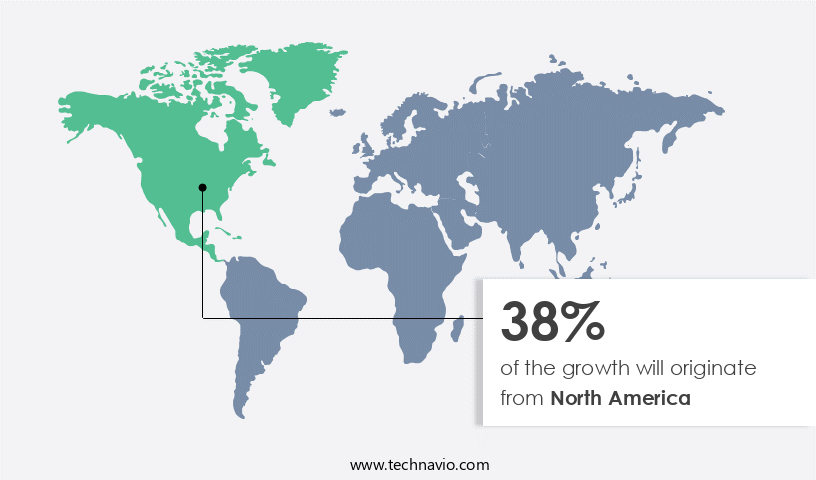
Regional Analysis

  • North America is estimated to contribute 38% to the growth of the global market during the forecast period.

Technavio's analysts have elaborately explained the regional trends and drivers that shape the market during the forecast period.

Content Protection Market Share by Geography

For more insights on the market share of various regions Request Free Sample

The market represents a substantial share due to the integration of advanced technologies like automation, cloud solutions, and virtualization. The digital transformation of businesses, particularly those in remote locations, and the rising adoption of these systems among local enterprises are key growth drivers for the market in this region. The adoption of cloud-based technologies and virtualization in North America is motivating businesses to implement these solutions to secure their digital assets. Companies are increasingly utilizing cloud services for data storage and content processing, making it crucial to safeguard their intellectual property. Zero Trust architecture, continuous authentication, scalability, and flexibility are essential features that organizations seek in content protection platforms.

Multi DRM solutions cater to the needs of streaming services and various devices. Watermarking technologies ensure content traceability and integrity. These solutions enable businesses to secure their digital content, maintain data privacy, and comply with industry regulations.

Market Dynamics

Our researchers analyzed the data with 2023 as the base year, along with the key drivers, trends, and challenges. A holistic analysis of drivers will help companies refine their marketing strategies to gain a competitive advantage.

What are the key market drivers leading to the rise in the adoption of the Content Protection Market?

An increase in the adoption of content among various industries is the key driver of the market.

  • Content protection has emerged as a vital component in the business landscape, particularly in sectors like IT and finance, as the importance of securing digital content and intellectual property becomes increasingly apparent. The market is experiencing significant growth due to the escalating number of cyber threats and data breaches. Unauthorized access to digital content poses a significant risk for businesses, and these solutions are essential for preventing copying, tampering, and piracy. Digital rights management (DRM) policies are a popular approach to content protection, employing encryption, algorithms, and cryptographic keys to secure content and restrict access to authorized users. Digital watermarking, both visible and invisible, is another effective strategy for proving ownership and tracking content distribution, discouraging unauthorized sharing.
  • With the popularity of online streaming services, the demand for content protection solutions has risen. Zero Trust architecture, continuous authentication, and scalability are key features of modern content protection platforms. Businesses in media and entertainment, education, healthcare, and corporate sectors are increasingly relying on Multi DRM solutions to secure their digital content and sensitive data. The future lies in advanced technologies like blockchain, which offers immutable records and transparency, instilling trust and transparency in transactions. Content creators and owners can monetize their future projects and protect their intellectual property with these strong protection measures. The increasing prevalence of cyberattacks, data breaches, ransomware incidents, and copyright infringement underscores the need for effective solutions.

What are the market trends shaping the Content Protection Market?

A rise in the number of cyber threats is the upcoming trend in the market.

  • In the digital age, content protection has emerged as a critical concern for businesses and content creators alike. Unauthorized access to digital content, intellectual property, and sensitive data pose significant risks, leading to financial losses, reputational damage, and legal issues. The market solutions, such as digital rights management (DRM), encryption, and digital watermarking, offer effective measures to secure digital content and deter unauthorized copying, tampering, and sharing. DRM policies help control access to digital content, ensuring that only authorized users possess decryption keys. Encryption algorithms and cryptographic keys play a crucial role in protecting data from unauthorized access and virus attacks.
  • Digital watermarking, whether visible or invisible, can help prove ownership and track content distribution, discouraging unauthorized sharing. Businesses in various sectors, including media and entertainment, education, healthcare, and corporate sectors, are increasingly adopting the measures to safeguard their digital assets. The popularity of online streaming services and the rise in demand for remote work have further accentuated the need for strong content security. Zero Trust architecture, continuous authentication, scalability, and flexibility are essential features of modern content protection platforms. Multi DRM solutions cater to the diverse needs of streaming services and devices. Watermarking technologies help prevent piracy, a significant source of leaks, and protect the revenue streams of content creators and owners.

What challenges does the Content Protection Market face during the growth?

The possibility of failure during implementation is a key challenge affecting the market growth.

  • The market is a critical segment in the digital landscape, focusing on safeguarding digital content and sensitive data from unauthorized access and intellectual property theft. Content security solutions encompass digital rights management (DRM) policies, encryption, algorithms, and cryptographic keys to ensure authorized users have access to content while discouraging unauthorized copying, tampering, and sharing. Businesses across various sectors, including media and entertainment, education, healthcare, and corporate sectors, are increasingly relying on content protection to monetize their future projects and protect their intellectual property. The popularity of online streaming services has led to a rise in demand for content protection measures due to the rising threat of cyberattacks, data breaches, and online piracy.
  • Zero Trust architecture, continuous authentication, scalability, and flexibility are essential features of modern content protection solutions. Multi DRM solutions cater to the needs of various platforms and devices, while watermarking technologies offer visible and invisible options for proving ownership and tracking content distribution. Despite the benefits, implementation of content protection solutions can be complex and time-consuming. Service providers must manage various processes, including project management, vulnerability management, compliance, content management, event monitoring, and access management, to ensure flawless execution. The planning phase requires careful consideration of device configurations and their integration into an organization's network infrastructure. Content protection remains a crucial investment for businesses seeking to protect their digital assets and maintain trust with their customers.

Exclusive Customer Landscape

The market forecasting report includes the adoption lifecycle of the market, covering from the innovator's stage to the laggard's stage. It focuses on adoption rates in different regions based on penetration. Furthermore, the market report also includes key purchase criteria and drivers of price sensitivity to help companies evaluate and develop their market growth analysis strategies.
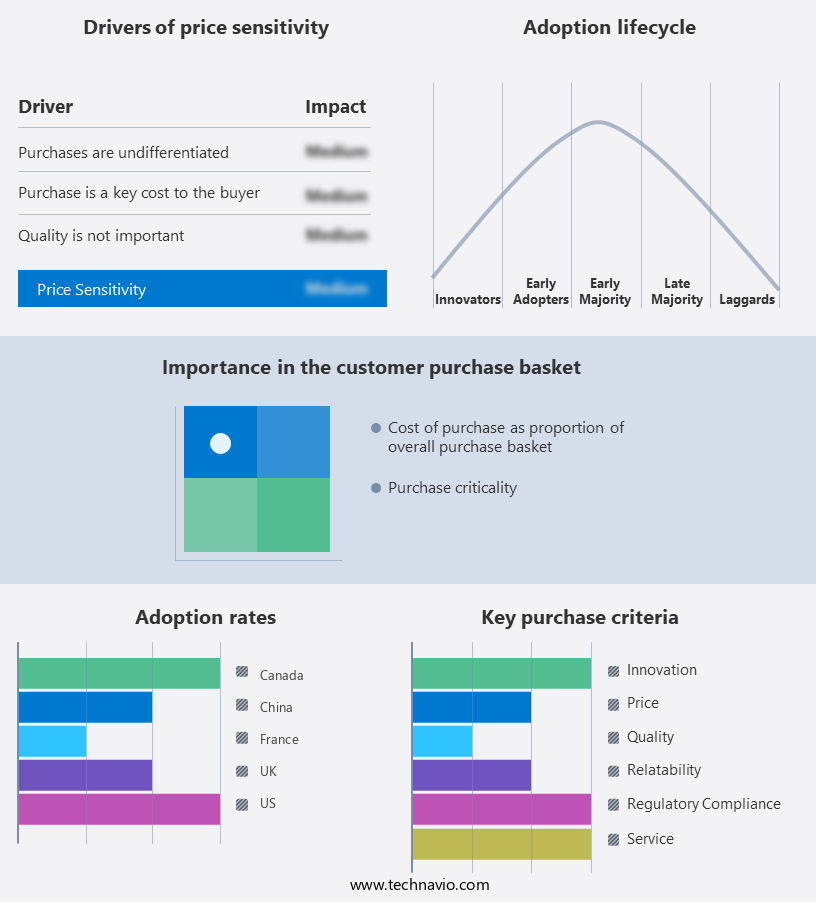
Content Protection Market Share by Geography

 Customer Landscape

Key Companies & Market Insights

Companies are implementing various strategies, such as strategic alliances, market forecast, partnerships, mergers and acquisitions, geographical expansion, and product/service launches, to enhance their presence in the market.

The market research and growth report includes detailed analyses of the competitive landscape of the market and information about key companies, including:

  • Adobe Inc.
  • Alphabet Inc.
  • Axinom GmbH
  • Cisco Systems Inc.
  • CommScope Holding Co. Inc.
  • Digimarc Corp.
  • EZDRM Inc.
  • Friend MTS Ltd.
  • Intel Corp.
  • Intertrust Technologies Corp.
  • Kudelski SA
  • Locklizard Ltd.
  • Microsoft Corp.
  • NASPERS Ltd.
  • RGB Spectrum
  • Sony Group Corp.
  • STMicroelectronics International N.V.
  • Verance Corp.
  • Verimatrix Inc.
  • Wellav Technologies Ltd.

Qualitative and quantitative analysis of companies has been conducted to help clients understand the wider business environment as well as the strengths and weaknesses of key market players. Data is qualitatively analyzed to categorize companies as pure play, category-focused, industry-focused, and diversified; it is quantitatively analyzed to categorize companies as dominant, leading, strong, tentative, and weak.

Research Analyst Overview

The market is a critical response to the growing demand for safeguarding digital content from unauthorized access and misuse. Content protection refers to the measures taken to secure digital rights management (DRM) for intellectual property and sensitive data. This includes encryption, algorithms, and cryptographic keys to ensure authorized users have access while discouraging unauthorized copying, tampering, and sharing. Digital content creators and owners seek to monetize their projects and protect future works from piracy and cyberattacks. The rise in remote work and online streaming services has led to a rise in demand for content protection solutions. Businesses in media and entertainment, education, healthcare, and corporate sectors are particularly vulnerable to data breaches and copyright infringement.

Furthermore, digital watermarking, both visible and invisible, is a popular content protection technique, proving ownership and tracking content distribution. Zero trust architecture, continuous authentication, and scalable multi-DRM solutions offer flexibility and protection for platforms, devices, and streaming services. Blockchain technology provides immutable records, transparency, and trust for content transactions. Content protection is essential in preventing the spread of viruses, ransomware incidents, and data theft. As the popularity of online streaming services grows, so does the need for strong protection measures. Content protection is a vital investment for businesses and individuals alike, ensuring the security and integrity of their digital assets.

Market Scope

Report Coverage

Details

Page number

164

Base year

2023

Historic period

2018-2022

Forecast period

2024-2028

Growth momentum & CAGR

Accelerate at a CAGR of 11.24%

Market Growth 2024-2028

USD 1.03 billion

Market structure

Fragmented

YoY growth 2023-2024(%)

10.1

Key countries

US, Canada, China, UK, and France

Competitive landscape

Leading Companies, Market Positioning of Companies, Competitive Strategies, and Industry Risks

Request Free Sample

What are the Key Data Covered in this Market Research and Growth Report?

  • CAGR of the market during the forecast period
  • Detailed information on factors that will drive the market growth and forecasting between 2024 and 2028
  • Precise estimation of the size of the market  and its contribution of the market in focus to the parent market
  • Accurate predictions about upcoming market growth and trends and changes in consumer behaviour
  • Growth of the market across North America, Europe, APAC, South America, and Middle East and Africa
  • Thorough analysis of the market's competitive landscape and detailed information about companies
  • Comprehensive analysis of factors that will challenge the growth of market companies

We can help! Our analysts can customize this market research report to meet your requirements. Get in touch

1 Executive Summary

  • 1.1 Market overview
    • Exhibit 01: Executive Summary – Chart on Market Overview
    • Exhibit 02: Executive Summary – Data Table on Market Overview
    • Exhibit 03: Executive Summary – Chart on Global Market Characteristics
    • Exhibit 04: Executive Summary – Chart on Market by Geography
    • Exhibit 05: Executive Summary – Chart on Market Segmentation by End-user
    • Exhibit 06: Executive Summary – Chart on Market Segmentation by Type
    • Exhibit 07: Executive Summary – Chart on Incremental Growth
    • Exhibit 08: Executive Summary – Data Table on Incremental Growth
    • Exhibit 09: Executive Summary – Chart on Vendor Market Positioning

2 Market Landscape

  • 2.1 Market ecosystem
    • Exhibit 10: Parent market
    • Exhibit 11: Market Characteristics

3 Market Sizing

  • 3.1 Market definition
    • Exhibit 12: Offerings of vendors included in the market definition
  • 3.2 Market segment analysis
    • Exhibit 13: Market segments
  • 3.3 Market size 2023
    • 3.4 Market outlook: Forecast for 2023-2028
      • Exhibit 14: Chart on Global - Market size and forecast 2023-2028 ($ billion)
      • Exhibit 15: Data Table on Global - Market size and forecast 2023-2028 ($ billion)
      • Exhibit 16: Chart on Global Market: Year-over-year growth 2023-2028 (%)
      • Exhibit 17: Data Table on Global Market: Year-over-year growth 2023-2028 (%)

    4 Historic Market Size

    • 4.1 Global content protection market 2018 - 2022
      • Exhibit 18: Historic Market Size – Data Table on global content protection market 2018 - 2022 ($ billion)
    • 4.2 End-user Segment Analysis 2018 - 2022
      • Exhibit 19: Historic Market Size – End-user Segment 2018 - 2022 ($ billion)
    • 4.3 Type Segment Analysis 2018 - 2022
      • Exhibit 20: Historic Market Size – Type Segment 2018 - 2022 ($ billion)
    • 4.4 Geography Segment Analysis 2018 - 2022
      • Exhibit 21: Historic Market Size – Geography Segment 2018 - 2022 ($ billion)
    • 4.5 Country Segment Analysis 2018 - 2022
      • Exhibit 22: Historic Market Size – Country Segment 2018 - 2022 ($ billion)

    5 Five Forces Analysis

    • 5.1 Five forces summary
      • Exhibit 23: Five forces analysis - Comparison between 2023 and 2028
    • 5.2 Bargaining power of buyers
      • Exhibit 24: Chart on Bargaining power of buyers – Impact of key factors 2023 and 2028
    • 5.3 Bargaining power of suppliers
      • Exhibit 25: Bargaining power of suppliers – Impact of key factors in 2023 and 2028
    • 5.4 Threat of new entrants
      • Exhibit 26: Threat of new entrants – Impact of key factors in 2023 and 2028
    • 5.5 Threat of substitutes
      • Exhibit 27: Threat of substitutes – Impact of key factors in 2023 and 2028
    • 5.6 Threat of rivalry
      • Exhibit 28: Threat of rivalry – Impact of key factors in 2023 and 2028
    • 5.7 Market condition
      • Exhibit 29: Chart on Market condition - Five forces 2023 and 2028

    6 Market Segmentation by End-user

    • 6.1 Market segments
      • Exhibit 30: Chart on End-user - Market share 2023-2028 (%)
      • Exhibit 31: Data Table on End-user - Market share 2023-2028 (%)
    • 6.2 Comparison by End-user
      • Exhibit 32: Chart on Comparison by End-user
      • Exhibit 33: Data Table on Comparison by End-user
    • 6.3 Large enterprise - Market size and forecast 2023-2028
      • Exhibit 34: Chart on Large enterprise - Market size and forecast 2023-2028 ($ billion)
      • Exhibit 35: Data Table on Large enterprise - Market size and forecast 2023-2028 ($ billion)
      • Exhibit 36: Chart on Large enterprise - Year-over-year growth 2023-2028 (%)
      • Exhibit 37: Data Table on Large enterprise - Year-over-year growth 2023-2028 (%)
    • 6.4 Small and medium enterprise - Market size and forecast 2023-2028
      • Exhibit 38: Chart on Small and medium enterprise - Market size and forecast 2023-2028 ($ billion)
      • Exhibit 39: Data Table on Small and medium enterprise - Market size and forecast 2023-2028 ($ billion)
      • Exhibit 40: Chart on Small and medium enterprise - Year-over-year growth 2023-2028 (%)
      • Exhibit 41: Data Table on Small and medium enterprise - Year-over-year growth 2023-2028 (%)
    • 6.5 Market opportunity by End-user
      • Exhibit 42: Market opportunity by End-user ($ billion)
      • Exhibit 43: Data Table on Market opportunity by End-user ($ billion)

    7 Market Segmentation by Type

    • 7.1 Market segments
      • Exhibit 44: Chart on Type - Market share 2023-2028 (%)
      • Exhibit 45: Data Table on Type - Market share 2023-2028 (%)
    • 7.2 Comparison by Type
      • Exhibit 46: Chart on Comparison by Type
      • Exhibit 47: Data Table on Comparison by Type
    • 7.3 Conditional access systems - Market size and forecast 2023-2028
      • Exhibit 48: Chart on Conditional access systems - Market size and forecast 2023-2028 ($ billion)
      • Exhibit 49: Data Table on Conditional access systems - Market size and forecast 2023-2028 ($ billion)
      • Exhibit 50: Chart on Conditional access systems - Year-over-year growth 2023-2028 (%)
      • Exhibit 51: Data Table on Conditional access systems - Year-over-year growth 2023-2028 (%)
    • 7.4 Digital rights management - Market size and forecast 2023-2028
      • Exhibit 52: Chart on Digital rights management - Market size and forecast 2023-2028 ($ billion)
      • Exhibit 53: Data Table on Digital rights management - Market size and forecast 2023-2028 ($ billion)
      • Exhibit 54: Chart on Digital rights management - Year-over-year growth 2023-2028 (%)
      • Exhibit 55: Data Table on Digital rights management - Year-over-year growth 2023-2028 (%)
    • 7.5 Digital watermarking - Market size and forecast 2023-2028
      • Exhibit 56: Chart on Digital watermarking - Market size and forecast 2023-2028 ($ billion)
      • Exhibit 57: Data Table on Digital watermarking - Market size and forecast 2023-2028 ($ billion)
      • Exhibit 58: Chart on Digital watermarking - Year-over-year growth 2023-2028 (%)
      • Exhibit 59: Data Table on Digital watermarking - Year-over-year growth 2023-2028 (%)
    • 7.6 Others - Market size and forecast 2023-2028
      • Exhibit 60: Chart on Others - Market size and forecast 2023-2028 ($ billion)
      • Exhibit 61: Data Table on Others - Market size and forecast 2023-2028 ($ billion)
      • Exhibit 62: Chart on Others - Year-over-year growth 2023-2028 (%)
      • Exhibit 63: Data Table on Others - Year-over-year growth 2023-2028 (%)
    • 7.7 Market opportunity by Type
      • Exhibit 64: Market opportunity by Type ($ billion)
      • Exhibit 65: Data Table on Market opportunity by Type ($ billion)

    8 Customer Landscape

    • 8.1 Customer landscape overview
      • Exhibit 66: Analysis of price sensitivity, lifecycle, customer purchase basket, adoption rates, and purchase criteria

    9 Geographic Landscape

    • 9.1 Geographic segmentation
      • Exhibit 67: Chart on Market share by geography 2023-2028 (%)
      • Exhibit 68: Data Table on Market share by geography 2023-2028 (%)
    • 9.2 Geographic comparison
      • Exhibit 69: Chart on Geographic comparison
      • Exhibit 70: Data Table on Geographic comparison
    • 9.3 North America - Market size and forecast 2023-2028
      • Exhibit 71: Chart on North America - Market size and forecast 2023-2028 ($ billion)
      • Exhibit 72: Data Table on North America - Market size and forecast 2023-2028 ($ billion)
      • Exhibit 73: Chart on North America - Year-over-year growth 2023-2028 (%)
      • Exhibit 74: Data Table on North America - Year-over-year growth 2023-2028 (%)
    • 9.4 Europe - Market size and forecast 2023-2028
      • Exhibit 75: Chart on Europe - Market size and forecast 2023-2028 ($ billion)
      • Exhibit 76: Data Table on Europe - Market size and forecast 2023-2028 ($ billion)
      • Exhibit 77: Chart on Europe - Year-over-year growth 2023-2028 (%)
      • Exhibit 78: Data Table on Europe - Year-over-year growth 2023-2028 (%)
    • 9.5 APAC - Market size and forecast 2023-2028
      • Exhibit 79: Chart on APAC - Market size and forecast 2023-2028 ($ billion)
      • Exhibit 80: Data Table on APAC - Market size and forecast 2023-2028 ($ billion)
      • Exhibit 81: Chart on APAC - Year-over-year growth 2023-2028 (%)
      • Exhibit 82: Data Table on APAC - Year-over-year growth 2023-2028 (%)
    • 9.6 South America - Market size and forecast 2023-2028
      • Exhibit 83: Chart on South America - Market size and forecast 2023-2028 ($ billion)
      • Exhibit 84: Data Table on South America - Market size and forecast 2023-2028 ($ billion)
      • Exhibit 85: Chart on South America - Year-over-year growth 2023-2028 (%)
      • Exhibit 86: Data Table on South America - Year-over-year growth 2023-2028 (%)
    • 9.7 Middle East and Africa - Market size and forecast 2023-2028
      • Exhibit 87: Chart on Middle East and Africa - Market size and forecast 2023-2028 ($ billion)
      • Exhibit 88: Data Table on Middle East and Africa - Market size and forecast 2023-2028 ($ billion)
      • Exhibit 89: Chart on Middle East and Africa - Year-over-year growth 2023-2028 (%)
      • Exhibit 90: Data Table on Middle East and Africa - Year-over-year growth 2023-2028 (%)
    • 9.8 US - Market size and forecast 2023-2028
      • Exhibit 91: Chart on US - Market size and forecast 2023-2028 ($ billion)
      • Exhibit 92: Data Table on US - Market size and forecast 2023-2028 ($ billion)
      • Exhibit 93: Chart on US - Year-over-year growth 2023-2028 (%)
      • Exhibit 94: Data Table on US - Year-over-year growth 2023-2028 (%)
    • 9.9 China - Market size and forecast 2023-2028
      • Exhibit 95: Chart on China - Market size and forecast 2023-2028 ($ billion)
      • Exhibit 96: Data Table on China - Market size and forecast 2023-2028 ($ billion)
      • Exhibit 97: Chart on China - Year-over-year growth 2023-2028 (%)
      • Exhibit 98: Data Table on China - Year-over-year growth 2023-2028 (%)
    • 9.10 UK - Market size and forecast 2023-2028
      • Exhibit 99: Chart on UK - Market size and forecast 2023-2028 ($ billion)
      • Exhibit 100: Data Table on UK - Market size and forecast 2023-2028 ($ billion)
      • Exhibit 101: Chart on UK - Year-over-year growth 2023-2028 (%)
      • Exhibit 102: Data Table on UK - Year-over-year growth 2023-2028 (%)
    • 9.11 France - Market size and forecast 2023-2028
      • Exhibit 103: Chart on France - Market size and forecast 2023-2028 ($ billion)
      • Exhibit 104: Data Table on France - Market size and forecast 2023-2028 ($ billion)
      • Exhibit 105: Chart on France - Year-over-year growth 2023-2028 (%)
      • Exhibit 106: Data Table on France - Year-over-year growth 2023-2028 (%)
    • 9.12 Canada - Market size and forecast 2023-2028
      • Exhibit 107: Chart on Canada - Market size and forecast 2023-2028 ($ billion)
      • Exhibit 108: Data Table on Canada - Market size and forecast 2023-2028 ($ billion)
      • Exhibit 109: Chart on Canada - Year-over-year growth 2023-2028 (%)
      • Exhibit 110: Data Table on Canada - Year-over-year growth 2023-2028 (%)
    • 9.13 Market opportunity by geography
      • Exhibit 111: Market opportunity by geography ($ billion)
      • Exhibit 112: Data Tables on Market opportunity by geography ($ billion)

    10 Drivers, Challenges, and Trends

    • 10.1 Market drivers
      • 10.2 Market challenges
        • 10.3 Impact of drivers and challenges
          • Exhibit 113: Impact of drivers and challenges in 2023 and 2028
        • 10.4 Market trends

          11 Vendor Landscape

          • 11.1 Overview
            • 11.2 Vendor landscape
              • Exhibit 114: Overview on Criticality of inputs and Factors of differentiation
            • 11.3 Landscape disruption
              • Exhibit 115: Overview on factors of disruption
            • 11.4 Industry risks
              • Exhibit 116: Impact of key risks on business

            12 Vendor Analysis

            • 12.1 Vendors covered
              • Exhibit 117: Vendors covered
            • 12.2 Market positioning of vendors
              • Exhibit 118: Matrix on vendor position and classification
            • 12.3 Adobe Inc.
              • Exhibit 119: Adobe Inc. - Overview
              • Exhibit 120: Adobe Inc. - Business segments
              • Exhibit 121: Adobe Inc. - Key offerings
              • Exhibit 122: Adobe Inc. - Segment focus
            • 12.4 Alphabet Inc.
              • Exhibit 123: Alphabet Inc. - Overview
              • Exhibit 124: Alphabet Inc. - Business segments
              • Exhibit 125: Alphabet Inc. - Key news
              • Exhibit 126: Alphabet Inc. - Key offerings
              • Exhibit 127: Alphabet Inc. - Segment focus
            • 12.5 Cisco Systems Inc.
              • Exhibit 128: Cisco Systems Inc. - Overview
              • Exhibit 129: Cisco Systems Inc. - Business segments
              • Exhibit 130: Cisco Systems Inc. - Key news
              • Exhibit 131: Cisco Systems Inc. - Key offerings
              • Exhibit 132: Cisco Systems Inc. - Segment focus
            • 12.6 CommScope Holding Co. Inc.
              • Exhibit 133: CommScope Holding Co. Inc. - Overview
              • Exhibit 134: CommScope Holding Co. Inc. - Business segments
              • Exhibit 135: CommScope Holding Co. Inc. - Key news
              • Exhibit 136: CommScope Holding Co. Inc. - Key offerings
              • Exhibit 137: CommScope Holding Co. Inc. - Segment focus
            • 12.7 Digimarc Corp.
              • Exhibit 138: Digimarc Corp. - Overview
              • Exhibit 139: Digimarc Corp. - Product / Service
              • Exhibit 140: Digimarc Corp. - Key offerings
            • 12.8 Intel Corp.
              • Exhibit 141: Intel Corp. - Overview
              • Exhibit 142: Intel Corp. - Business segments
              • Exhibit 143: Intel Corp. - Key news
              • Exhibit 144: Intel Corp. - Key offerings
              • Exhibit 145: Intel Corp. - Segment focus
            • 12.9 Intertrust Technologies Corp.
              • Exhibit 146: Intertrust Technologies Corp. - Overview
              • Exhibit 147: Intertrust Technologies Corp. - Product / Service
              • Exhibit 148: Intertrust Technologies Corp. - Key offerings
            • 12.10 Kudelski SA
              • Exhibit 149: Kudelski SA - Overview
              • Exhibit 150: Kudelski SA - Business segments
              • Exhibit 151: Kudelski SA - Key offerings
              • Exhibit 152: Kudelski SA - Segment focus
            • 12.11 Microsoft Corp.
              • Exhibit 153: Microsoft Corp. - Overview
              • Exhibit 154: Microsoft Corp. - Business segments
              • Exhibit 155: Microsoft Corp. - Key news
              • Exhibit 156: Microsoft Corp. - Key offerings
              • Exhibit 157: Microsoft Corp. - Segment focus
            • 12.12 NASPERS Ltd.
              • Exhibit 158: NASPERS Ltd. - Overview
              • Exhibit 159: NASPERS Ltd. - Business segments
              • Exhibit 160: NASPERS Ltd. - Key offerings
              • Exhibit 161: NASPERS Ltd. - Segment focus
            • 12.13 Sony Group Corp.
              • Exhibit 162: Sony Group Corp. - Overview
              • Exhibit 163: Sony Group Corp. - Business segments
              • Exhibit 164: Sony Group Corp. - Key news
              • Exhibit 165: Sony Group Corp. - Key offerings
              • Exhibit 166: Sony Group Corp. - Segment focus
            • 12.14 STMicroelectronics International N.V.
              • Exhibit 167: STMicroelectronics International N.V. - Overview
              • Exhibit 168: STMicroelectronics International N.V. - Business segments
              • Exhibit 169: STMicroelectronics International N.V. - Key news
              • Exhibit 170: STMicroelectronics International N.V. - Key offerings
              • Exhibit 171: STMicroelectronics International N.V. - Segment focus
            • 12.15 Verance Corp.
              • Exhibit 172: Verance Corp. - Overview
              • Exhibit 173: Verance Corp. - Product / Service
              • Exhibit 174: Verance Corp. - Key offerings
            • 12.16 Verimatrix Inc.
              • Exhibit 175: Verimatrix Inc. - Overview
              • Exhibit 176: Verimatrix Inc. - Product / Service
              • Exhibit 177: Verimatrix Inc. - Key offerings
            • 12.17 Wellav Technologies Ltd.
              • Exhibit 178: Wellav Technologies Ltd. - Overview
              • Exhibit 179: Wellav Technologies Ltd. - Product / Service
              • Exhibit 180: Wellav Technologies Ltd. - Key offerings

            13 Appendix

            • 13.1 Scope of the report
              • 13.2 Inclusions and exclusions checklist
                • Exhibit 181: Inclusions checklist
                • Exhibit 182: Exclusions checklist
              • 13.3 Currency conversion rates for US$
                • Exhibit 183: Currency conversion rates for US$
              • 13.4 Research methodology
                • Exhibit 184: Research methodology
                • Exhibit 185: Validation techniques employed for market sizing
                • Exhibit 186: Information sources
              • 13.5 List of abbreviations
                • Exhibit 187: List of abbreviations

              Research Methodology

              Technavio presents a detailed picture of the market by way of study, synthesis, and summation of data from multiple sources. The analysts have presented the various facets of the market with a particular focus on identifying the key industry influencers. The data thus presented is comprehensive, reliable, and the result of extensive research, both primary and secondary.

              INFORMATION SOURCES

              Primary sources

              • Manufacturers and suppliers
              • Channel partners
              • Industry experts
              • Strategic decision makers

              Secondary sources

              • Industry journals and periodicals
              • Government data
              • Financial reports of key industry players
              • Historical data
              • Press releases

              DATA ANALYSIS

              Data Synthesis

              • Collation of data
              • Estimation of key figures
              • Analysis of derived insights

              Data Validation

              • Triangulation with data models
              • Reference against proprietary databases
              • Corroboration with industry experts

              REPORT WRITING

              Qualitative

              • Market drivers
              • Market challenges
              • Market trends
              • Five forces analysis

              Quantitative

              • Market size and forecast
              • Market segmentation
              • Geographical insights
              • Competitive landscape

              Interested in this report?

              Get your sample now to see our research methodology and insights!

              Download Now

              Frequently Asked Questions

              Content Protection market growth will increase by $ 1.03 bn during 2024-2028.

              The Content Protection market is expected to grow at a CAGR of 11.24% during 2024-2028.

              Content Protection market is segmented by End-user( Large enterprise, Small, medium enterprise) Type( Conditional access systems, Digital rights management, Digital watermarking, Others)

              Adobe Inc., Alphabet Inc., Axinom GmbH, Cisco Systems Inc., CommScope Holding Co. Inc., Digimarc Corp., EZDRM Inc., Friend MTS Ltd., Intel Corp., Intertrust Technologies Corp., Kudelski SA, Locklizard Ltd., Microsoft Corp., NASPERS Ltd., RGB Spectrum, Sony Group Corp., STMicroelectronics International N.V., Verance Corp., Verimatrix Inc., Wellav Technologies Ltd. are a few of the key vendors in the Content Protection market.

              North America will register the highest growth rate of 38% among the other regions. Therefore, the Content Protection market in North America is expected to garner significant business opportunities for the vendors during the forecast period.

              US, Canada, China, UK, France

              • Increase in adoption of content among various industriesContent protection solutions have become a crucial aspect of modern businesses. The adoption of content protection solutions is gaining traction among various industries is the driving factor this market.
              • such as IT and BFSI is the driving factor this market.
              • for all the right reasons. The industry is witnessing heightened demand for content protection solutions as businesses recognize the need to safeguard their sensitive data from cyber threats and breaches. One of the main reasons for the increase in the adoption of content protection as a service is the growing number of cyber threats. With the increasing sophistication of cyber-attacks and the rise of content breaches is the driving factor this market.
              • businesses need to invest in advanced security measures to protect their content from potential threats. The adoption of content protection as a service allows businesses to leverage expertise and resources from third-party providers is the driving factor this market.
              • who are specialists in content protection solutions. Another critical driver for the adoption of content protection as a solution is the increasing regulations around data protection. The introduction of data protection laws such as the GDPR and the California Consumer Privacy Act (CCPA) has forced businesses to prioritize the protection of their customers data. Many businesses see content protection as a service as a cost-effective and efficient solution to comply with such regulations. By outsourcing their content protection needs to a third-party provider is the driving factor this market.
              • businesses can stay up to date with the latest compliance requirements. Moreover is the driving factor this market.
              • the adoption of data protection as a service can help businesses scale according to their needs. As businesses grow is the driving factor this market.
              • they generate more content is the driving factor this market.
              • and the complexity of content protection increases. Third-party service providers offer various solutions is the driving factor this market.
              • such as managed backup and recovery is the driving factor this market.
              • to ensure that businesses can protect their content reliably. These solutions are flexible and can be customized as per the needs of individual companies is the driving factor this market.
              • making the service an attractive proposition for businesses looking to scale their IT infrastructure. Thus is the driving factor this market.
              • the abovementioned factors are expected to increase the demand for data protection solutions is the driving factor this market.
              • which will propel the growth of the global content protection market during the forecast period. is the driving factor this market.

              The Content Protection market vendors should focus on grabbing business opportunities from the Large enterprise segment as it accounted for the largest market share in the base year.