Corrosion Protective Coatings And Acid Proof Lining Market Size 2025-2029
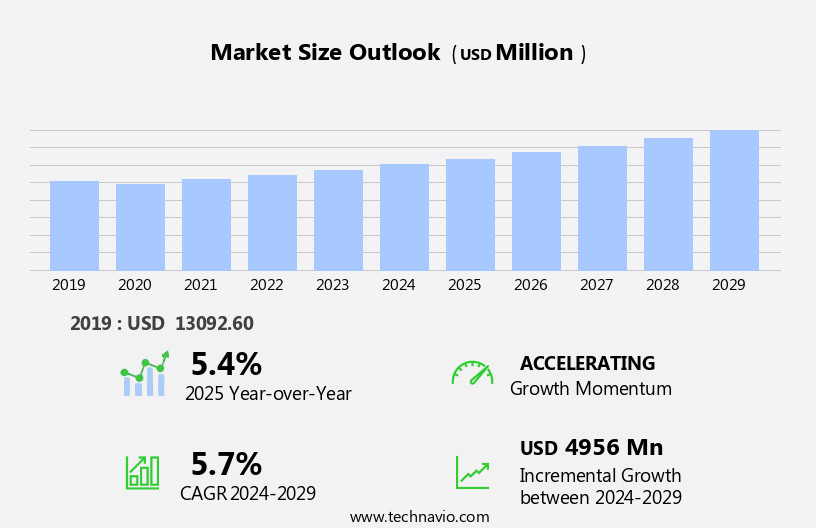
The corrosion protective coatings and acid proof lining market size is forecast to increase by USD 4.96 billion, at a CAGR of 5.7% between 2024 and 2029.
- The market is driven by the ongoing industrialization and infrastructure development across various sectors, including oil and gas, power generation, and water treatment. This growth is attributed to the increasing demand for durable and protective coatings and linings that can withstand harsh environments and corrosive substances. Additionally, the introduction of new products, such as high-performance coatings with advanced properties, is expanding the market's scope and attracting new customers. However, the market faces several challenges. Environmental concerns and regulatory compliance are becoming increasingly stringent, leading to the adoption of eco-friendly and sustainable coating solutions. Regulations limiting the use of certain chemicals and VOCs in coatings are driving the development of alternative technologies.
- Furthermore, the high cost of raw materials and the complexity of application processes pose challenges for market participants, requiring them to optimize their production processes and explore cost-effective solutions to remain competitive. Companies seeking to capitalize on market opportunities must focus on innovation, sustainability, and cost-effectiveness to meet the evolving demands of the market.
What will be the Size of the Corrosion Protective Coatings And Acid Proof Lining Market during the forecast period?
The market continue to evolve, driven by the diverse requirements of various sectors. Epoxy coatings, known for their excellent adhesion and impact resistance, are widely used in chemical processing industries for corrosion mitigation. Magnetic particle testing and penetrant testing are essential for ensuring coating quality and detecting defects. Brush application and airless spraying are popular techniques for coating application, with ASTM standards providing guidelines for consistent results. Fluoropolymer coatings offer exceptional chemical resistance, making them suitable for extreme environments. Coating specifications and curing processes vary, with factors such as pigment concentration, solvent content, and curing time influencing performance.
Corrosion prevention is crucial in mining and metallurgy, where acid proof grout and linings are essential for protecting against chemical attacks. Inorganic coatings and thermal spray coatings provide superior temperature resistance for power generation applications. Coating maintenance and inspection are ongoing processes, with ultrasonic testing and eddy current testing used for non-destructive evaluation. Acid proof tile, brick, and mortar are integral components of wastewater treatment systems, while high-performance coatings offer UV resistance for outdoor applications in industries such as oil and gas, pulp and paper, and food processing. Coating removal and application techniques like sand blasting, shot blasting, and abrasive blasting are essential for surface preparation.
The evolving market dynamics reflect the continuous demand for advanced coating solutions that offer superior corrosion resistance, impact resistance, and chemical resistance.
How is this Corrosion Protective Coatings And Acid Proof Lining Industry segmented?
The corrosion protective coatings and acid proof lining industry research report provides comprehensive data (region-wise segment analysis), with forecasts and estimates in "USD million" for the period 2025-2029, as well as historical data from 2019-2023 for the following segments.
- Product Type
- CPC
- APL
- Technology
- Solvent borne
- Waterborne
- Powder-based
- End-user
- Marine industry
- Oil and gas industry
- Chemical industry
- Power generation industry
- Others
- Geography
- North America
- US
- Canada
- Europe
- France
- Germany
- Spain
- UK
- APAC
- China
- India
- Japan
- South Korea
- Rest of World (ROW)
- North America
By Product Type Insights
The cpc segment is estimated to witness significant growth during the forecast period.
Corrosion protective coatings play a crucial role in safeguarding metal and concrete surfaces from environmental degradation, chemical exposure, and mechanical wear. These coatings bolster durability and extend the lifespan of infrastructure and industrial equipment. The market encompasses a diverse array of coatings, each tailored to address specific corrosion protection requirements. Epoxy coatings, for instance, are renowned for their robust adhesion, chemical resistance, and ability to form a protective layer against corrosion. Their widespread usage can be attributed to their effectiveness in industries such as marine, oil and gas, chemical, and power generation. In these sectors, equipment and structures often encounter harsh chemicals and corrosive elements, making epoxy coatings an indispensable choice for corrosion prevention.
Waterjet cutting, solvent cleaning, and surface cleaning are essential steps in the preparation process for applying these coatings. Coating adhesion is a critical factor in ensuring the effectiveness of the protective layer. Mining and metallurgy industries, where the equipment is subjected to extreme conditions, heavily rely on chemical-resistant coatings for optimal performance. Vinyl ester coatings, with their high temperature resistance and excellent chemical resistance, are increasingly popular in wastewater treatment applications. Penetrant testing, dip coating, and nondestructive testing techniques are employed to assess coating thickness and quality. ISO and NACE standards provide guidelines for coating application and inspection.
In the chemical process industries, coating life cycle and pigment concentration are essential factors in selecting the appropriate coating formulation. Coating maintenance, including spray application, corrosion monitoring, and electrostatic spraying, is crucial for ensuring the continued effectiveness of the protective layer. Thermal spray coatings and ceramic coatings offer enhanced abrasion resistance and UV resistance, respectively. Corrosion prevention is a top priority in industries such as food processing and pharmaceutical manufacturing, where the consequences of equipment failure can be severe. Surface preparation, including sand blasting, shot blasting, and abrasive blasting, is a crucial step in ensuring the effectiveness of the protective coating.
Coating removal and application techniques, such as brush application, airless spraying, and HVLP spraying, are essential for achieving a uniform, high-quality coating. Inorganic coatings, acid-resistant coatings, and epoxy coatings are popular choices for various applications due to their unique properties. Coating specifications, such as impact resistance and magnetic particle testing, ensure the coatings meet the required standards. Coating durability, curing process, and coating drying time are essential factors in evaluating the overall performance of the protective coating. Corrosion mitigation strategies, including acrylic coatings and polyurethane coatings, are increasingly being adopted to minimize the need for costly repairs and replacements.
Fluoropolymer coatings offer superior chemical resistance and temperature resistance, making them suitable for use in extreme environments. In conclusion, the corrosion protective coatings market is a dynamic and evolving landscape, driven by the diverse needs of various industries. The selection of the appropriate coating formulation, application technique, and maintenance strategy is crucial for ensuring the longevity and effectiveness of the protective layer.

The CPC segment was valued at USD 9.3 billion in 2019 and showed a gradual increase during the forecast period.
Regional Analysis
APAC is estimated to contribute 41% to the growth of the global market during the forecast period.Technavio’s analysts have elaborately explained the regional trends and drivers that shape the market during the forecast period.
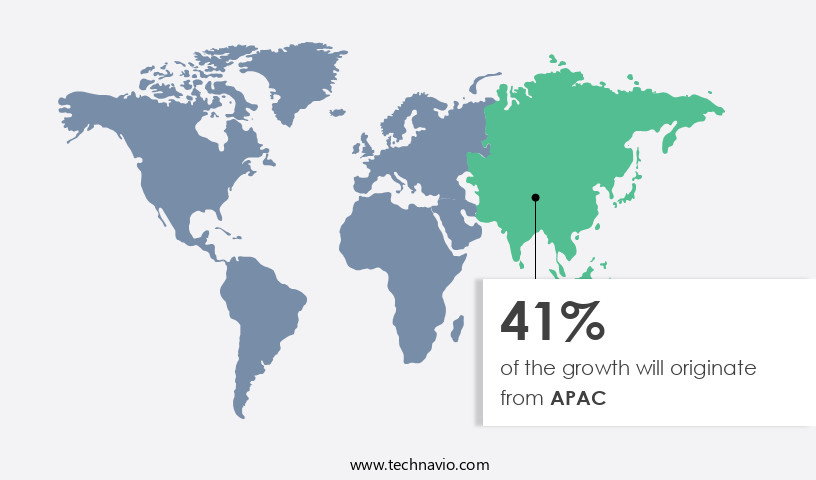
The market in the Asia-Pacific (APAC) region is experiencing significant growth due to rapid industrialization, extensive infrastructure development, and robust demand from key end-use industries such as mining and metallurgy, oil and gas, chemical process industries, power generation, and marine. Organic coatings, including vinyl ester coatings, play a crucial role in this market, providing chemical resistance and excellent coating adhesion. Waterjet cutting and solvent cleaning are essential surface preparation methods used in coating application. ISO standards and NACE standards ensure consistent coating quality and performance. Coating thickness and durability are critical factors in the market, with SSPC and ASTM standards setting industry benchmarks.
Coating formulations, such as epoxy and polyurethane, offer varying levels of impact resistance, temperature resistance, and UV resistance. In the mining and metallurgy sector, sand blasting and abrasive blasting are common surface preparation methods for applying chemical-resistant coatings. Mining companies invest in nondestructive testing techniques like ultrasonic testing, eddy current testing, and magnetic particle testing to monitor coating thickness and detect defects. The oil and gas industry relies on hot-dip galvanizing and thermal spray coatings for corrosion control. In the chemical process industries, coating inspection and chemical cleaning are essential for maintaining coating performance. Coating maintenance, including regular inspection and repair, is crucial for maximizing coating life cycle and reducing replacement costs.
The APAC market is witnessing increased adoption of high-performance coatings, such as ceramic and fluoropolymer coatings, for their superior chemical resistance and abrasion resistance. These coatings are widely used in various industries, including power generation, water treatment, and food processing. In the power generation sector, acid proof grout and acid proof mortar are used for lining boilers and cooling towers to prevent corrosion. The pharmaceutical manufacturing industry also utilizes acid-resistant coatings to ensure product purity and maintain equipment integrity. In conclusion, the market in the APAC region is witnessing robust growth, driven by industrial expansion and increasing demand from various end-use industries.
The market is characterized by continuous innovation, with new coating technologies and applications emerging to address the evolving needs of different industries.
Market Dynamics
Our researchers analyzed the data with 2024 as the base year, along with the key drivers, trends, and challenges. A holistic analysis of drivers will help companies refine their marketing strategies to gain a competitive advantage.
What are the key market drivers leading to the rise in the adoption of Corrosion Protective Coatings And Acid Proof Lining Industry?
- The primary catalyst for market growth is the escalating industrialization and infrastructure development.
- The market experiences significant growth due to increasing industrialization and infrastructure development worldwide. Industrial sectors, particularly in emerging economies, require protective solutions to preserve critical infrastructure and equipment from corrosion, ensuring long-term operational efficiency and reliability. For instance, China's industrial sector demonstrated a 5.8% year-on-year increase in production in 2024, with the manufacturing sector growing at a rate of 6.1%. This robust industrial activity necessitates the use of high-performance coatings, such as HVLP spraying, UV resistance, and inorganic coatings, to safeguard against corrosion. Additionally, industries like pulp and paper, food processing, water treatment, power generation, and chemical cleaning benefit from acid-resistant coatings and ceramic linings.
- The curing process and coating application techniques, including coating inspection and coating removal, are crucial factors influencing market trends. Thermal spray coatings and anti-corrosion coatings offer temperature resistance, making them suitable for various applications. The market's future growth is expected to be driven by the increasing demand for corrosion prevention solutions across various industries.
What are the market trends shaping the Corrosion Protective Coatings And Acid Proof Lining Industry?
- The introduction of new products is a current market trend. It is essential for businesses to stay informed and prepared for the latest innovations in order to remain competitive.
- The market is experiencing notable progress due to the development of advanced products that boost corrosion mitigation and durability. Epoxy coatings, fluoropolymer coatings, and phenolic coatings are among the innovative solutions that provide superior impact resistance and adhere strongly to various surfaces. These coatings undergo rigorous testing, such as magnetic particle testing and coating drying time evaluations, to meet ASTM standards. Application methods like brush application, roller application, and airless spraying ensure efficient and precise coating application. In chemical processing industries, acrylic coatings and acid proof mortar are popular choices due to their high coating resistance.
- Surface preparation is crucial for effective coating application and longevity. In the pharmaceutical manufacturing sector, corrosion resistance is essential to maintain the integrity of equipment and processes. Companies invest in these protective coatings to minimize downtime and maintenance costs. By focusing on enhancing the performance and durability of these coatings, the market is poised for continued growth.
What challenges does the Corrosion Protective Coatings And Acid Proof Lining Industry face during its growth?
- Ensuring environmental sustainability and adhering to regulatory compliance are essential challenges that significantly impact the industry's growth trajectory.
- The market face significant influences from environmental concerns and regulatory compliance. As industries strive to minimize their environmental impact, there is a growing emphasis on eco-friendly solutions for corrosion protection. Traditional coatings, which often contain volatile organic compounds (VOCs), heavy metals, and other harmful substances, contribute to air and water pollution. In response, regulatory bodies worldwide have introduced and reinforced regulations to reduce the environmental footprint of industrial coatings. For instance, ISO and NACE standards mandate the use of coatings with improved chemical resistance and reduced VOC content. This trend is particularly prevalent in regions like Europe, North America, and parts of Asia, where stringent regulations are in place.
- Waterjet cutting, solvent cleaning, and sand blasting are common surface preparation methods for applying corrosion protective coatings and acid proof linings. However, these processes can generate significant waste and may not be environmentally friendly. Alternative methods like penetrant testing and ultrasonic testing are gaining popularity due to their non-destructive nature and reduced environmental impact. Vinyl ester coatings and chemical-resistant coatings are increasingly being adopted due to their superior chemical resistance and lower VOC content. Mining and metallurgy industries, as well as wastewater treatment facilities, are major consumers of these coatings due to their high demand for corrosion protection in harsh environments.
- In conclusion, the market is undergoing a transformation as environmental concerns and regulatory compliance take center stage. The shift towards more eco-friendly solutions, such as waterborne coatings and alternative surface preparation methods, is expected to continue driving market growth in the coming years.
Exclusive Customer Landscape
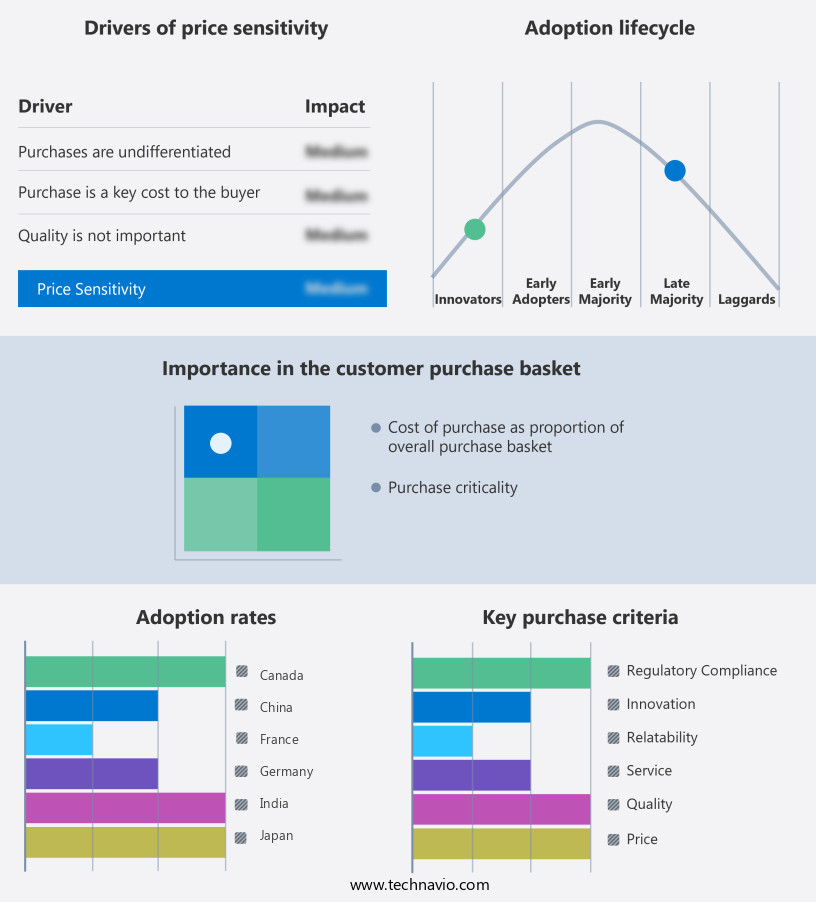
The corrosion protective coatings and acid proof lining market forecasting report includes the adoption lifecycle of the market, covering from the innovator’s stage to the laggard’s stage. It focuses on adoption rates in different regions based on penetration. Furthermore, the corrosion protective coatings and acid proof lining market report also includes key purchase criteria and drivers of price sensitivity to help companies evaluate and develop their market growth analysis strategies.
Customer Landscape
Key Companies & Market Insights
Companies are implementing various strategies, such as strategic alliances, corrosion protective coatings and acid proof lining market forecast, partnerships, mergers and acquisitions, geographical expansion, and product/service launches, to enhance their presence in the industry.
Akzo Nobel NV - The company specializes in the application of corrosion protective coatings and acid-proof linings. Notable offerings include Thick Film Reinforced Linings Enviroline 376F-60 and 450HTR, Thick Film Linings Interline 984, 975(P), 955, and others. These advanced coatings and linings provide superior protection against corrosion and chemical attack, ensuring durability and longevity for various industrial applications. Our team of experts utilizes cutting-edge technologies and rigorous quality control processes to deliver optimal performance and reliability. These solutions cater to diverse industries, enhancing operational efficiency and reducing maintenance costs.
The industry research and growth report includes detailed analyses of the competitive landscape of the market and information about key companies, including:
- Akzo Nobel NV
- Asian Paints Ltd.
- Axalta Coating Systems Ltd.
- BASF
- Berger Paints India Ltd.
- Chitra Insultec Pvt. Ltd.
- Hempel AS
- Henkel AG and Co. KGaA
- Jotun AS
- Kansai Paint Co. Ltd.
- Nippon Paint Holdings Co. Ltd.
- Plasma paints
- PPG Industries Inc.
- RPM International Inc.
- Sika AG
- The Dow Chemical Co.
- The Sherwin Williams Co.
Qualitative and quantitative analysis of companies has been conducted to help clients understand the wider business environment as well as the strengths and weaknesses of key industry players. Data is qualitatively analyzed to categorize companies as pure play, category-focused, industry-focused, and diversified; it is quantitatively analyzed to categorize companies as dominant, leading, strong, tentative, and weak.
Recent Development and News in Corrosion Protective Coatings And Acid Proof Lining Market
- In January 2023, PPG Industries, a leading coatings manufacturer, announced the launch of its new line of corrosion-resistant coatings, named "SPECTRACRON X7," which offers enhanced protection against acidic environments (PPG Industries Press Release, 2023). This innovation is expected to cater to the increasing demand for robust coatings in the oil and gas industry.
- In March 2024, BASF SE, a global chemical producer, entered into a strategic partnership with Corrosion Control Technologies, a leading provider of acid-proof linings. This collaboration aims to combine BASF's expertise in chemical production with Corrosion Control Technologies' knowledge in linings, offering integrated solutions to clients in the power generation and oil & gas sectors (BASF SE Press Release, 2024).
- In June 2024, Axalta Coating Systems, a leading global supplier of liquid and powder coatings, completed the acquisition of the Industrial Coatings business of Sika AG. This acquisition expanded Axalta's product portfolio, providing them with a broader range of corrosion protective coatings and acid-proof linings, strengthening their market position (Axalta Coating Systems Press Release, 2024).
- In October 2025, the European Union approved the new REACH regulation for Organohalogen Compounds (OHCs), which includes certain corrosion inhibitors. This regulation sets new restrictions on the use of OHCs in coatings and linings, driving the development of alternative technologies (European Chemicals Agency, 2025). Companies in the corrosion protective coatings and acid-proof lining market are now focusing on research and development to meet these new regulations, ensuring the continued growth and innovation in the industry.
Research Analyst Overview
- The market encompasses a range of technologies designed to shield assets from corrosion and chemical attack. Barrier coatings, such as powder coatings and high-build epoxy resins, form a protective layer against environmental factors. Sustainable coatings, including low voc and water-based options, offer eco-friendly alternatives. Smart coatings, cathodic protection, and self-healing coatings are advanced technologies that enhance corrosion protection. Cathodic protection methods, like anodic and sacrificial coatings, prevent corrosion by altering the electrochemical environment. Corrosion data analysis and modeling help predict and prevent coating failure. Curing agents, such as phenolic resin and fluoropolymer resin, play a crucial role in the curing process.
- Anti-scaling agents and corrosion inhibitors are additives that improve coating performance. Coating performance evaluation through field testing and laboratory analysis ensures the effectiveness of protective layers. Impressed current systems and corrosion monitoring systems provide real-time data on coating condition, enabling remediation strategies when necessary. Galvanic anodes and sacrificial coatings serve as alternative corrosion protection methods in specific applications. Overall, the market for corrosion protective coatings and acid proof lining continues to evolve, driven by advancements in technology and the need for long-lasting, environmentally friendly solutions.
Dive into Technavio’s robust research methodology, blending expert interviews, extensive data synthesis, and validated models for unparalleled Corrosion Protective Coatings And Acid Proof Lining Market insights. See full methodology.
|
Market Scope |
|
|
Report Coverage |
Details |
|
Page number |
242 |
|
Base year |
2024 |
|
Historic period |
2019-2023 |
|
Forecast period |
2025-2029 |
|
Growth momentum & CAGR |
Accelerate at a CAGR of 5.7% |
|
Market growth 2025-2029 |
USD 4956 million |
|
Market structure |
Fragmented |
|
YoY growth 2024-2025(%) |
5.4 |
|
Key countries |
US, China, India, Germany, UK, Japan, Canada, France, South Korea, and Spain |
|
Competitive landscape |
Leading Companies, Market Positioning of Companies, Competitive Strategies, and Industry Risks |
What are the Key Data Covered in this Corrosion Protective Coatings And Acid Proof Lining Market Research and Growth Report?
- CAGR of the Corrosion Protective Coatings And Acid Proof Lining industry during the forecast period
- Detailed information on factors that will drive the growth and forecasting between 2025 and 2029
- Precise estimation of the size of the market and its contribution of the industry in focus to the parent market
- Accurate predictions about upcoming growth and trends and changes in consumer behaviour
- Growth of the market across APAC, Europe, North America, Middle East and Africa, and South America
- Thorough analysis of the market’s competitive landscape and detailed information about companies
- Comprehensive analysis of factors that will challenge the corrosion protective coatings and acid proof lining market growth of industry companies
We can help! Our analysts can customize this corrosion protective coatings and acid proof lining market research report to meet your requirements.