Cotton Pads Market Size 2024-2028
The cotton pads market size is forecast to increase by USD 151.1 million at a CAGR of 4.5% between 2023 and 2028.
- The market is experiencing significant growth, driven by the increasing environmental consciousness that is compelling companies to develop eco-friendly products. This trend is gaining traction as consumers become more aware of the impact of their purchasing decisions on the environment. In the medical sector, cotton pads are employed in wound care for treating cuts, injuries, and during medical procedures such as blood cleaning, injections, and venipuncture. Additionally, the prominence of online shopping is creating new distribution channels for cotton pads, providing companies with increased reach and access to a wider customer base. However, distribution challenges persist, as the perishable nature of cotton pads necessitates careful handling and timely delivery to maintain product quality. These factors, among others, are shaping the dynamics of the market and presenting both opportunities and challenges for companies.
What will be the Size of the Cotton Pads Market During the Forecast Period?
- The market encompasses the production and distribution of raw cotton pads used in various sectors, including cosmetics and medical applications. These versatile products are integral to face cleansing routines, acting as gentle abrasives for removing makeup, skin impurities, and excess oils. Additionally, cotton pads find extensive use In the household sector for infants, working women, and personal care, including acne treatment and makeup application. The market exhibits significant growth due to the rising demand for skincare and cosmetic products, expanding e-commerce channels, and the increasing prevalence of chronic conditions requiring frequent wound care. Cotton pads come in various shapes and sizes, including square, round, colorful, and oval, catering to diverse consumer preferences.
How is this Cotton Pads Industry segmented and which is the largest segment?
The industry research report provides comprehensive data (region-wise segment analysis), with forecasts and estimates in "USD million" for the period 2024-2028, as well as historical data from 2018-2022 for the following segments.
- Distribution Channel
- Offline
- Online
- Geography
- APAC
- China
- Japan
- Europe
- Germany
- UK
- North America
- US
- Middle East and Africa
- South America
- APAC
By Distribution Channel Insights
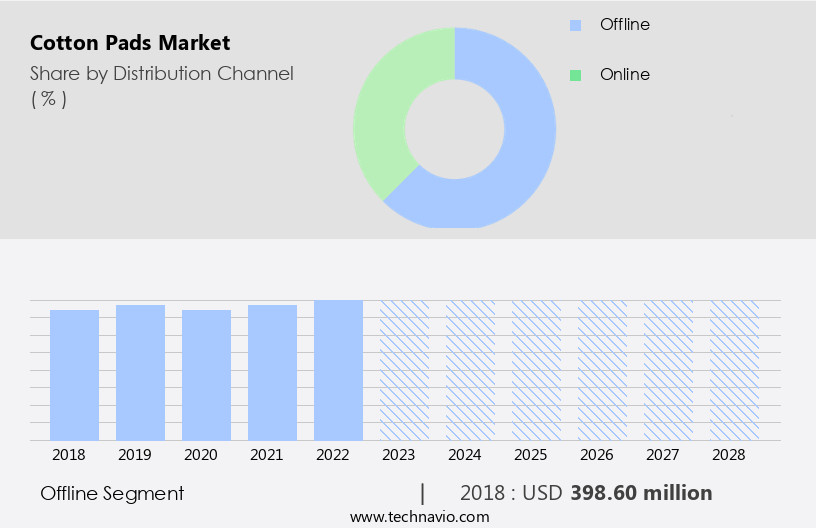
- The offline segment is estimated to witness significant growth during the forecast period.
The market encompasses raw cotton pads utilized in various sectors, including cosmetics and medical applications. In the cosmetics industry, these pads are employed for face cleansing and makeup application and removal. In the medical sector, they are used for treating skin cuts, injuries, and during medical procedures. Personal care and hygiene are other significant areas of application. Long fiber cotton, oil, and liquid-soaked pads are popular options. The working population relies on cosmetics products, such as Square Cotton Pads, Round Cotton Pads, Color Cotton Pads, and Oval Cotton Pads, for their skincare routines, acne treatment, and hair care. The market caters to diverse consumer needs with offerings like Flannel, Bamboo, Microfiber pads, and Hemp pads.
Environmental awareness has led to the popularity of reusable cotton pads and biodegradable fabrics, addressing concerns related to water pollution and bacteria. The pharmaceutical sectors and household sector are other key markets. Millennials and working women are significant consumer groups, with e-commerce channels, such as Amazon and Walmart, offering discounts on various cotton pad products. Consumers prioritize hygiene and health, driving the market growth.
Get a glance at the Industry report of share of various segments Request Free Sample
The offline segment was valued at USD 398.60 million in 2018 and showed a gradual increase during the forecast period.
Regional Analysis
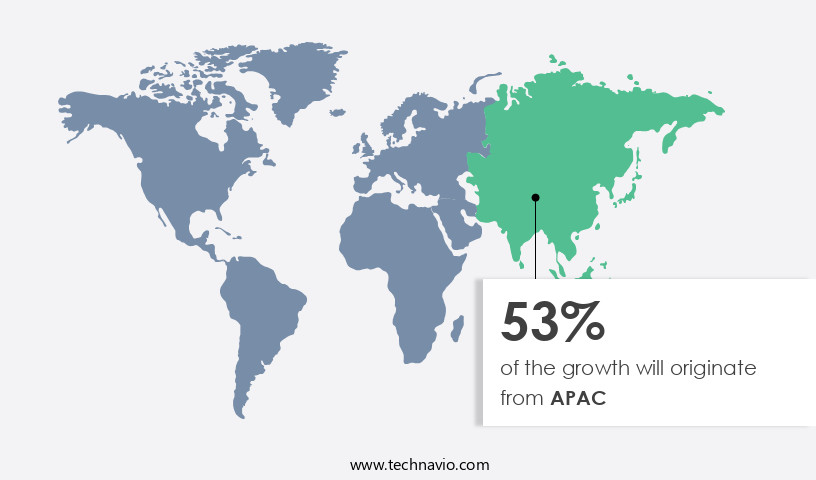
- APAC is estimated to contribute 53% to the growth of the global market during the forecast period.
Technavio's analysts have elaborately explained the regional trends and drivers that shape the market during the forecast period.
For more insights on the market share of various regions, Request Free Sample
The market in Asia Pacific holds a significant share due to increasing awareness among millennials regarding personal care and hygiene. Millions of working women and newborns in countries like India, China, and Japan contribute to the market's growth. Cotton pads are a preferred choice for skincare due to their gentle nature, reducing the risk of skin irritation, acne, and breakouts. In the medical sector, cotton pads are used for blood cleaning during medical procedures such as injections and venipuncture. In the household sector, cotton pads are utilized for various purposes, including makeup application and removal, oil or liquid absorption, and personal hygiene.
Long fiber cotton pads are popular due to their superior absorbency and durability. The rise in environmental awareness has led to the popularity of reusable cotton pads made from eco-friendly materials like bamboo, flannel, and hemp. The pharmaceutical sectors also utilize cotton pads for medical purposes. The Water Footprint Calculator highlights the importance of reducing water consumption, making biodegradable fabrics like cotton an attractive option.
Market Dynamics
Our researchers analyzed the data with 2023 as the base year, along with the key drivers, trends, and challenges. A holistic analysis of drivers will help companies refine their marketing strategies to gain a competitive advantage.
What are the key market drivers leading to the rise In the adoption of Cotton Pads Industry?
Environmental consciousness forces market players to develop eco-friendly products is the key driver of the market.
- The market is experiencing significant growth due to increasing consumer preference for personal care and hygiene products. These pads are widely used for various purposes, including face cleansing, makeup application and removal, and medical procedures. In the cosmetics industry, cotton pads are essential for applying and removing cosmetic products such as oil, liquid foundations, and toners. In the medical sectors, they are used for cleaning skin cuts, injuries, and during medical procedures like blood cleaning, injections, and venipuncture. However, the production of cotton pads contributes to a substantial water footprint, with approximately 20,000 gallons of water required to process one kilogram of cotton. This environmental impact, coupled with the potential presence of bacteria and viruses on reusable cotton pads, is leading to increased demand for biodegradable alternatives. Major manufacturers are responding to this trend by investing in research and development to produce eco-friendly cotton pads made from long fiber cotton, bamboo, microfiber, and other sustainable fabrics.
- The introduction of reusable cotton pads also offers a more cost-effective and convenient solution for consumers. These developments are expected to drive the growth of the market during the forecast period. The working population, particularly millennials, is increasingly conscious of environmental issues and is seeking out more sustainable personal care products. In the household sector, cotton pads are used for various purposes, including acne treatment, skincare routines, and hair care. With the rise of digital business and e-commerce sites, consumers have easy access to a wide range of cotton pad options, including discounts and promotions. Consumer goods analysts predict that the market for cotton pads will continue to grow, driven by increasing demand for eco-friendly and convenient personal care products.
What are the market trends shaping the Cotton Pads Industry?
Growing prominence of online shopping is the upcoming market trend.
- The market has experienced significant growth due to the increasing popularity of online shopping. E-commerce channels, including brand-owned websites, QR portals, and pure-play e-retailers, have expanded the reach of cotton pad products to consumers worldwide. Major retailers, such as Amazon.Com and eBay Inc., dominate the online sales of cotton pads. The proliferation of smartphones and the internet has facilitated the growth of e-commerce, particularly in developing countries like India, Brazil, and Iran. As a result, the sales of cotton pad products through online distribution channels are projected to increase during the forecast period. Cotton pads are used for various purposes, including face cleansing, makeup application and removal, and personal hygiene. In the medical sectors, they are utilized for skin cuts, injuries, blood cleaning during medical procedures, and for applying topical treatments. The working population, including millennials, infants, and working women, frequently use cotton pads for their skincare routines to address acne, break-outs, and other skin concerns. Cotton pads come in various shapes and materials, including raw cotton, long fiber cotton, flannel, bamboo, microfiber, and hemp. These materials cater to the diverse needs of consumers, with some offering environmental benefits such as biodegradability and reduced water consumption, as determined by the Water Footprint Calculator.
- Consumer goods analysts anticipate that the market for cotton pads will continue to grow due to the increasing awareness of personal care and hygiene, as well as the availability of reusable cotton pads, which reduce the risk of bacteria and viruses. The pharmaceutical sectors also utilize cotton pads for medical purposes, such as injections, venipuncture, and swabbing. In the household sector, cotton pads are used for various purposes, including oil and liquid absorption, cleaning, and as makeup removers. The market for cotton pads encompasses a wide range of products, including Square Cotton Pads, Round Cotton Pads, Color Cotton Pads, and Oval Cotton Pads, which cater to both cosmetic and medical uses. Cotton pads are integral to numerous skincare, hair care, makeup, perfumes, toiletries, deodorants, oral cosmetics, and personal hygiene products. The market for these consumer goods is expected to grow due to increasing environmental awareness, the availability of eco-friendly alternatives, and the convenience offered by online shopping through various e-commerce sites and discounts.
- In summary, The market is expected to grow significantly due to the increasing trend of online shopping, the diverse range of applications for cotton pads, and the growing awareness of personal care and hygiene. The market caters to various consumer needs, from personal use to medical procedures, and offers a wide range of products made from various materials, including raw cotton, long fiber cotton, flannel, bamboo, microfiber, and hemp. The availability of eco-friendly alternatives and the convenience of online shopping are expected to drive the growth of the market during the forecast period.
What challenges does the Cotton Pads Industry face during its growth?
Distribution challenges for cotton pads is a key challenge affecting the industry growth.
- Cotton pads are a staple in both the cosmetics and medical sectors for various uses such as face cleansing, makeup application, and removal. The raw materials for cotton pads include long fiber cotton, flannel, bamboo, and microfiber. In the cosmetics industry, cotton pads are used for applying oils, liquids, and other cosmetic products. In the medical sectors, they are used for cleaning wounds, injuries, and during medical procedures like blood cleaning, injections, and venipuncture. Manufacturers face challenges In the cotton pad market, including price pressure and thin profit margins due to the competitive landscape and retailers' low profit margins. Retailers demand frequent and smaller product deliveries to minimize warehousing costs, which can put additional strain on manufacturers. If a retailer experiences a shortage of supply from a particular company, they may seek alternatives to maintain revenue stability. Consumers, particularly millennials, are increasingly aware of environmental concerns and prefer reusable cotton pads made of biodegradable fabrics like bamboo, hemp, or cotton. The pharmaceutical sectors and household sector also contribute to the demand for cotton pads.
- The water footprint calculator highlights the importance of water conservation, and cotton pad manufacturers are under pressure to reduce water consumption during production. The digital business landscape, including e-commerce sites and online shopping, is a significant distribution channel for cotton pad products. Consumer goods analysts forecast growth In the market for cosmetic use, skincare products, hair care products, makeup products, perfumes, toiletries, deodorants, oral cosmetics, and personal hygiene items. Square Cotton Pads, Round Cotton Pads, Color Cotton Pads, and Oval Cotton Pads cater to various uses in both the cosmetic and medical sectors. Despite these challenges, the cotton pad market remains dynamic, with continued demand from various industries, including the medical sector, household sector, and cosmetics industry. Consumers' increasing focus on personal care, hygiene, and environmental awareness drives the market's growth. Government investment in healthcare and the increasing prevalence of acne, break-outs, and skincare routines further fuel the demand for cotton pad products.
Exclusive Customer Landscape
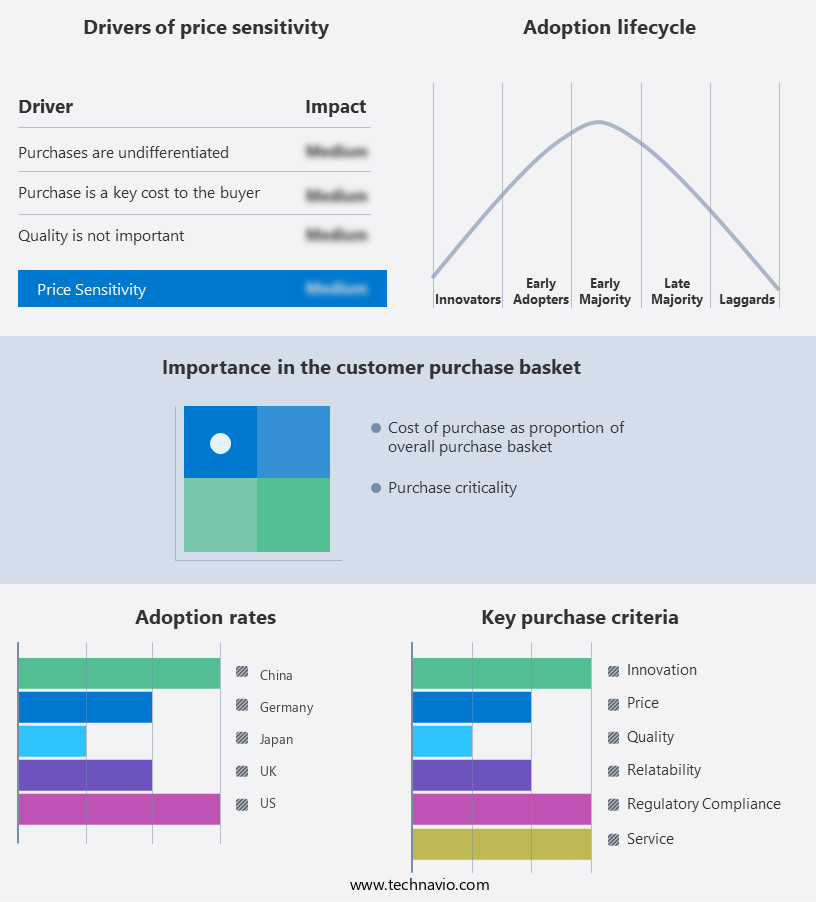
The market forecasting report includes the adoption lifecycle of the market, market growth and forecasting, covering from the innovator's stage to the laggard's stage. It focuses on adoption rates in different regions based on penetration. Furthermore, the market report also includes key purchase criteria and drivers of price sensitivity to help companies evaluate and develop their market growth analysis strategies.
Customer Landscape
Key Companies & Market Insights
Companies are implementing various strategies, such as strategic alliances, market forecast, partnerships, mergers and acquisitions, geographical expansion, and product/service launches, to enhance their presence In the industry.The industry research and growth report includes detailed analyses of the competitive landscape of the market and information about key companies, including:
- Cotton Club Co., Ltd.
- COTTON HIGH TECH SL
- Falu AG
- Jainam Invamed Pvt. Ltd.
- Jaycot Industries
- Lohmann and Rauscher GmbH and Co. KG
- LVMH Group.
- MUMUSO Shanghai Co. Ltd.
- Ontex BV
- Precot Ltd.
- Rael Inc.
- Sanitars Spa
- SEPTONA SA
- Shiseido Co. Ltd.
- SISMA Spa
- TZMO SA
- Unicharm Corp.
Qualitative and quantitative analysis of companies has been conducted to help clients understand the wider business environment as well as the strengths and weaknesses of key industry players. Data is qualitatively analyzed to categorize companies as pure play, category-focused, industry-focused, and diversified; it is quantitatively analyzed to categorize companies as dominant, leading, strong, tentative, and weak.
Research Analyst Overview
The cotton pad market encompasses a wide range of products used in various sectors, including cosmetics and medical applications. These pads, typically made from raw cotton, serve essential functions in both personal care and hygiene routines. In the cosmetics industry, cotton pads are extensively utilized for face cleansing, makeup application, and removal. Long fiber cotton pads are particularly popular due to their superior absorption capabilities and gentle touch. However, alternatives such as flannel, bamboo, and microfiber pads have gained traction due to their unique properties. For instance, bamboo pads are known for their eco-friendliness and biodegradability, while microfiber pads offer a more reusable and washable solution. The medical sectors also heavily rely on cotton pads for various purposes. They are used in treating skin cuts, injuries, and as a base for topical applications. In medical procedures, cotton pads play a crucial role in blood cleaning during injections and venipuncture. Reusable cotton pads are increasingly being adopted in this sector due to their cost-effectiveness and reduced environmental impact. The working population, especially millennials, has shown a growing interest in personal care and hygiene products.
Moreover, cotton pads are no exception. With the rise of digital business and e-commerce sites, online shopping for consumer goods, including cotton pads, has become increasingly popular. Consumer goods analysts predict a significant growth In the demand for cotton pads due to their versatility and convenience. The environmental awareness trend has led to the development of new cotton pad alternatives, such as those made from hemp and other biodegradable fabrics. This shift is driven by concerns over water footprint calculators and water consumption, as well as the negative impact of viruses and bacteria on traditional cotton production. In the household sector, cotton pads are used for various purposes, such as cleaning and oil or liquid absorption.
Thus, they are also used in skincare routines for acne treatment and break-outs. The market offers a diverse range of cotton pad sizes and colors to cater to different consumer preferences. The cotton pad market dynamics are influenced by various factors, including consumer trends, technological advancements, and government investment in healthcare and hygiene sectors. Despite the competition from alternative materials, cotton pads continue to maintain a strong presence due to their versatility, affordability, and widespread availability.
|
Market Scope |
|
|
Report Coverage |
Details |
|
Page number |
134 |
|
Base year |
2023 |
|
Historic period |
2018-2022 |
|
Forecast period |
2024-2028 |
|
Growth momentum & CAGR |
Accelerate at a CAGR of 4.5% |
|
Market growth 2024-2028 |
USD 151.1 million |
|
Market structure |
Fragmented |
|
YoY growth 2023-2024(%) |
4.24 |
|
Key countries |
US, China, UK, Germany, and Japan |
|
Competitive landscape |
Leading Companies, Market Positioning of Companies, Competitive Strategies, and Industry Risks |
What are the Key Data Covered in this Market Research and Growth Report?
- CAGR of the industry during the forecast period
- Detailed information on factors that will drive the growth and forecasting between 2024 and 2028
- Precise estimation of the size of the market and its contribution of the industry in focus to the parent market
- Accurate predictions about upcoming growth and trends and changes in consumer behaviour
- Growth of the market across APAC, Europe, North America, Middle East and Africa, and South America
- Thorough analysis of the market's competitive landscape and detailed information about companies
- Comprehensive analysis of factors that will challenge the market growth of industry companies
We can help! Our analysts can customize this market research report to meet your requirements.


