Couriers Market Analysis, Size, and Forecast 2026-2030: APAC (China, India, and Japan), North America (US, Canada, and Mexico), Europe (UK, Germany, and France), Middle East and Africa (Saudi Arabia, South Africa, and UAE), South America (Brazil, Argentina, and Colombia), and Rest of World (ROW)

Couriers Market Analysis, Size, and Forecast 2026-2030:
APAC (China, India, and Japan), North America (US, Canada, and Mexico), Europe (UK, Germany, and France), Middle East and Africa (Saudi Arabia, South Africa, and UAE), South America (Brazil, Argentina, and Colombia), and Rest of World (ROW)

Published: Dec 2025 293 Pages SKU: IRTNTR80135

Market Overview at a Glance

$134.2 B
Market Opportunity
7.3%
CAGR 2025 - 2030
46.8%
APAC Growth
$158.3 B
Business to business segment 2024

Couriers Market Size 2026-2030

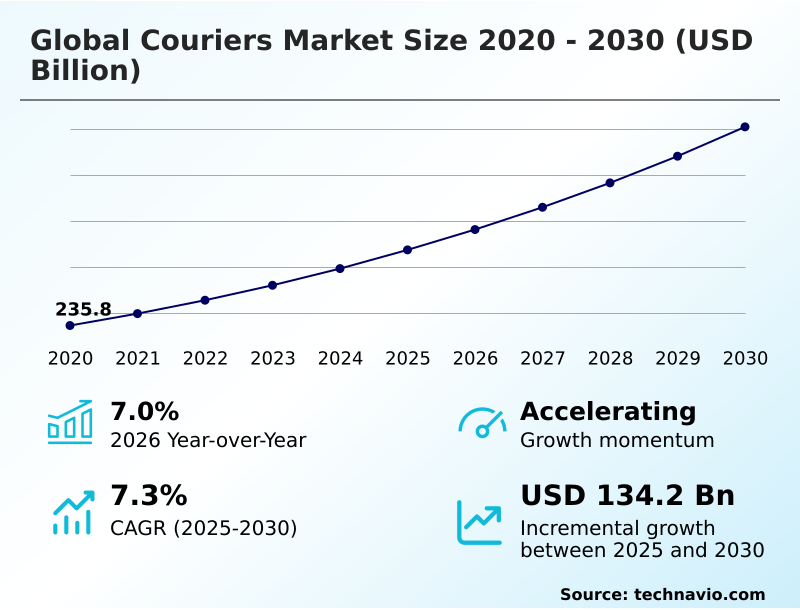
The couriers market size is valued to increase by USD 134.2 billion, at a CAGR of 7.3% from 2025 to 2030. Burgeoning e-commerce expansion will drive the couriers market.

Major Market Trends & Insights

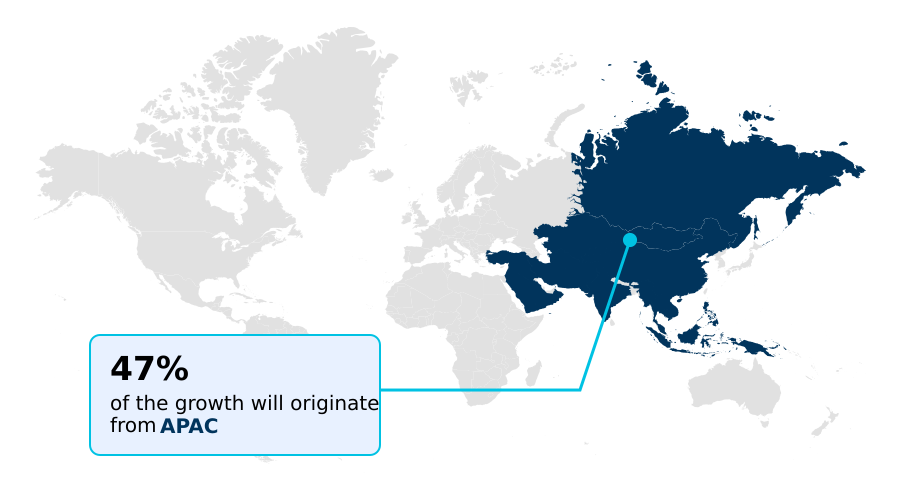
  • APAC dominated the market and accounted for a 46.8% growth during the forecast period.
  • By Consumer - Business to business segment was valued at USD 158.3 billion in 2024
  • By Type - International segment accounted for the largest market revenue share in 2024

Market Size & Forecast

  • Market Opportunities: USD 216.7 billion
  • Market Future Opportunities: USD 134.2 billion
  • CAGR from 2025 to 2030 : 7.3%

Market Summary

  • The couriers market is defined by its critical role in global commerce, driven by the relentless expansion of e-commerce and the intricate demands of modern supply chains. This industry is undergoing a significant transformation through technological adoption, with automation in sorting centers and AI-powered route optimization becoming standard for enhancing efficiency and meeting consumer expectations for speed.
  • Key trends include a strong push towards sustainability, with investments in electric fleets and eco-friendly packaging, alongside a growing demand for hyper-personalized delivery options that give consumers more control. For instance, a global retailer can leverage an integrated courier network to offer customers flexible delivery windows and real-time tracking, improving satisfaction and loyalty.
  • However, the market also contends with substantial challenges, including escalating operational costs from fuel and labor, worsening urban congestion that complicates last-mile delivery, and the complexities of navigating diverse international trade regulations. Success depends on balancing cost-efficiency with service innovation and sustainability.

What will be the Size of the Couriers Market during the forecast period?

Get Key Insights on Market Forecast (PDF) Request Free Sample

How is the Couriers Market Segmented?

The couriers industry research report provides comprehensive data (region-wise segment analysis), with forecasts and estimates in "USD billion" for the period 2026-2030, as well as historical data from 2020-2024 for the following segments.

  • Consumer
    • Business to business
    • Business to consumer
    • Consumer to consumer
  • Type
    • International
    • Domestic
  • Service
    • Standard delivery
    • Express delivery
    • Last-mile delivery
    • Same-day delivery
  • Geography
    • APAC
      • China
      • India
      • Japan
    • North America
      • US
      • Canada
      • Mexico
    • Europe
      • UK
      • Germany
      • France
    • Middle East and Africa
      • Saudi Arabia
      • South Africa
      • UAE
    • South America
      • Brazil
      • Argentina
      • Colombia
    • Rest of World (ROW)

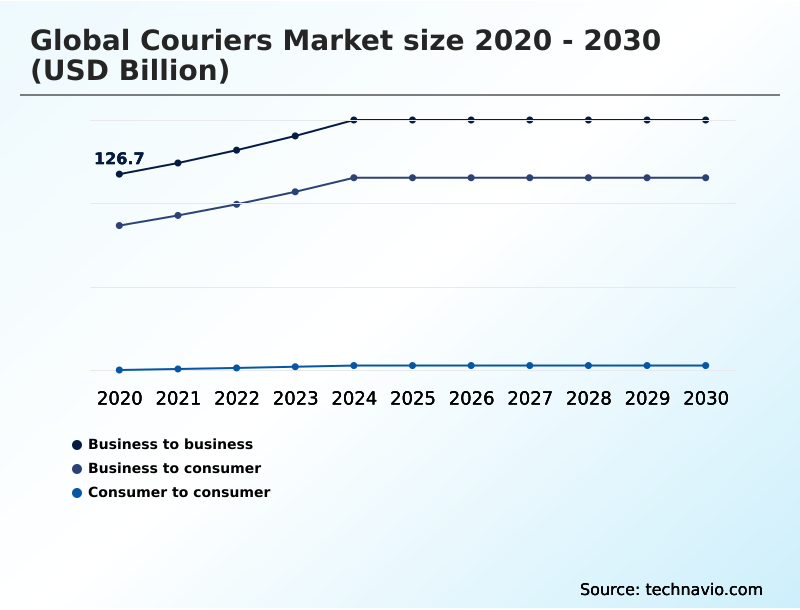
By Consumer Insights

The business to business segment is estimated to witness significant growth during the forecast period.

The business-to-business segment is foundational, driven by complex corporate logistics and the need for high-value goods transport. Effective b2b logistics integration is critical, often facilitated by a third-party logistics partnership to manage freight forwarding services and secure document transport.

Companies prioritize complete supply chain visibility and require time-definite international express services for just-in-time inventory support.

A focus on carrier performance metrics ensures service level agreement monitoring is met, with efficient package handling automation within a smart logistics infrastructure reducing shipping errors by up to 12%.

This segment relies heavily on expert customs brokerage services to navigate international trade, ensuring seamless, reliable delivery for enterprise clients.

Request Free Sample

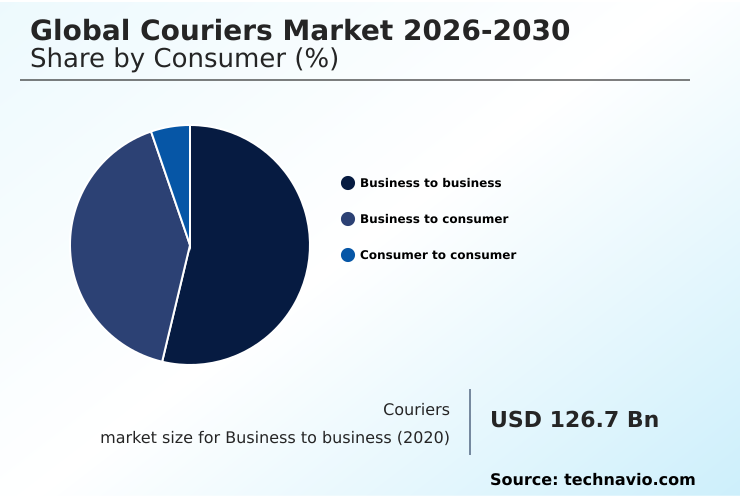
The Business to business segment was valued at USD 158.3 billion in 2024 and showed a gradual increase during the forecast period.

Request Free Sample

Regional Analysis

APAC is estimated to contribute 46.8% to the growth of the global market during the forecast period.Technavio’s analysts have elaborately explained the regional trends and drivers that shape the market during the forecast period.

See How Couriers Market Demand is Rising in APAC Request Free Sample

The global geographic landscape is characterized by diverse growth rates and unique regional challenges. APAC leads expansion, projected to grow at 8.6% and contributing nearly 47% of the market's incremental growth, driven by booming e-commerce in China and India.

In contrast, North America and Europe show more moderate growth at 6.4% and 6.0%, respectively, focusing on optimizing mature networks through robotic process automation in logistics and route optimization software.

These developed regions are pioneering ai-powered route planning and the use of automated guided vehicles. Specialized services such as cold chain courier services and temperature-controlled shipping are becoming critical differentiators, especially for pharmaceutical logistics.

Efficient reverse logistics management and intermodal freight transport are key to managing costs, while parcel consolidation services and cross-docking services enhance network efficiency.

Market Dynamics

Our researchers analyzed the data with 2025 as the base year, along with the key drivers, trends, and challenges. A holistic analysis of drivers will help companies refine their marketing strategies to gain a competitive advantage.

  • Strategic decisions in the global couriers market are increasingly influenced by a complex set of operational and technological factors. The impact of automation on last-mile delivery cost is a central theme, as companies seek to improve efficiency with ai-powered route optimization.
  • This is closely tied to the role of iot in real-time shipment tracking, which provides the visibility needed to manage customer expectations and navigate the challenges in urban last-mile logistics management. Concurrently, there is a significant push toward reducing carbon footprint in courier operations, which involves integrating sustainable logistics into supply chains and adopting greener technologies.
  • On the commercial side, understanding dimensional weight pricing impact on shipping costs is crucial for profitability, while the benefits of parcel locker networks in cities are being leveraged to enhance delivery density. For cross-border trade, compliance with international customs regulations and managing data privacy in cross-border e-commerce shipping are non-negotiable.
  • Many are now evaluating multi-carrier shipping software benefits to diversify carrier dependence. The future of autonomous delivery vehicles and drones continues to be explored, promising further disruption. The implementation of cold chain courier services for pharma and leveraging predictive analytics for delivery times are key for specialized segments.
  • The cost-benefit analysis of robotic process automation shows that it can enhance throughput by over 40% compared to manual sorting, while geofencing applications for improving delivery accuracy reduce failed delivery attempts.

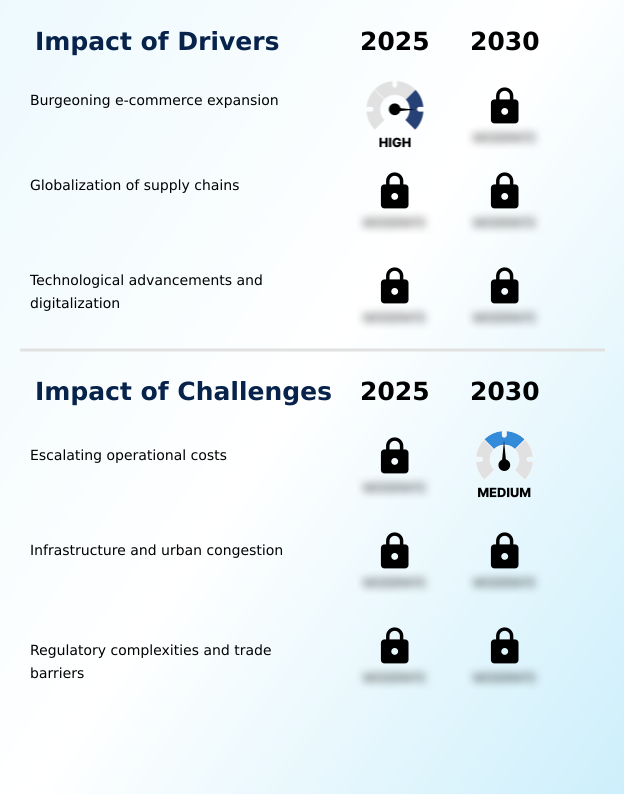
What are the key market drivers leading to the rise in the adoption of Couriers Industry?

  • The burgeoning expansion of the global e-commerce sector is the paramount driver fueling unprecedented demand for efficient and reliable parcel delivery services.

  • The market's robust growth is fundamentally powered by the expansion of digital commerce and technological advancements in logistics.
  • A well-orchestrated e-commerce fulfillment network is essential to manage the high volume of parcels, with cross-border e-commerce contributing to a 15% year-over-year increase in international shipments for some carriers.
  • Efficient cross-border customs clearance, aided by digital platforms, is critical for managing geopolitical trade compliance. The adoption of multi-carrier shipping software allows shippers to optimize costs and service levels.
  • Technologically, iot-enabled fleet management provides the data for predictive delivery analytics, which can improve on-time delivery rates by 18%. This data, captured via e-pod (electronic proof of delivery), offers complete shipment lifecycle visibility.
  • Furthermore, advanced mobile workforce management and digital freight matching platforms are crucial for peak season capacity planning and optimizing first-mile pickup services to ensure a seamless last-mile delivery experience.

What are the market trends shaping the Couriers Industry?

  • A prominent market trend is the increasing adoption of sustainable logistics solutions. This shift is driven by stricter emissions regulations and growing stakeholder demands for corporate environmental responsibility.

  • The market is increasingly shaped by a focus on sustainability and customer-centric innovation. The adoption of sustainable logistics solutions is a primary trend, with leading firms achieving up to a 15% reduction in urban emissions by transitioning to electric fleets. This move supports goals for carbon-neutral delivery operations and is complemented by the use of eco-friendly packaging solutions.
  • Simultaneously, hyper-personalization in delivery is becoming a key differentiator, with platforms offering alternative pickup locations and customer self-service portals boosting customer retention by 25%. This includes premium options like white-glove delivery service. The expansion of parcel locker networks and the availability of contactless delivery solutions cater to modern consumer preferences for convenience and safety.
  • The growth of omnichannel retail logistics and experimental crowdsourced delivery models further diversifies last-mile strategies, while the potential of autonomous delivery vehicles and delivery drone technology continues to drive long-term strategic investments.

What challenges does the Couriers Industry face during its growth?

  • Escalating operational costs, stemming from volatile fuel prices and rising labor expenses, present a primary challenge to profitability and sustainable growth within the industry.

  • Navigating operational complexities and rising costs presents a significant challenge for market participants. Last-mile delivery optimization remains a primary hurdle, as urban congestion can increase delivery times by over 30% during peak hours, necessitating dynamic route adjustment and the use of urban logistics micro-hubs. The adoption of dimensional weight pricing adds another layer of cost complexity for shippers.
  • To counteract this, companies are implementing dynamic pricing algorithms and network densification strategy frameworks. Managing the middle-mile transportation network efficiently with advanced load balancing algorithms is crucial. Furthermore, the industry grapples with delivery exception management and the stringent requirements of hazardous materials shipping.
  • The rise of on-demand delivery platforms has intensified competition, while the backend requires sophisticated geofencing for delivery accuracy and highly efficient automated sorting systems to maintain profitability and service standards.

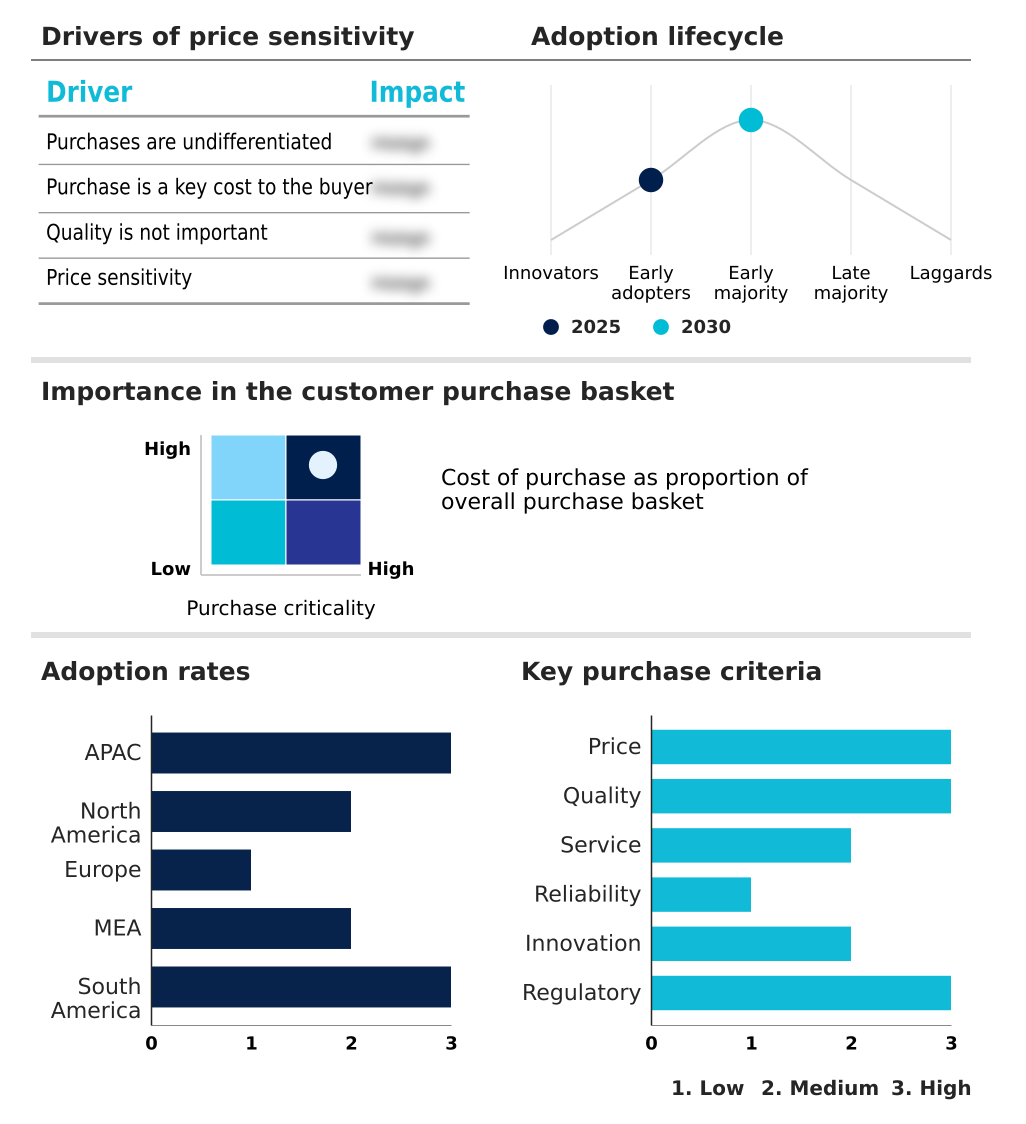
Exclusive Technavio Analysis on Customer Landscape

The couriers market forecasting report includes the adoption lifecycle of the market, covering from the innovator’s stage to the laggard’s stage. It focuses on adoption rates in different regions based on penetration. Furthermore, the couriers market report also includes key purchase criteria and drivers of price sensitivity to help companies evaluate and develop their market growth analysis strategies.

Customer Landscape of Couriers Industry

Competitive Landscape

Companies are implementing various strategies, such as strategic alliances, couriers market forecast, partnerships, mergers and acquisitions, geographical expansion, and product/service launches, to enhance their presence in the industry.

Action Bag Co. - Analysis shows a strategic focus on time-definite international express, integrated e-commerce logistics, and comprehensive supply chain solutions for global business operations.

The industry research and growth report includes detailed analyses of the competitive landscape of the market and information about key companies, including:

  • Action Bag Co.
  • Active Packaging Ltd.
  • Amcor Plc
  • Aramex International LLC
  • Aristo Flexi Pack
  • Bag Products
  • DHL International GmbH
  • Dongguan Pasike Packaging Co. Ltd.
  • Euphoria Packaging Pvt. Ltd.
  • FedEx Corp.
  • International Paper Co.
  • Janak Packers
  • Mondi Plc
  • PAC Worldwide
  • Packman Packaging Pvt. Ltd.
  • Poddar Mercantile Pvt. Ltd.
  • Riverside Paper Co. Inc.
  • Sealed Air Corp.
  • Vedang Polyflex LLP

Qualitative and quantitative analysis of companies has been conducted to help clients understand the wider business environment as well as the strengths and weaknesses of key industry players. Data is qualitatively analyzed to categorize companies as pure play, category-focused, industry-focused, and diversified; it is quantitatively analyzed to categorize companies as dominant, leading, strong, tentative, and weak.

Recent Development and News in Couriers market

  • In September 2024, FedEx Corp. announced the successful pilot of its new AI-driven predictive logistics platform, reportedly reducing sorting errors by 12% in test facilities, enhancing operational efficiency.
  • In December 2024, DHL International GmbH committed to purchasing 5,000 new electric delivery vehicles as part of its GoGreen initiative, aiming to electrify 60% of its last-mile fleet in key urban centers.
  • In March 2025, UPS Inc. finalized a strategic partnership with a leading European e-commerce marketplace to become its exclusive provider for cross-border deliveries, expanding its network and service offerings in the region.
  • In May 2025, Aramex International LLC announced the acquisition of a last-mile technology startup specializing in drone delivery for a reported USD 75 million, signaling a push into autonomous logistics solutions.

Dive into Technavio’s robust research methodology, blending expert interviews, extensive data synthesis, and validated models for unparalleled Couriers Market insights. See full methodology.

Market Scope
Page number 293
Base year 2025
Historic period 2020-2024
Forecast period 2026-2030
Growth momentum & CAGR Accelerate at a CAGR of 7.3%
Market growth 2026-2030 USD 134.2 billion
Market structure Fragmented
YoY growth 2025-2026(%) 7.0%
Key countries China, India, Japan, South Korea, Australia, Indonesia, US, Canada, Mexico, UK, Germany, France, Italy, Spain, The Netherlands, Saudi Arabia, South Africa, UAE, Egypt, Turkey, Brazil, Argentina and Colombia
Competitive landscape Leading Companies, Market Positioning of Companies, Competitive Strategies, and Industry Risks

Request Free Sample

Research Analyst Overview

  • The couriers market is undergoing a significant transformation driven by the convergence of digital technologies and evolving consumer expectations. Core to this shift is the deployment of a smart logistics infrastructure, featuring automated sorting systems and widespread package handling automation, which collectively improve throughput. The integration of iot-enabled fleet management and mobile workforce management provides unprecedented supply chain visibility.
  • For operators, last-mile delivery optimization through dynamic route adjustment and ai-powered route planning is critical for profitability. This is supported by predictive delivery analytics and route optimization software. The rise of on-demand delivery platforms and crowdsourced delivery models is reshaping urban logistics, while advancements in autonomous delivery vehicles and delivery drone technology signal future disruption.
  • The boardroom focus on sustainable logistics solutions is mandating investments in carbon-neutral delivery operations, with some firms seeing a 15% reduction in emissions through optimized networks. Specialized offerings like time-definite international express, cold chain courier services, and temperature-controlled shipping are expanding.
  • Strategic implementation of parcel locker networks, geofencing for delivery accuracy, and multi-carrier shipping software are key competitive differentiators, alongside robust systems for cross-border customs clearance and b2b logistics integration.

What are the Key Data Covered in this Couriers Market Research and Growth Report?

  • What is the expected growth of the Couriers Market between 2026 and 2030?

    • USD 134.2 billion, at a CAGR of 7.3%

  • What segmentation does the market report cover?

    • The report is segmented by Consumer (Business to business, Business to consumer, and Consumer to consumer), Type (International, and Domestic), Service (Standard delivery, Express delivery, Last-mile delivery, and Same-day delivery) and Geography (APAC, North America, Europe, Middle East and Africa, South America)

  • Which regions are analyzed in the report?

    • APAC, North America, Europe, Middle East and Africa and South America

  • What are the key growth drivers and market challenges?

    • Burgeoning e-commerce expansion, Escalating operational costs

  • Who are the major players in the Couriers Market?

    • Action Bag Co., Active Packaging Ltd., Amcor Plc, Aramex International LLC, Aristo Flexi Pack, Bag Products, DHL International GmbH, Dongguan Pasike Packaging Co. Ltd., Euphoria Packaging Pvt. Ltd., FedEx Corp., International Paper Co., Janak Packers, Mondi Plc, PAC Worldwide, Packman Packaging Pvt. Ltd., Poddar Mercantile Pvt. Ltd., Riverside Paper Co. Inc., Sealed Air Corp. and Vedang Polyflex LLP

Market Research Insights

  • The market's dynamics are shaped by an intensifying focus on operational efficiency and customer-centric services. The adoption of on-demand delivery platforms has led to a 20% improvement in customer satisfaction scores for some operators, while advanced B2B logistics integration reduces order processing times by up to 30%. Technologies enabling real-time shipment tracking are now a baseline expectation.
  • A key strategic shift involves the development of robust reverse logistics management systems, which can recover significant value from returned goods. Furthermore, the expansion into specialized services like cold chain courier services for pharmaceuticals and secure document transport for legal and financial sectors is creating new revenue streams.
  • Urban logistics micro-hubs are being established to facilitate faster last-mile delivery and support contactless delivery solutions, which have seen a rapid uptake.

We can help! Our analysts can customize this couriers market research report to meet your requirements.

Get in touch

1. Executive Summary

1.1 Market overview

Executive Summary - Chart on Market Overview
Executive Summary - Data Table on Market Overview
Executive Summary - Chart on Global Market Characteristics
Executive Summary - Chart on Market by Geography
Executive Summary - Chart on Market Segmentation by Consumer
Executive Summary - Chart on Market Segmentation by Type
Executive Summary - Chart on Market Segmentation by Service
Executive Summary - Chart on Incremental Growth
Executive Summary - Data Table on Incremental Growth
Executive Summary - Chart on Company Market Positioning

2. Technavio Analysis

2.1 Analysis of price sensitivity, lifecycle, customer purchase basket, adoption rates, and purchase criteria

2.2 Criticality of inputs and Factors of differentiation

Chart on Overview on criticality of inputs and factors of differentiation

2.3 Factors of disruption

Chart on Overview on factors of disruption

2.4 Impact of drivers and challenges

Chart on Impact of drivers and challenges in 2025 and 2030

3. Market Landscape

3.1 Market ecosystem

Chart on Parent Market
Data Table on - Parent Market

3.2 Market characteristics

Chart on Market characteristics analysis

3.3 Value chain analysis

Chart on Value chain analysis

4. Market Sizing

4.1 Market definition

Data Table on Offerings of companies included in the market definition

4.2 Market segment analysis

Market segments

4.3 Market size 2025

4.4 Market outlook: Forecast for 2025-2030

Chart on Global - Market size and forecast 2025-2030 ($ billion)
Data Table on Global - Market size and forecast 2025-2030 ($ billion)
Chart on Global Market: Year-over-year growth 2025-2030 (%)
Data Table on Global Market: Year-over-year growth 2025-2030 (%)

5. Historic Market Size

5.1 Global Couriers Market 2020 - 2024

Historic Market Size - Data Table on Global Couriers Market 2020 - 2024 ($ billion)

5.2 Consumer segment analysis 2020 - 2024

Historic Market Size - Consumer Segment 2020 - 2024 ($ billion)

5.3 Type segment analysis 2020 - 2024

Historic Market Size - Type Segment 2020 - 2024 ($ billion)

5.4 Service segment analysis 2020 - 2024

Historic Market Size - Service Segment 2020 - 2024 ($ billion)

5.5 Geography segment analysis 2020 - 2024

Historic Market Size - Geography Segment 2020 - 2024 ($ billion)

5.6 Country segment analysis 2020 - 2024

Historic Market Size - Country Segment 2020 - 2024 ($ billion)

6. Qualitative Analysis

6.1 Impact of AI on the global couriers market

7. Five Forces Analysis

7.1 Five forces summary

Five forces analysis - Comparison between 2025 and 2030

7.2 Bargaining power of buyers

Bargaining power of buyers - Impact of key factors 2025 and 2030

7.3 Bargaining power of suppliers

Bargaining power of suppliers - Impact of key factors in 2025 and 2030

7.4 Threat of new entrants

Threat of new entrants - Impact of key factors in 2025 and 2030

7.5 Threat of substitutes

Threat of substitutes - Impact of key factors in 2025 and 2030

7.6 Threat of rivalry

Threat of rivalry - Impact of key factors in 2025 and 2030

7.7 Market condition

Chart on Market condition - Five forces 2025 and 2030

8. Market Segmentation by Consumer

8.1 Market segments

Chart on Consumer - Market share 2025-2030 (%)
Data Table on Consumer - Market share 2025-2030 (%)

8.2 Comparison by Consumer

Chart on Comparison by Consumer
Data Table on Comparison by Consumer

8.3 Business to business - Market size and forecast 2025-2030

Chart on Business to business - Market size and forecast 2025-2030 ($ billion)
Data Table on Business to business - Market size and forecast 2025-2030 ($ billion)
Chart on Business to business - Year-over-year growth 2025-2030 (%)
Data Table on Business to business - Year-over-year growth 2025-2030 (%)

8.4 Business to consumer - Market size and forecast 2025-2030

Chart on Business to consumer - Market size and forecast 2025-2030 ($ billion)
Data Table on Business to consumer - Market size and forecast 2025-2030 ($ billion)
Chart on Business to consumer - Year-over-year growth 2025-2030 (%)
Data Table on Business to consumer - Year-over-year growth 2025-2030 (%)

8.5 Consumer to consumer - Market size and forecast 2025-2030

Chart on Consumer to consumer - Market size and forecast 2025-2030 ($ billion)
Data Table on Consumer to consumer - Market size and forecast 2025-2030 ($ billion)
Chart on Consumer to consumer - Year-over-year growth 2025-2030 (%)
Data Table on Consumer to consumer - Year-over-year growth 2025-2030 (%)

8.6 Market opportunity by Consumer

Market opportunity by Consumer ($ billion)
Data Table on Market opportunity by Consumer ($ billion)

9. Market Segmentation by Type

9.1 Market segments

Chart on Type - Market share 2025-2030 (%)
Data Table on Type - Market share 2025-2030 (%)

9.2 Comparison by Type

Chart on Comparison by Type
Data Table on Comparison by Type

9.3 International - Market size and forecast 2025-2030

Chart on International - Market size and forecast 2025-2030 ($ billion)
Data Table on International - Market size and forecast 2025-2030 ($ billion)
Chart on International - Year-over-year growth 2025-2030 (%)
Data Table on International - Year-over-year growth 2025-2030 (%)

9.4 Domestic - Market size and forecast 2025-2030

Chart on Domestic - Market size and forecast 2025-2030 ($ billion)
Data Table on Domestic - Market size and forecast 2025-2030 ($ billion)
Chart on Domestic - Year-over-year growth 2025-2030 (%)
Data Table on Domestic - Year-over-year growth 2025-2030 (%)

9.5 Market opportunity by Type

Market opportunity by Type ($ billion)
Data Table on Market opportunity by Type ($ billion)

10. Market Segmentation by Service

10.1 Market segments

Chart on Service - Market share 2025-2030 (%)
Data Table on Service - Market share 2025-2030 (%)

10.2 Comparison by Service

Chart on Comparison by Service
Data Table on Comparison by Service

10.3 Standard delivery - Market size and forecast 2025-2030

Chart on Standard delivery - Market size and forecast 2025-2030 ($ billion)
Data Table on Standard delivery - Market size and forecast 2025-2030 ($ billion)
Chart on Standard delivery - Year-over-year growth 2025-2030 (%)
Data Table on Standard delivery - Year-over-year growth 2025-2030 (%)

10.4 Express delivery - Market size and forecast 2025-2030

Chart on Express delivery - Market size and forecast 2025-2030 ($ billion)
Data Table on Express delivery - Market size and forecast 2025-2030 ($ billion)
Chart on Express delivery - Year-over-year growth 2025-2030 (%)
Data Table on Express delivery - Year-over-year growth 2025-2030 (%)

10.5 Last-mile delivery - Market size and forecast 2025-2030

Chart on Last-mile delivery - Market size and forecast 2025-2030 ($ billion)
Data Table on Last-mile delivery - Market size and forecast 2025-2030 ($ billion)
Chart on Last-mile delivery - Year-over-year growth 2025-2030 (%)
Data Table on Last-mile delivery - Year-over-year growth 2025-2030 (%)

10.6 Same-day delivery - Market size and forecast 2025-2030

Chart on Same-day delivery - Market size and forecast 2025-2030 ($ billion)
Data Table on Same-day delivery - Market size and forecast 2025-2030 ($ billion)
Chart on Same-day delivery - Year-over-year growth 2025-2030 (%)
Data Table on Same-day delivery - Year-over-year growth 2025-2030 (%)

10.7 Market opportunity by Service

Market opportunity by Service ($ billion)
Data Table on Market opportunity by Service ($ billion)

11. Customer Landscape

11.1 Customer landscape overview

Analysis of price sensitivity, lifecycle, customer purchase basket, adoption rates, and purchase criteria

12. Geographic Landscape

12.1 Geographic segmentation

Chart on Market share by geography 2025-2030 (%)
Data Table on Market share by geography 2025-2030 (%)

12.2 Geographic comparison

Chart on Geographic comparison
Data Table on Geographic comparison

12.3 APAC - Market size and forecast 2025-2030

Chart on APAC - Market size and forecast 2025-2030 ($ billion)
Data Table on APAC - Market size and forecast 2025-2030 ($ billion)
Chart on APAC - Year-over-year growth 2025-2030 (%)
Data Table on APAC - Year-over-year growth 2025-2030 (%)
Chart on Regional Comparison - APAC
Data Table on Regional Comparison - APAC

12.3.1 China - Market size and forecast 2025-2030

Chart on China - Market size and forecast 2025-2030 ($ billion)
Data Table on China - Market size and forecast 2025-2030 ($ billion)
Chart on China - Year-over-year growth 2025-2030 (%)
Data Table on China - Year-over-year growth 2025-2030 (%)

12.3.2 India - Market size and forecast 2025-2030

Chart on India - Market size and forecast 2025-2030 ($ billion)
Data Table on India - Market size and forecast 2025-2030 ($ billion)
Chart on India - Year-over-year growth 2025-2030 (%)
Data Table on India - Year-over-year growth 2025-2030 (%)

12.3.3 Japan - Market size and forecast 2025-2030

Chart on Japan - Market size and forecast 2025-2030 ($ billion)
Data Table on Japan - Market size and forecast 2025-2030 ($ billion)
Chart on Japan - Year-over-year growth 2025-2030 (%)
Data Table on Japan - Year-over-year growth 2025-2030 (%)

12.3.4 South Korea - Market size and forecast 2025-2030

Chart on South Korea - Market size and forecast 2025-2030 ($ billion)
Data Table on South Korea - Market size and forecast 2025-2030 ($ billion)
Chart on South Korea - Year-over-year growth 2025-2030 (%)
Data Table on South Korea - Year-over-year growth 2025-2030 (%)

12.3.5 Australia - Market size and forecast 2025-2030

Chart on Australia - Market size and forecast 2025-2030 ($ billion)
Data Table on Australia - Market size and forecast 2025-2030 ($ billion)
Chart on Australia - Year-over-year growth 2025-2030 (%)
Data Table on Australia - Year-over-year growth 2025-2030 (%)

12.3.6 Indonesia - Market size and forecast 2025-2030

Chart on Indonesia - Market size and forecast 2025-2030 ($ billion)
Data Table on Indonesia - Market size and forecast 2025-2030 ($ billion)
Chart on Indonesia - Year-over-year growth 2025-2030 (%)
Data Table on Indonesia - Year-over-year growth 2025-2030 (%)

12.4 North America - Market size and forecast 2025-2030

Chart on North America - Market size and forecast 2025-2030 ($ billion)
Data Table on North America - Market size and forecast 2025-2030 ($ billion)
Chart on North America - Year-over-year growth 2025-2030 (%)
Data Table on North America - Year-over-year growth 2025-2030 (%)
Chart on Regional Comparison - North America
Data Table on Regional Comparison - North America

12.4.1 US - Market size and forecast 2025-2030

Chart on US - Market size and forecast 2025-2030 ($ billion)
Data Table on US - Market size and forecast 2025-2030 ($ billion)
Chart on US - Year-over-year growth 2025-2030 (%)
Data Table on US - Year-over-year growth 2025-2030 (%)

12.4.2 Canada - Market size and forecast 2025-2030

Chart on Canada - Market size and forecast 2025-2030 ($ billion)
Data Table on Canada - Market size and forecast 2025-2030 ($ billion)
Chart on Canada - Year-over-year growth 2025-2030 (%)
Data Table on Canada - Year-over-year growth 2025-2030 (%)

12.4.3 Mexico - Market size and forecast 2025-2030

Chart on Mexico - Market size and forecast 2025-2030 ($ billion)
Data Table on Mexico - Market size and forecast 2025-2030 ($ billion)
Chart on Mexico - Year-over-year growth 2025-2030 (%)
Data Table on Mexico - Year-over-year growth 2025-2030 (%)

12.5 Europe - Market size and forecast 2025-2030

Chart on Europe - Market size and forecast 2025-2030 ($ billion)
Data Table on Europe - Market size and forecast 2025-2030 ($ billion)
Chart on Europe - Year-over-year growth 2025-2030 (%)
Data Table on Europe - Year-over-year growth 2025-2030 (%)
Chart on Regional Comparison - Europe
Data Table on Regional Comparison - Europe

12.5.1 UK - Market size and forecast 2025-2030

Chart on UK - Market size and forecast 2025-2030 ($ billion)
Data Table on UK - Market size and forecast 2025-2030 ($ billion)
Chart on UK - Year-over-year growth 2025-2030 (%)
Data Table on UK - Year-over-year growth 2025-2030 (%)

12.5.2 Germany - Market size and forecast 2025-2030

Chart on Germany - Market size and forecast 2025-2030 ($ billion)
Data Table on Germany - Market size and forecast 2025-2030 ($ billion)
Chart on Germany - Year-over-year growth 2025-2030 (%)
Data Table on Germany - Year-over-year growth 2025-2030 (%)

12.5.3 France - Market size and forecast 2025-2030

Chart on France - Market size and forecast 2025-2030 ($ billion)
Data Table on France - Market size and forecast 2025-2030 ($ billion)
Chart on France - Year-over-year growth 2025-2030 (%)
Data Table on France - Year-over-year growth 2025-2030 (%)

12.5.4 Italy - Market size and forecast 2025-2030

Chart on Italy - Market size and forecast 2025-2030 ($ billion)
Data Table on Italy - Market size and forecast 2025-2030 ($ billion)
Chart on Italy - Year-over-year growth 2025-2030 (%)
Data Table on Italy - Year-over-year growth 2025-2030 (%)

12.5.5 Spain - Market size and forecast 2025-2030

Chart on Spain - Market size and forecast 2025-2030 ($ billion)
Data Table on Spain - Market size and forecast 2025-2030 ($ billion)
Chart on Spain - Year-over-year growth 2025-2030 (%)
Data Table on Spain - Year-over-year growth 2025-2030 (%)

12.5.6 The Netherlands - Market size and forecast 2025-2030

Chart on The Netherlands - Market size and forecast 2025-2030 ($ billion)
Data Table on The Netherlands - Market size and forecast 2025-2030 ($ billion)
Chart on The Netherlands - Year-over-year growth 2025-2030 (%)
Data Table on The Netherlands - Year-over-year growth 2025-2030 (%)

12.6 Middle East and Africa - Market size and forecast 2025-2030

Chart on Middle East and Africa - Market size and forecast 2025-2030 ($ billion)
Data Table on Middle East and Africa - Market size and forecast 2025-2030 ($ billion)
Chart on Middle East and Africa - Year-over-year growth 2025-2030 (%)
Data Table on Middle East and Africa - Year-over-year growth 2025-2030 (%)
Chart on Regional Comparison - Middle East and Africa
Data Table on Regional Comparison - Middle East and Africa

12.6.1 Saudi Arabia - Market size and forecast 2025-2030

Chart on Saudi Arabia - Market size and forecast 2025-2030 ($ billion)
Data Table on Saudi Arabia - Market size and forecast 2025-2030 ($ billion)
Chart on Saudi Arabia - Year-over-year growth 2025-2030 (%)
Data Table on Saudi Arabia - Year-over-year growth 2025-2030 (%)

12.6.2 South Africa - Market size and forecast 2025-2030

Chart on South Africa - Market size and forecast 2025-2030 ($ billion)
Data Table on South Africa - Market size and forecast 2025-2030 ($ billion)
Chart on South Africa - Year-over-year growth 2025-2030 (%)
Data Table on South Africa - Year-over-year growth 2025-2030 (%)

12.6.3 UAE - Market size and forecast 2025-2030

Chart on UAE - Market size and forecast 2025-2030 ($ billion)
Data Table on UAE - Market size and forecast 2025-2030 ($ billion)
Chart on UAE - Year-over-year growth 2025-2030 (%)
Data Table on UAE - Year-over-year growth 2025-2030 (%)

12.6.4 Egypt - Market size and forecast 2025-2030

Chart on Egypt - Market size and forecast 2025-2030 ($ billion)
Data Table on Egypt - Market size and forecast 2025-2030 ($ billion)
Chart on Egypt - Year-over-year growth 2025-2030 (%)
Data Table on Egypt - Year-over-year growth 2025-2030 (%)

12.6.5 Turkey - Market size and forecast 2025-2030

Chart on Turkey - Market size and forecast 2025-2030 ($ billion)
Data Table on Turkey - Market size and forecast 2025-2030 ($ billion)
Chart on Turkey - Year-over-year growth 2025-2030 (%)
Data Table on Turkey - Year-over-year growth 2025-2030 (%)

12.7 South America - Market size and forecast 2025-2030

Chart on South America - Market size and forecast 2025-2030 ($ billion)
Data Table on South America - Market size and forecast 2025-2030 ($ billion)
Chart on South America - Year-over-year growth 2025-2030 (%)
Data Table on South America - Year-over-year growth 2025-2030 (%)
Chart on Regional Comparison - South America
Data Table on Regional Comparison - South America

12.7.1 Brazil - Market size and forecast 2025-2030

Chart on Brazil - Market size and forecast 2025-2030 ($ billion)
Data Table on Brazil - Market size and forecast 2025-2030 ($ billion)
Chart on Brazil - Year-over-year growth 2025-2030 (%)
Data Table on Brazil - Year-over-year growth 2025-2030 (%)

12.7.2 Argentina - Market size and forecast 2025-2030

Chart on Argentina - Market size and forecast 2025-2030 ($ billion)
Data Table on Argentina - Market size and forecast 2025-2030 ($ billion)
Chart on Argentina - Year-over-year growth 2025-2030 (%)
Data Table on Argentina - Year-over-year growth 2025-2030 (%)

12.7.3 Colombia - Market size and forecast 2025-2030

Chart on Colombia - Market size and forecast 2025-2030 ($ billion)
Data Table on Colombia - Market size and forecast 2025-2030 ($ billion)
Chart on Colombia - Year-over-year growth 2025-2030 (%)
Data Table on Colombia - Year-over-year growth 2025-2030 (%)

12.8 Market opportunity by geography

Market opportunity by geography ($ billion)
Data Tables on Market opportunity by geography ($ billion)

13. Drivers, Challenges, and Opportunity

13.1 Market drivers

Burgeoning e-commerce expansion
Globalization of supply chains
Technological advancements and digitalization

13.2 Market challenges

Escalating operational costs
Infrastructure and urban congestion
Regulatory complexities and trade barriers

13.3 Impact of drivers and challenges

Impact of drivers and challenges in 2025 and 2030

13.4 Market opportunities

Increasing adoption of sustainable logistics solutions
Heightened demand for hyper-personalization and flexibility
Increased adoption of automation and robotics in logistics

14. Competitive Landscape

14.1 Overview

14.2

Overview on criticality of inputs and factors of differentiation

14.3 Landscape disruption

Overview on factors of disruption

14.4 Industry risks

Impact of key risks on business

15. Competitive Analysis

15.1 Companies profiled

Companies covered

15.2 Company ranking index

15.3 Market positioning of companies

Matrix on companies position and classification

15.4 Action Bag Co.

Action Bag Co. - Overview
Action Bag Co. - Product / Service
Action Bag Co. - Key offerings
SWOT

15.5 Active Packaging Ltd.

Active Packaging Ltd. - Overview
Active Packaging Ltd. - Product / Service
Active Packaging Ltd. - Key offerings
SWOT

15.6 Amcor Plc

Amcor Plc - Overview
Amcor Plc - Business segments
Amcor Plc - Key news
Amcor Plc - Key offerings
Amcor Plc - Segment focus
SWOT

15.7 Aramex International LLC

Aramex International LLC - Overview
Aramex International LLC - Product / Service
Aramex International LLC - Key news
Aramex International LLC - Key offerings
SWOT

15.8 Aristo Flexi Pack

Aristo Flexi Pack - Overview
Aristo Flexi Pack - Product / Service
Aristo Flexi Pack - Key offerings
SWOT

15.9 Bag Products

Bag Products - Overview
Bag Products - Product / Service
Bag Products - Key offerings
SWOT

15.10 DHL International GmbH

DHL International GmbH - Overview
DHL International GmbH - Business segments
DHL International GmbH - Key news
DHL International GmbH - Key offerings
DHL International GmbH - Segment focus
SWOT

15.11 Euphoria Packaging Pvt. Ltd.

Euphoria Packaging Pvt. Ltd. - Overview
Euphoria Packaging Pvt. Ltd. - Product / Service
Euphoria Packaging Pvt. Ltd. - Key offerings
SWOT

15.12 FedEx Corp.

FedEx Corp. - Overview
FedEx Corp. - Business segments
FedEx Corp. - Key news
FedEx Corp. - Key offerings
FedEx Corp. - Segment focus
SWOT

15.13 International Paper Co.

International Paper Co. - Overview
International Paper Co. - Business segments
International Paper Co. - Key news
International Paper Co. - Key offerings
International Paper Co. - Segment focus
SWOT

15.14 Mondi Plc

Mondi Plc - Overview
Mondi Plc - Business segments
Mondi Plc - Key news
Mondi Plc - Key offerings
Mondi Plc - Segment focus
SWOT

15.15 PAC Worldwide

PAC Worldwide - Overview
PAC Worldwide - Product / Service
PAC Worldwide - Key offerings
SWOT

15.16 Packman Packaging Pvt. Ltd.

Packman Packaging Pvt. Ltd. - Overview
Packman Packaging Pvt. Ltd. - Product / Service
Packman Packaging Pvt. Ltd. - Key offerings
SWOT

15.17 Poddar Mercantile Pvt. Ltd.

Poddar Mercantile Pvt. Ltd. - Overview
Poddar Mercantile Pvt. Ltd. - Product / Service
Poddar Mercantile Pvt. Ltd. - Key offerings
SWOT

15.18 Sealed Air Corp.

Sealed Air Corp. - Overview
Sealed Air Corp. - Business segments
Sealed Air Corp. - Key news
Sealed Air Corp. - Key offerings
Sealed Air Corp. - Segment focus
SWOT

16. Appendix

16.1 Scope of the report

Market definition
Objectives
Notes and caveats

16.2 Inclusions and exclusions checklist

Inclusions checklist
Exclusions checklist

16.3 Currency conversion rates for US$

16.4 Research methodology

16.5 Data procurement

Information sources

16.6 Data validation

16.7 Validation techniques employed for market sizing

16.8 Data synthesis

16.9 360 degree market analysis

16.10 List of abbreviations

Research Methodology

Technavio presents a detailed picture of the market by way of study, synthesis, and summation of data from multiple sources. The analysts have presented the various facets of the market with a particular focus on identifying the key industry influencers. The data thus presented is comprehensive, reliable, and the result of extensive research, both primary and secondary.

INFORMATION SOURCES

Primary sources

  • Manufacturers and suppliers
  • Channel partners
  • Industry experts
  • Strategic decision makers

Secondary sources

  • Industry journals and periodicals
  • Government data
  • Financial reports of key industry players
  • Historical data
  • Press releases

DATA ANALYSIS

Data Synthesis

  • Collation of data
  • Estimation of key figures
  • Analysis of derived insights

Data Validation

  • Triangulation with data models
  • Reference against proprietary databases
  • Corroboration with industry experts

REPORT WRITING

Qualitative

  • Market drivers
  • Market challenges
  • Market trends
  • Five forces analysis

Quantitative

  • Market size and forecast
  • Market segmentation
  • Geographical insights
  • Competitive landscape

Interested in this report?

Get your sample now to see our research methodology and insights!

Download Now

Frequently Asked Questions

Couriers market growth will increase by USD 134.2 billion during 2026-2030.

The Couriers market is expected to grow at a CAGR of 7.3% during 2026-2030.

Couriers market is segmented by Consumer (Business to business, Business to consumer, Consumer to consumer) Type (International, Domestic) Service (Standard delivery, Express delivery, Last-mile delivery, Same-day delivery)

Action Bag Co., Active Packaging Ltd., Amcor Plc, Aramex International LLC, Aristo Flexi Pack, Bag Products, DHL International GmbH, Dongguan Pasike Packaging Co. Ltd., Euphoria Packaging Pvt. Ltd., FedEx Corp., International Paper Co., Janak Packers, Mondi Plc, PAC Worldwide, Packman Packaging Pvt. Ltd., Poddar Mercantile Pvt. Ltd., Riverside Paper Co. Inc., Sealed Air Corp., Vedang Polyflex LLP are a few of the key vendors in the Couriers market.

APAC will register the highest growth rate of 46.8% among the other regions. Therefore, the Couriers market in APAC is expected to garner significant business opportunities for the vendors during the forecast period.

China, India, Japan, South Korea, Australia, Indonesia, US, Canada, Mexico, UK, Germany, France, Italy, Spain, The Netherlands, Saudi Arabia, South Africa, UAE, Egypt, Turkey, Brazil, Argentina, Colombia

  • Burgeoning e-commerce expansion is the driving factor this market.

The Couriers market vendors should focus on grabbing business opportunities from the Consumer segment as it accounted for the largest market share in the base year.