Credit Intermediation Market Analysis North America, APAC, Europe, Middle East and Africa, South America - US, China, Japan, India, Germany - Size and Forecast 2024-2028

Credit Intermediation Market Analysis North America, APAC, Europe, Middle East and Africa, South America - US, China, Japan, India, Germany - Size and Forecast 2024-2028

Published: Dec 2023 152 Pages SKU: IRTNTR77147

Market Overview at a Glance

$649.87 B
Market Opportunity
2.36%
CAGR
2.22
YoY growth 2023-2024(%)

Credit Intermediation Market Size 2024-2028 

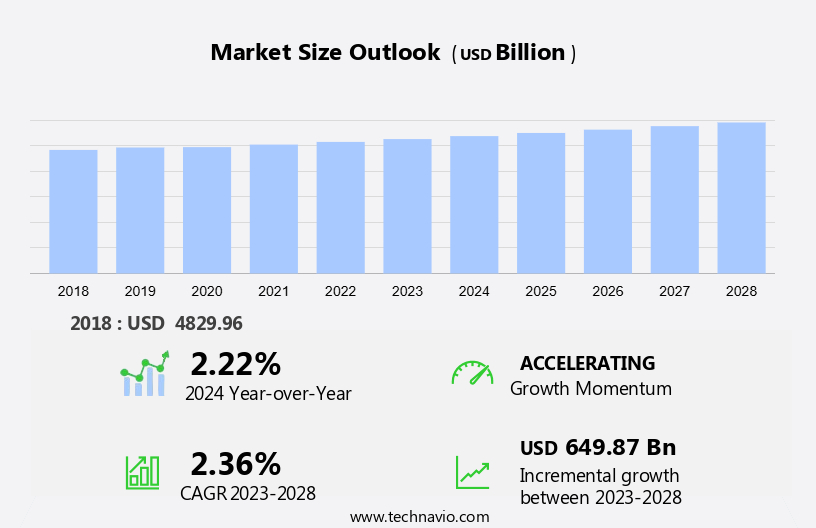
The credit intermediation market size is forecast to increase by USD 649.87 billion at a CAGR of 2.36% between 2023 and 2028. The market is experiencing significant developments and challenges, driven by various factors. One key trend is the increasing preference for discounted monthly installment plans, which allow consumers to access credit more affordable. However, this trend is not without risks, particularly during economic recessions when global economies face instability and credit availability becomes scarce. Banks, as primary credit intermediaries, are facing growing vulnerabilities and deficiencies, necessitating the development of an active secondary credit market to ensure smooth intermediation. This market growth is essential for maintaining financial stability and facilitating economic growth. Effective financialization and a strong secondary credit market can help mitigate risks and ensure credit availability to consumers and businesses, even during challenging economic conditions.

What will be the Size of the Market During the Forecast Period?

Credit Intermediation Market Size

 Request Free Sample

Credit intermediation is a vital process in the financial market that facilitates the connection between borrowers and lenders. This process involves credit intermediaries, such as commercial banks and credit unions, acting as middlemen in the lending process. These institutions offer various credit products to individuals and entities, enabling them to access funds for personal or business purposes. The market plays a crucial role in the economy by making credit available to consumers and businesses. Credit agreements are legally binding contracts between the borrower and the lender, outlining the terms and conditions of the loan, including monthly installments, discounts, and refunds.

Moreover, the infrastructure required to support credit intermediation includes a strong workforce, advanced technology, and adherence to stringent money security regulations. Operating costs for credit intermediaries can be substantial due to the need for maintaining infrastructure, safeguarding investors, and managing market risk. One of the primary responsibilities of credit intermediaries is to assess the financial status of potential borrowers and ensure the mishandling of credit agreements is minimized. This process involves evaluating the borrower's ability to repay the loan and assessing the risk associated with the loan. Fraud prevention is also a significant concern, with credit intermediaries implementing measures to protect against fraudulent activities by both borrowers and enterprises.

Furthermore, the financial services industry is undergoing significant financial services innovation driven by the rise of digital banking and the growing adoption of financial technology (fintech). Digital financial services are transforming the landscape, with mobile banking, mobile payments, and digital lending playing a key role in promoting financial inclusion. As financial inclusion programs expand, innovative solutions like microfinance, peer-to-peer lending, and data-driven lending are empowering underserved communities. Financial inclusion strategies are further enhanced by financial literacy initiatives and financial education efforts, while sustainable finance and responsible lending practices ensure long-term stability. With an increasing focus on financial crime prevention, cybersecurity in finance, and compliance and risk, financial services regulation continues to adapt to new challenges. Financial technology trends and financial services transformation will drive future growth, ensuring greater financial well-being and financial security for consumers worldwide.

Market Segmentation

The market research report provides comprehensive data (region-wise segment analysis), with forecasts and estimates in "USD billion" for the period 2024-2028, as well as historical data from 2018-2022 for the following segments.

  • Application
    • Individual
    • Enterprise
  • Type
    • Tied credit intermediation
    • Ancillary credit intermediation
    • Non-tied credit intermediation
  • Geography
    • North America
      • US
    • APAC
      • China
      • India
      • Japan
    • Europe
      • Germany
    • Middle East and Africa
    • South America

By Application Insights

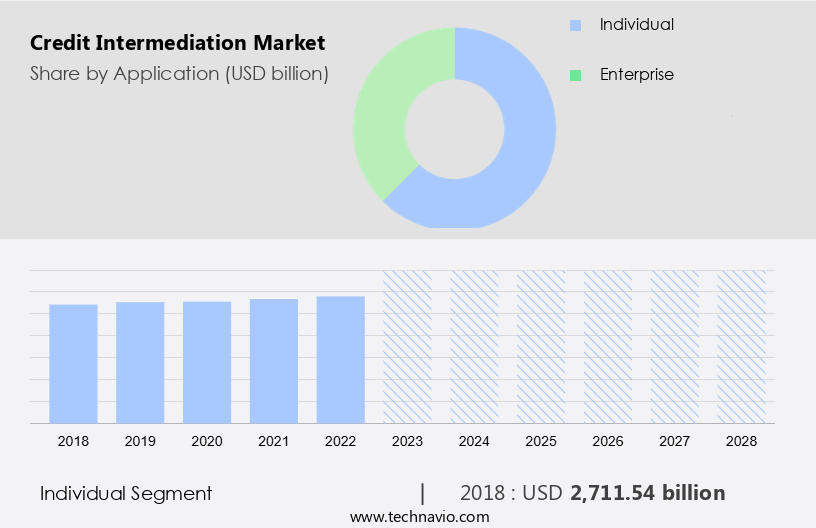
The individual segment is estimated to witness significant growth during the forecast period. The individual sector holds a significant market share in the market and is anticipated to lead the market growth during the forecast period. This segment's expansion can be attributed to the rising preference for personalized credit agreements and the growing role of intermediaries as credit advisors. The demand for credit counseling services has grown due to economic challenges, including increasing interest rates and inflation, which make it difficult for individuals to manage their debts. According to the US Bureau of Labor Statistics, employment in the credit counseling sector is projected to grow by 9% between 2021 and 2031. Middlemen play a crucial role in the lending process by connecting individuals with potential lenders and facilitating credit agreements. These entities provide valuable services, including credit education, debt management, and financial planning, making them indispensable in today's complex financial landscape.

Credit Intermediation Market Size

Get a glance at the market share of various segments Request Free Sample

The individual segment was valued at USD 2,711.54 billion in 2018 and showed a gradual increase during the forecast period.

Regional Insights

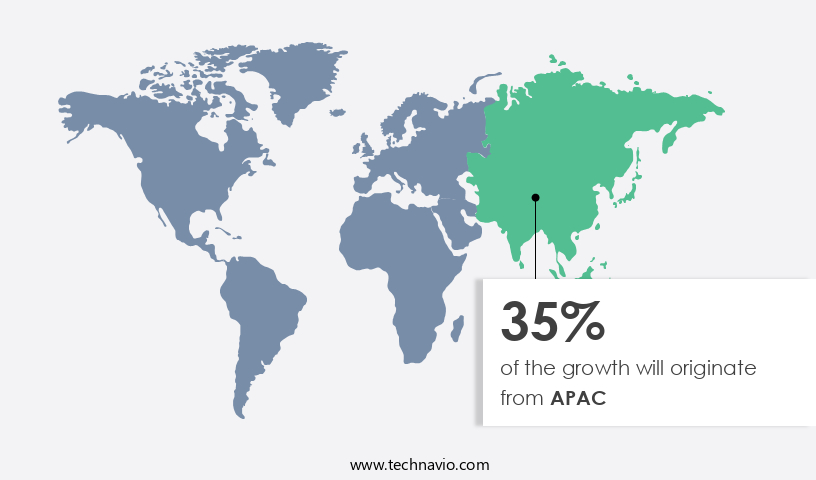
APAC is estimated to contribute 35% to the growth of the global market during the forecast period. Technavio's analysts have elaborately explained the regional trends and drivers that shape the market during the forecast period.

Credit Intermediation Market Share by Geography

For more insights on the market share of various regions Request Free Sample

The North American market is experiencing significant growth due to the increasing number of small and medium enterprises (SMEs) in the region. With over 30 million SMEs in the US alone, as reported by the US Chamber of Commerce, there is a growing demand for credit intermediation services. These businesses often require credit lending to finance their operations and expand, making the market a vital component of the financial landscape. Credit intermediation plays a crucial role in safeguarding investors by connecting borrowers with potential lenders. The market's growth is driven by the presence of numerous established companies in North America.

Moreover, the financial status of businesses and individuals seeking credit is a primary concern for these companies, ensuring that only credible borrowers gain access to funds. Fraudulent enterprises pose a significant risk to the security of investors' money. Stringent money security regulations are in place to mitigate this risk, providing an added layer of protection for both borrowers and lenders. The market in North America is committed to adhering to these regulations, ensuring a secure and reliable environment for all market participants. In conclusion, the North American market is thriving due to the increasing number of SMEs, the need for credit lending, and the presence of reputable companies. The market's role in connecting borrowers with lenders while maintaining strict regulatory compliance makes it an essential part of the financial sector.

Our researchers analyzed the data with 2023 as the base year, along with the key drivers, trends, and challenges. A holistic analysis of drivers will help companies refine their marketing strategies to gain a competitive advantage.

Market Driver

Growing focus on effective financialization is the key driver of the market. The market in the United States is experiencing significant expansion due to the increasing emphasis on efficient financialization. Financial institutions are expanding their reach and offering banking services through various channels, enabling them to provide last-mile connectivity.

Furthermore, the emergence of non-bank credit intermediaries and their commitment to broadening financial access and loosening credit restrictions have significantly contributed to market growth. Innovations such as door-step banking and banking correspondents have also fueled the demand for credit intermediation. Effective financialization remains a priority, and this focus is expected to propel the growth of the US market throughout the forecast period.

Market Trends

The development of an active secondary credit sector ensuring smooth credit intermediation is the upcoming trend in the market. In the financial sector, the importance of facilitating seamless credit flow and its intermediation is increasingly recognized. For instance, the Reserve Bank of India established a Secondary Loan Market Association in 2020 to bring together financial institutions and non-banking financial companies. The primary objective of this platform is to promote a vibrant secondary credit market, thereby ensuring efficient credit intermediation. Through a market-based auction mechanism, the platform enables fair pricing for credit transfers between members.

Moreover, this approach contrasts with traditional bilateral arrangements, providing greater transparency and fairness in credit and credit risk among participants. By fostering a deep and active secondary credit market, the platform plays a crucial role in enhancing the overall credit ecosystem's efficiency and effectiveness. The Secondary Loan Market Association, launched by the Reserve Bank of India in 2020, plays a pivotal role in addressing the challenges of ensuring smooth credit flow and its intermediation. This platform brings together financial institutions and non-banking financial companies, fostering a deep and active secondary credit market. By employing a market-based auction mechanism, the platform guarantees fair pricing for credit transfers, ensuring transparency and fairness in credit and credit risk among participants. Such factors wll increase the market trends and analysis during the forecast period.

Market Challenge

Growing vulnerabilities and deficiencies in banks related to credit intermediaries are key challenges affecting the market growth. The non-bank financial intermediary (NBFI) sector plays a significant role in credit intermediation services, creating intricate connections between banks and NBFIs through various channels. However, the expansion of NBFI exposures comes with inherent risks, as the sector's opaque nature and swift evolution of risks can pose challenges to banks' risk management practices. Recent events, such as the collapse of Archegos Capital Management and stresses in government bond markets, have underscored the need for improved risk management in the NBFI sector.

Furthermore, the types and sizes of NBFI exposures vary across jurisdictions, potentially leading to financial instability concerns. As the global economy navigates economic downturns, such as recessions, the importance of effective credit risk management becomes increasingly crucial for maintaining financial stability. In this context, banks must remain vigilant and adapt to the evolving risks in the NBFI sector to ensure the security of their investments and the broader financial system.

Exclusive Customer Landscape

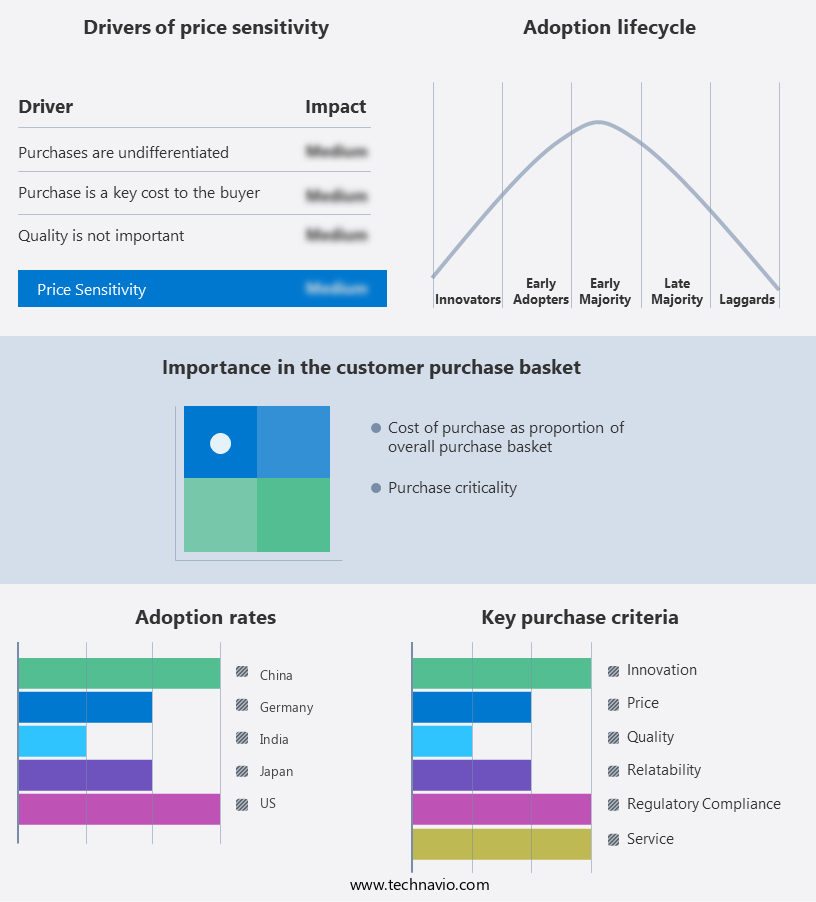
The market forecasting report includes the adoption lifecycle of the market, covering from the innovator's stage to the laggard's stage. It focuses on adoption rates in different regions based on penetration. Furthermore, the report also includes key purchase criteria and drivers of price sensitivity to help companies evaluate and develop their market growth analysis strategies.

Credit Intermediation Market Share by Geography

 Customer Landscape

Key Companies & Market Insights

Companies are implementing various strategies, such as strategic alliances, partnerships, mergers and acquisitions, geographical expansion, and product/service launches, to enhance their presence in the market.

Bank of America Corp. - The company offers credit intermediation services such as personal loans, and mortgage lending.

The market research and growth report includes detailed analyses of the competitive landscape of the market and information about key companies, including:

  • Barclays PLC
  • Citigroup Inc.
  • Credit Suisse Group AG
  • Deutsche Bank AG
  • HSBC Holdings Plc
  • JPMorgan Chase and Co.
  • Morgan Stanley
  • The Goldman Sachs Group Inc.
  • Wells Fargo and Co.

Qualitative and quantitative analysis of companies has been conducted to help clients understand the wider business environment as well as the strengths and weaknesses of key market players. Data is qualitatively analyzed to categorize companies as pure play, category-focused, industry-focused, and diversified; it is quantitatively analyzed to categorize companies as dominant, leading, strong, tentative, and weak.

Research Analyst Overview

Credit intermediation is a vital process in the financial market where legal individuals and enterprises act as middlemen between lenders and borrowers. This involves the lending process, where credit agreements are formed between the parties, and consumers or entities receive the required credit. Commercial banks and credit unions are significant institutions in the market, offering various types of credit, including personalized agreements and advisory services. Operating costs, market risk, fraud, and infrastructure are crucial factors that influence the market. Lenders need to safeguard investors from fraudulent enterprises and ensure the mishandling of agreements does not occur. Money security regulations are essential to maintain cash liquidity and prevent a cash crisis.

In summary, borrowers face monthly installments, discounts, and refunds, which impact their financial status during a recession or global economies' downturn. Lenders assess the financial status of the borrower before approving credit, considering their ability to repay and the risk involved. Credit availability is a significant factor, as consumers and businesses rely on credit to manage their cash flow during challenging economic conditions. The market faces challenges such as fraud, infrastructure, workforce management, and regulatory compliance. However, it plays a vital role in facilitating economic growth by connecting lenders and borrowers, enabling businesses and individuals to access credit when needed.

Moreover, the fintech revolution is reshaping the financial services landscape, with technological advancements like AI and big data driving improvements in credit decisions, credit assessment, and credit underwriting processes. Online lending platforms and bank intermediation are increasingly providing personalized credit options to meet the consumption needs of underserved populations, offering more accessible financing needs and reducing loan default rates. However, predatory lending practices, frauds, and non-performing loans present significant business challenges for lending institutions. The rise of buy now, pay later (BNPL) services and pay later models highlights changing consumer behavior but also raises concerns over the regulatory landscape and loan terms. The shift towards personal investments and savers has increased credit demand, while economic uncertainty and housing affordability continue to impact mortgages and loan defaults. In response, credit services and financing options are evolving to ensure complete positive compliance, minimize operational costs, and adapt to the agreement process and maintenance of loans.

Market Scope

Report Coverage

Details

Page number

152

Base year

2023

Historic period

2018-2022

Forecast period

2024-2028

Growth momentum & CAGR

Accelerate at a CAGR of 2.36%

Market growth 2024-2028

USD 649.87 billion

Market structure

Concentrated

YoY growth 2023-2024(%)

2.22

Regional analysis

North America, APAC, Europe, Middle East and Africa, and South America

Performing market contribution

APAC at 35%

Key countries

US, China, Japan, India, and Germany

Competitive landscape

Leading Companies, Market Positioning of Companies, Competitive Strategies, and Industry Risks

Key companies profiled

Bank of America Corp., Barclays PLC, Citigroup Inc., Credit Suisse Group AG, Deutsche Bank AG, HSBC Holdings Plc, JPMorgan Chase and Co., Morgan Stanley, The Goldman Sachs Group Inc., and Wells Fargo and Co.

Market dynamics

Parent market analysis and report , market growth inducers and obstacles, market forecast, fast-growing and slow-growing segment analysis, COVID-19 impact and recovery analysis and future consumer dynamics, market condition analysis for the forecast period

Customization purview

If our market report has not included the data that you are looking for, you can reach out to our analysts and get segments customized.

Request Free Sample

What are the Key Data Covered in this Market Research and Growth Report?

  • CAGR of the market during the forecast period
  • Detailed information on factors that will drive the market growth and forecasting between 2024 and 2028
  • Precise estimation of the size of the market  and its contribution of the market in focus to the parent market
  • Accurate predictions about upcoming market growth and trends and changes in consumer behaviour
  • Growth of the market across North America, APAC, Europe, Middle East and Africa, and South America
  • Thorough analysis of the market's competitive landscape and detailed information about companies
  • Comprehensive analysis of factors that will challenge the growth of market companies

We can help! Our analysts can customize this market research report to meet your requirements. Get in touch

1 Executive Summary

  • 1.1 Market overview
    • Exhibit 01: Executive Summary – Chart on Market Overview
    • Exhibit 02: Executive Summary – Data Table on Market Overview
    • Exhibit 03: Executive Summary – Chart on Global Market Characteristics
    • Exhibit 04: Executive Summary – Chart on Market by Geography
    • Exhibit 05: Executive Summary – Chart on Market Segmentation by Application
    • Exhibit 06: Executive Summary – Chart on Market Segmentation by Type
    • Exhibit 07: Executive Summary – Chart on Incremental Growth
    • Exhibit 08: Executive Summary – Data Table on Incremental Growth
    • Exhibit 09: Executive Summary – Chart on Vendor Market Positioning

2 Market Landscape

  • 2.1 Market ecosystem
    • Exhibit 10: Parent market
    • Exhibit 11: Market Characteristics

3 Market Sizing

  • 3.1 Market definition
    • Exhibit 12: Offerings of vendors included in the market definition
  • 3.2 Market segment analysis
    • Exhibit 13: Market segments
  • 3.3 Market size 2023
    • 3.4 Market outlook: Forecast for 2023-2028
      • Exhibit 14: Chart on Global - Market size and forecast 2023-2028 ($ billion)
      • Exhibit 15: Data Table on Global - Market size and forecast 2023-2028 ($ billion)
      • Exhibit 16: Chart on Global Market: Year-over-year growth 2023-2028 (%)
      • Exhibit 17: Data Table on Global Market: Year-over-year growth 2023-2028 (%)

    4 Historic Market Size

    • 4.1 Global credit intermediation market 2018 - 2022
      • Exhibit 18: Historic Market Size – Data Table on global credit intermediation market 2018 - 2022 ($ billion)
    • 4.2 Application Segment Analysis 2018 - 2022
      • Exhibit 19: Historic Market Size – Application Segment 2018 - 2022 ($ billion)
    • 4.3 Type Segment Analysis 2018 - 2022
      • Exhibit 20: Historic Market Size – Type Segment 2018 - 2022 ($ billion)
    • 4.4 Geography Segment Analysis 2018 - 2022
      • Exhibit 21: Historic Market Size – Geography Segment 2018 - 2022 ($ billion)
    • 4.5 Country Segment Analysis 2018 - 2022
      • Exhibit 22: Historic Market Size – Country Segment 2018 - 2022 ($ billion)

    5 Five Forces Analysis

    • 5.1 Five forces summary
      • Exhibit 23: Five forces analysis - Comparison between 2023 and 2028
    • 5.2 Bargaining power of buyers
      • Exhibit 24: Chart on Bargaining power of buyers – Impact of key factors 2023 and 2028
    • 5.3 Bargaining power of suppliers
      • Exhibit 25: Bargaining power of suppliers – Impact of key factors in 2023 and 2028
    • 5.4 Threat of new entrants
      • Exhibit 26: Threat of new entrants – Impact of key factors in 2023 and 2028
    • 5.5 Threat of substitutes
      • Exhibit 27: Threat of substitutes – Impact of key factors in 2023 and 2028
    • 5.6 Threat of rivalry
      • Exhibit 28: Threat of rivalry – Impact of key factors in 2023 and 2028
    • 5.7 Market condition
      • Exhibit 29: Chart on Market condition - Five forces 2023 and 2028

    6 Market Segmentation by Application

    • 6.1 Market segments
      • Exhibit 30: Chart on Application - Market share 2023-2028 (%)
      • Exhibit 31: Data Table on Application - Market share 2023-2028 (%)
    • 6.2 Comparison by Application
      • Exhibit 32: Chart on Comparison by Application
      • Exhibit 33: Data Table on Comparison by Application
    • 6.3 Individual - Market size and forecast 2023-2028
      • Exhibit 34: Chart on Individual - Market size and forecast 2023-2028 ($ billion)
      • Exhibit 35: Data Table on Individual - Market size and forecast 2023-2028 ($ billion)
      • Exhibit 36: Chart on Individual - Year-over-year growth 2023-2028 (%)
      • Exhibit 37: Data Table on Individual - Year-over-year growth 2023-2028 (%)
    • 6.4 Enterprise - Market size and forecast 2023-2028
      • Exhibit 38: Chart on Enterprise - Market size and forecast 2023-2028 ($ billion)
      • Exhibit 39: Data Table on Enterprise - Market size and forecast 2023-2028 ($ billion)
      • Exhibit 40: Chart on Enterprise - Year-over-year growth 2023-2028 (%)
      • Exhibit 41: Data Table on Enterprise - Year-over-year growth 2023-2028 (%)
    • 6.5 Market opportunity by Application
      • Exhibit 42: Market opportunity by Application ($ billion)
      • Exhibit 43: Data Table on Market opportunity by Application ($ billion)

    7 Market Segmentation by Type

    • 7.1 Market segments
      • Exhibit 44: Chart on Type - Market share 2023-2028 (%)
      • Exhibit 45: Data Table on Type - Market share 2023-2028 (%)
    • 7.2 Comparison by Type
      • Exhibit 46: Chart on Comparison by Type
      • Exhibit 47: Data Table on Comparison by Type
    • 7.3 Tied credit intermediation - Market size and forecast 2023-2028
      • Exhibit 48: Chart on Tied credit intermediation - Market size and forecast 2023-2028 ($ billion)
      • Exhibit 49: Data Table on Tied credit intermediation - Market size and forecast 2023-2028 ($ billion)
      • Exhibit 50: Chart on Tied credit intermediation - Year-over-year growth 2023-2028 (%)
      • Exhibit 51: Data Table on Tied credit intermediation - Year-over-year growth 2023-2028 (%)
    • 7.4 Ancillary credit intermediation - Market size and forecast 2023-2028
      • Exhibit 52: Chart on Ancillary credit intermediation - Market size and forecast 2023-2028 ($ billion)
      • Exhibit 53: Data Table on Ancillary credit intermediation - Market size and forecast 2023-2028 ($ billion)
      • Exhibit 54: Chart on Ancillary credit intermediation - Year-over-year growth 2023-2028 (%)
      • Exhibit 55: Data Table on Ancillary credit intermediation - Year-over-year growth 2023-2028 (%)
    • 7.5 Non-tied credit intermediation - Market size and forecast 2023-2028
      • Exhibit 56: Chart on Non-tied credit intermediation - Market size and forecast 2023-2028 ($ billion)
      • Exhibit 57: Data Table on Non-tied credit intermediation - Market size and forecast 2023-2028 ($ billion)
      • Exhibit 58: Chart on Non-tied credit intermediation - Year-over-year growth 2023-2028 (%)
      • Exhibit 59: Data Table on Non-tied credit intermediation - Year-over-year growth 2023-2028 (%)
    • 7.6 Market opportunity by Type
      • Exhibit 60: Market opportunity by Type ($ billion)
      • Exhibit 61: Data Table on Market opportunity by Type ($ billion)

    8 Customer Landscape

    • 8.1 Customer landscape overview
      • Exhibit 62: Analysis of price sensitivity, lifecycle, customer purchase basket, adoption rates, and purchase criteria

    9 Geographic Landscape

    • 9.1 Geographic segmentation
      • Exhibit 63: Chart on Market share by geography 2023-2028 (%)
      • Exhibit 64: Data Table on Market share by geography 2023-2028 (%)
    • 9.2 Geographic comparison
      • Exhibit 65: Chart on Geographic comparison
      • Exhibit 66: Data Table on Geographic comparison
    • 9.3 North America - Market size and forecast 2023-2028
      • Exhibit 67: Chart on North America - Market size and forecast 2023-2028 ($ billion)
      • Exhibit 68: Data Table on North America - Market size and forecast 2023-2028 ($ billion)
      • Exhibit 69: Chart on North America - Year-over-year growth 2023-2028 (%)
      • Exhibit 70: Data Table on North America - Year-over-year growth 2023-2028 (%)
    • 9.4 APAC - Market size and forecast 2023-2028
      • Exhibit 71: Chart on APAC - Market size and forecast 2023-2028 ($ billion)
      • Exhibit 72: Data Table on APAC - Market size and forecast 2023-2028 ($ billion)
      • Exhibit 73: Chart on APAC - Year-over-year growth 2023-2028 (%)
      • Exhibit 74: Data Table on APAC - Year-over-year growth 2023-2028 (%)
    • 9.5 Europe - Market size and forecast 2023-2028
      • Exhibit 75: Chart on Europe - Market size and forecast 2023-2028 ($ billion)
      • Exhibit 76: Data Table on Europe - Market size and forecast 2023-2028 ($ billion)
      • Exhibit 77: Chart on Europe - Year-over-year growth 2023-2028 (%)
      • Exhibit 78: Data Table on Europe - Year-over-year growth 2023-2028 (%)
    • 9.6 Middle East and Africa - Market size and forecast 2023-2028
      • Exhibit 79: Chart on Middle East and Africa - Market size and forecast 2023-2028 ($ billion)
      • Exhibit 80: Data Table on Middle East and Africa - Market size and forecast 2023-2028 ($ billion)
      • Exhibit 81: Chart on Middle East and Africa - Year-over-year growth 2023-2028 (%)
      • Exhibit 82: Data Table on Middle East and Africa - Year-over-year growth 2023-2028 (%)
    • 9.7 South America - Market size and forecast 2023-2028
      • Exhibit 83: Chart on South America - Market size and forecast 2023-2028 ($ billion)
      • Exhibit 84: Data Table on South America - Market size and forecast 2023-2028 ($ billion)
      • Exhibit 85: Chart on South America - Year-over-year growth 2023-2028 (%)
      • Exhibit 86: Data Table on South America - Year-over-year growth 2023-2028 (%)
    • 9.8 US - Market size and forecast 2023-2028
      • Exhibit 87: Chart on US - Market size and forecast 2023-2028 ($ billion)
      • Exhibit 88: Data Table on US - Market size and forecast 2023-2028 ($ billion)
      • Exhibit 89: Chart on US - Year-over-year growth 2023-2028 (%)
      • Exhibit 90: Data Table on US - Year-over-year growth 2023-2028 (%)
    • 9.9 China - Market size and forecast 2023-2028
      • Exhibit 91: Chart on China - Market size and forecast 2023-2028 ($ billion)
      • Exhibit 92: Data Table on China - Market size and forecast 2023-2028 ($ billion)
      • Exhibit 93: Chart on China - Year-over-year growth 2023-2028 (%)
      • Exhibit 94: Data Table on China - Year-over-year growth 2023-2028 (%)
    • 9.10 Japan - Market size and forecast 2023-2028
      • Exhibit 95: Chart on Japan - Market size and forecast 2023-2028 ($ billion)
      • Exhibit 96: Data Table on Japan - Market size and forecast 2023-2028 ($ billion)
      • Exhibit 97: Chart on Japan - Year-over-year growth 2023-2028 (%)
      • Exhibit 98: Data Table on Japan - Year-over-year growth 2023-2028 (%)
    • 9.11 Germany - Market size and forecast 2023-2028
      • Exhibit 99: Chart on Germany - Market size and forecast 2023-2028 ($ billion)
      • Exhibit 100: Data Table on Germany - Market size and forecast 2023-2028 ($ billion)
      • Exhibit 101: Chart on Germany - Year-over-year growth 2023-2028 (%)
      • Exhibit 102: Data Table on Germany - Year-over-year growth 2023-2028 (%)
    • 9.12 India - Market size and forecast 2023-2028
      • Exhibit 103: Chart on India - Market size and forecast 2023-2028 ($ billion)
      • Exhibit 104: Data Table on India - Market size and forecast 2023-2028 ($ billion)
      • Exhibit 105: Chart on India - Year-over-year growth 2023-2028 (%)
      • Exhibit 106: Data Table on India - Year-over-year growth 2023-2028 (%)
    • 9.13 Market opportunity by geography
      • Exhibit 107: Market opportunity by geography ($ billion)
      • Exhibit 108: Data Tables on Market opportunity by geography ($ billion)

    10 Drivers, Challenges, and Trends

    • 10.1 Market drivers
      • 10.2 Market challenges
        • 10.3 Impact of drivers and challenges
          • Exhibit 109: Impact of drivers and challenges in 2023 and 2028
        • 10.4 Market trends

          11 Vendor Landscape

          • 11.1 Overview
            • 11.2 Vendor landscape
              • Exhibit 110: Overview on Criticality of inputs and Factors of differentiation
            • 11.3 Landscape disruption
              • Exhibit 111: Overview on factors of disruption
            • 11.4 Industry risks
              • Exhibit 112: Impact of key risks on business

            12 Vendor Analysis

            • 12.1 Vendors covered
              • Exhibit 113: Vendors covered
            • 12.2 Market positioning of vendors
              • Exhibit 114: Matrix on vendor position and classification
            • 12.3 Bank of America Corp.
              • Exhibit 115: Bank of America Corp. - Overview
              • Exhibit 116: Bank of America Corp. - Business segments
              • Exhibit 117: Bank of America Corp. - Key news
              • Exhibit 118: Bank of America Corp. - Key offerings
              • Exhibit 119: Bank of America Corp. - Segment focus
            • 12.4 Barclays PLC
              • Exhibit 120: Barclays PLC - Overview
              • Exhibit 121: Barclays PLC - Business segments
              • Exhibit 122: Barclays PLC - Key news
              • Exhibit 123: Barclays PLC - Key offerings
              • Exhibit 124: Barclays PLC - Segment focus
            • 12.5 Citigroup Inc.
              • Exhibit 125: Citigroup Inc. - Overview
              • Exhibit 126: Citigroup Inc. - Business segments
              • Exhibit 127: Citigroup Inc. - Key offerings
              • Exhibit 128: Citigroup Inc. - Segment focus
            • 12.6 Credit Suisse Group AG
              • Exhibit 129: Credit Suisse Group AG - Overview
              • Exhibit 130: Credit Suisse Group AG - Business segments
              • Exhibit 131: Credit Suisse Group AG - Key offerings
              • Exhibit 132: Credit Suisse Group AG - Segment focus
            • 12.7 Deutsche Bank AG
              • Exhibit 133: Deutsche Bank AG - Overview
              • Exhibit 134: Deutsche Bank AG - Business segments
              • Exhibit 135: Deutsche Bank AG - Key news
              • Exhibit 136: Deutsche Bank AG - Key offerings
              • Exhibit 137: Deutsche Bank AG - Segment focus
            • 12.8 HSBC Holdings Plc
              • Exhibit 138: HSBC Holdings Plc - Overview
              • Exhibit 139: HSBC Holdings Plc - Business segments
              • Exhibit 140: HSBC Holdings Plc - Key news
              • Exhibit 141: HSBC Holdings Plc - Key offerings
              • Exhibit 142: HSBC Holdings Plc - Segment focus
            • 12.9 JPMorgan Chase and Co.
              • Exhibit 143: JPMorgan Chase and Co. - Overview
              • Exhibit 144: JPMorgan Chase and Co. - Business segments
              • Exhibit 145: JPMorgan Chase and Co. - Key offerings
              • Exhibit 146: JPMorgan Chase and Co. - Segment focus
            • 12.10 Morgan Stanley
              • Exhibit 147: Morgan Stanley - Overview
              • Exhibit 148: Morgan Stanley - Business segments
              • Exhibit 149: Morgan Stanley - Key offerings
              • Exhibit 150: Morgan Stanley - Segment focus
            • 12.11 The Goldman Sachs Group Inc.
              • Exhibit 151: The Goldman Sachs Group Inc. - Overview
              • Exhibit 152: The Goldman Sachs Group Inc. - Business segments
              • Exhibit 153: The Goldman Sachs Group Inc. - Key news
              • Exhibit 154: The Goldman Sachs Group Inc. - Key offerings
              • Exhibit 155: The Goldman Sachs Group Inc. - Segment focus
            • 12.12 Wells Fargo and Co.
              • Exhibit 156: Wells Fargo and Co. - Overview
              • Exhibit 157: Wells Fargo and Co. - Business segments
              • Exhibit 158: Wells Fargo and Co. - Key offerings
              • Exhibit 159: Wells Fargo and Co. - Segment focus

            13 Appendix

            • 13.1 Scope of the report
              • 13.2 Inclusions and exclusions checklist
                • Exhibit 160: Inclusions checklist
                • Exhibit 161: Exclusions checklist
              • 13.3 Currency conversion rates for US$
                • Exhibit 162: Currency conversion rates for US$
              • 13.4 Research methodology
                • Exhibit 163: Research methodology
                • Exhibit 164: Validation techniques employed for market sizing
                • Exhibit 165: Information sources
              • 13.5 List of abbreviations
                • Exhibit 166: List of abbreviations

              Research Methodology

              Technavio presents a detailed picture of the market by way of study, synthesis, and summation of data from multiple sources. The analysts have presented the various facets of the market with a particular focus on identifying the key industry influencers. The data thus presented is comprehensive, reliable, and the result of extensive research, both primary and secondary.

              INFORMATION SOURCES

              Primary sources

              • Manufacturers and suppliers
              • Channel partners
              • Industry experts
              • Strategic decision makers

              Secondary sources

              • Industry journals and periodicals
              • Government data
              • Financial reports of key industry players
              • Historical data
              • Press releases

              DATA ANALYSIS

              Data Synthesis

              • Collation of data
              • Estimation of key figures
              • Analysis of derived insights

              Data Validation

              • Triangulation with data models
              • Reference against proprietary databases
              • Corroboration with industry experts

              REPORT WRITING

              Qualitative

              • Market drivers
              • Market challenges
              • Market trends
              • Five forces analysis

              Quantitative

              • Market size and forecast
              • Market segmentation
              • Geographical insights
              • Competitive landscape

              Interested in this report?

              Get your sample now to see our research methodology and insights!

              Download Now

              Frequently Asked Questions

              Credit Intermediation market growth will increase by $ 649.87 bn during 2024-2028.

              The Credit Intermediation market is expected to grow at a CAGR of 2.36% during 2024-2028.

              Credit Intermediation market is segmented by Application( Individual, Enterprise) Type( Tied credit intermediation, Ancillary credit intermediation, Non-tied credit intermediation)

              Bank of America Corp., Barclays PLC, Citigroup Inc., Credit Suisse Group AG, Deutsche Bank AG, HSBC Holdings Plc, JPMorgan Chase and Co., Morgan Stanley, The Goldman Sachs Group Inc., Wells Fargo and Co. are a few of the key vendors in the Credit Intermediation market.

              APAC will register the highest growth rate of 35% among the other regions. Therefore, the Credit Intermediation market in APAC is expected to garner significant business opportunities for the vendors during the forecast period.

              US, China, Japan, India, Germany

              • Growing focus on effective financializationOne of the major factors driving the growth of the global credit intermediation market is the focus on effective financialization. Effective financialization is being facilitated by the growth of financial institutions capabilities to provide last-mile reach along with the availability of banking services over multiple channels. Moreover is the driving factor this market.
              • the growth of non-bank credit intermediation and their efforts to increase financial inclusion and liberalize credit have also driven the growth of the credit intermediation market. New developments such as door-step banking and banking correspondents have further increased the demand for credit intermediation. Thus is the driving factor this market.
              • a growing focus on effective finalization is likely to drive the growth of the global credit intermediation market during the forecast period. is the driving factor this market.

              The Credit Intermediation market vendors should focus on grabbing business opportunities from the Individual segment as it accounted for the largest market share in the base year.