Cross Laminated Timber Market Analysis, Size, and Forecast 2026-2030: Europe (Germany, UK, and France), North America (US, Canada, and Mexico), APAC (China, Japan, and India), South America (Brazil and Argentina), Middle East and Africa (Saudi Arabia, UAE, and South Africa), and Rest of World (ROW)

Cross Laminated Timber Market Analysis, Size, and Forecast 2026-2030:
Europe (Germany, UK, and France), North America (US, Canada, and Mexico), APAC (China, Japan, and India), South America (Brazil and Argentina), Middle East and Africa (Saudi Arabia, UAE, and South Africa), and Rest of World (ROW)

Published: May 2026 276 Pages SKU: IRTNTR76566

Market Overview at a Glance

$3.60 B
Market Opportunity
17%
CAGR 2025 - 2030
40.5%
Europe Growth
$1.68 B
Non-residential segment 2024

Cross Laminated Timber Market Size 2026-2030

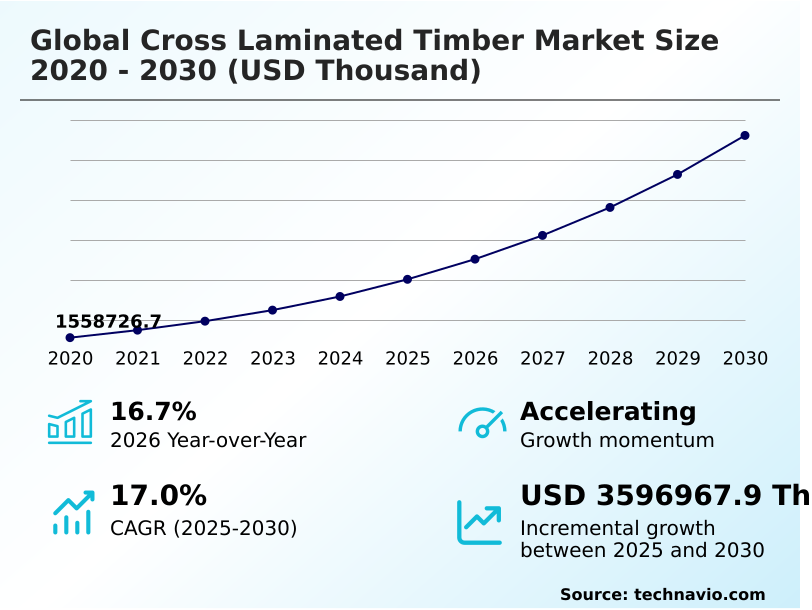
The cross laminated timber market size is valued to increase by USD 3.60 billion, at a CAGR of 17% from 2025 to 2030. Growth in real estate and construction industry will drive the cross laminated timber market.

Major Market Trends & Insights

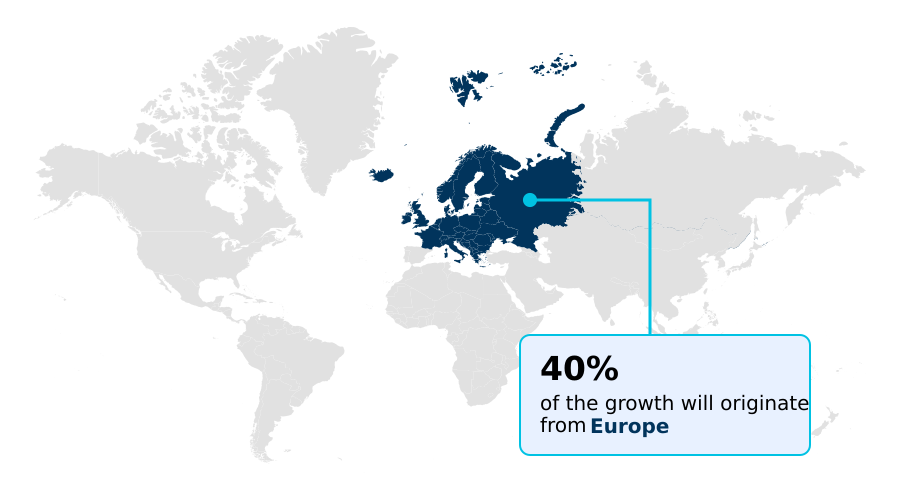
  • Europe dominated the market and accounted for a 40.5% growth during the forecast period.
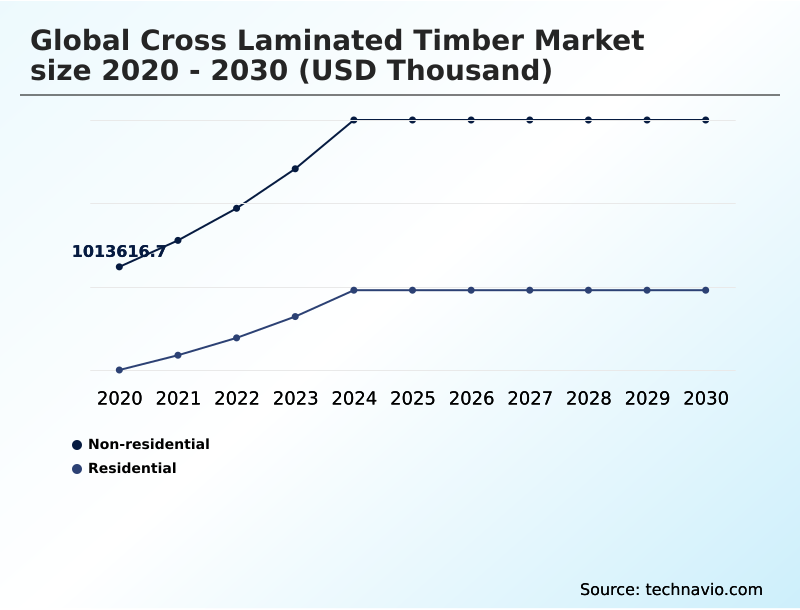
  • By End-user - Non-residential segment was valued at USD 1.68 billion in 2024
  • By Application - Structural segment accounted for the largest market revenue share in 2024

Market Size & Forecast

  • Market Opportunities:
  • Market Future Opportunities: USD 3.60 billion
  • CAGR from 2025 to 2030 : 17%

Market Summary

  • The cross laminated timber market is experiencing robust expansion as the global construction industry pivots toward sustainability and efficiency. A key driver is the demand for building materials with a lower carbon footprint, where timber's ability to sequester carbon offers a distinct advantage over steel and concrete.
  • This is complemented by the trend of off-site construction, where large, prefabricated timber panels are manufactured with high precision and assembled quickly on-site, enhancing project speed and safety.
  • For instance, a commercial real estate developer can use cross laminated timber to construct a mid-rise office building in a dense urban area with minimal disruption, reducing the construction timeline by months and accelerating tenant occupancy. This method significantly cuts down on-site waste and labor requirements.
  • However, the market faces challenges, including the volatility of lumber prices, which can create budgeting uncertainties. Furthermore, navigating the patchwork of regional building codes and fire safety regulations requires specialized expertise, adding complexity to project planning and execution. The industry's long-term growth hinges on standardizing practices and stabilizing supply chains.

What will be the Size of the Cross Laminated Timber Market during the forecast period?

Get Key Insights on Market Forecast (PDF) Get Free Sample

How is the Cross Laminated Timber Market Segmented?

The cross laminated timber industry research report provides comprehensive data (region-wise segment analysis), with forecasts and estimates in "USD thousand" for the period 2026-2030, as well as historical data from 2020-2024 for the following segments.

  • End-user
    • Non-residential
    • Residential
  • Application
    • Structural
    • Non-structural
  • Type
    • Adhesive bonded
    • Mechanically fastened
  • Geography
    • Europe
      • Germany
      • UK
      • France
    • North America
      • US
      • Canada
      • Mexico
    • APAC
      • China
      • Japan
      • India
    • South America
      • Brazil
      • Argentina
    • Middle East and Africa
      • Saudi Arabia
      • UAE
      • South Africa
    • Rest of World (ROW)

By End-user Insights

The non-residential segment is estimated to witness significant growth during the forecast period.

The non-residential sector is increasingly adopting engineered wood solutions, driven by demands for sustainable and efficient construction.

The use of mass timber construction in commercial offices, educational facilities, and public infrastructure is expanding due to its function as a primary structural material, often replacing carbon-intensive alternatives.

Techniques like crosswise lamination of solid wood panels with structural adhesives create robust elements for mass timber buildings. Advanced wood panel manufacturing and computerized numerical control machining enable building prefabrication methods with high precision.

This off-site approach, using prefabricated building components, can accelerate project timelines by up to 25% compared to conventional methods, a critical advantage for time-sensitive commercial projects utilizing both engineered wood product and glue-laminated timber (glulam) in their timber structural design.

Get Free Sample

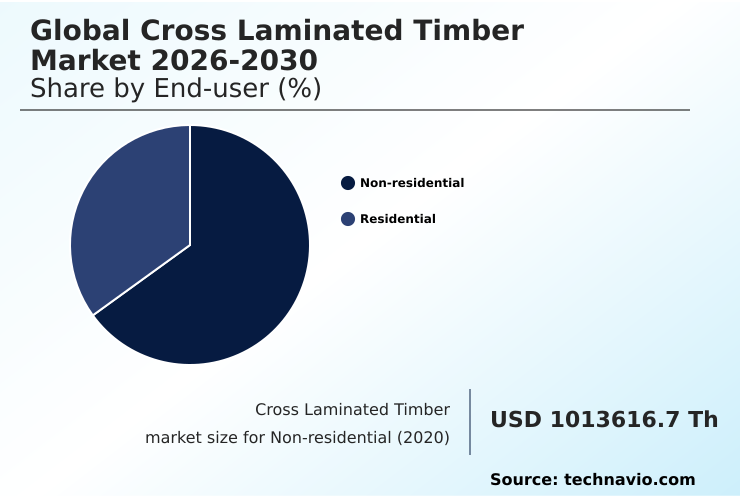
The Non-residential segment was valued at USD 1.68 billion in 2024 and showed a gradual increase during the forecast period.

Get Free Sample

Regional Analysis

Europe is estimated to contribute 40.5% to the growth of the global market during the forecast period.Technavio’s analysts have elaborately explained the regional trends and drivers that shape the market during the forecast period.

See How Cross Laminated Timber Market Demand is Rising in Europe Get Free Sample

The geographic landscape is characterized by established markets in Europe, which accounts for 40.5% of the incremental growth, and rapidly expanding markets in North America and APAC.

European leadership is built on advanced structural timber engineering and automated wood processing, fostering innovation in dowel laminated timber and other eco-friendly building materials.

In North America, the adoption of modular construction materials is driven by demand for sustainable urban development and faster building cycles. The use of off-site panel fabrication reduces on-site labor needs by up to 20%.

Structural panel systems, whether using adhesive bonded timber or mechanically fastened joints, are central to achieving carbon-neutral building design. The market's expansion relies on securing renewable construction resources through sustainable silviculture practices and optimizing logistics for these large-format components.

Market Dynamics

Our researchers analyzed the data with 2025 as the base year, along with the key drivers, trends, and challenges. A holistic analysis of drivers will help companies refine their marketing strategies to gain a competitive advantage.

  • Strategic decision-making within the cross laminated timber sector is increasingly data-driven, focusing on technical performance and lifecycle value. A critical area of evaluation is the fire resistance of exposed timber surfaces, where engineering advancements ensure compliance with stringent building codes for mass timber.
  • Similarly, understanding the structural integrity of CLT connections is paramount for designers, especially when creating hybrid steel-timber structural systems or planning for CLT building connection design details. For high-rise projects, design considerations for tall wood buildings and the seismic performance of timber frame structures are non-negotiable.
  • The acoustic performance of mass timber buildings is another key differentiator, offering superior occupant comfort compared to conventional structures. From an environmental and economic standpoint, the embodied carbon of engineered wood is a major advantage, supported by a comprehensive lifecycle assessment of timber buildings.
  • The efficiency of CNC fabrication for timber components and streamlined CLT panel prefabrication and assembly can reduce project schedules by over 20% compared to traditional methods. Sourcing is managed through sustainable forest management for timber, while product development focuses on adhesive technologies for structural wood and addressing concerns like moisture protection in wood construction.
  • The thermal properties of CLT envelopes and dimensional stability of laminated panels contribute to energy-efficient building performance, making timber a competitive choice for CLT for long-span floor applications and other demanding structural applications in non-residential buildings. Biophilic design with structural wood further enhances asset value, aligning with modern architectural priorities.
  • This detailed analysis is vital for navigating the evolving building code for mass timber and leveraging the resource efficiency in timber manufacturing.

What are the key market drivers leading to the rise in the adoption of Cross Laminated Timber Industry?

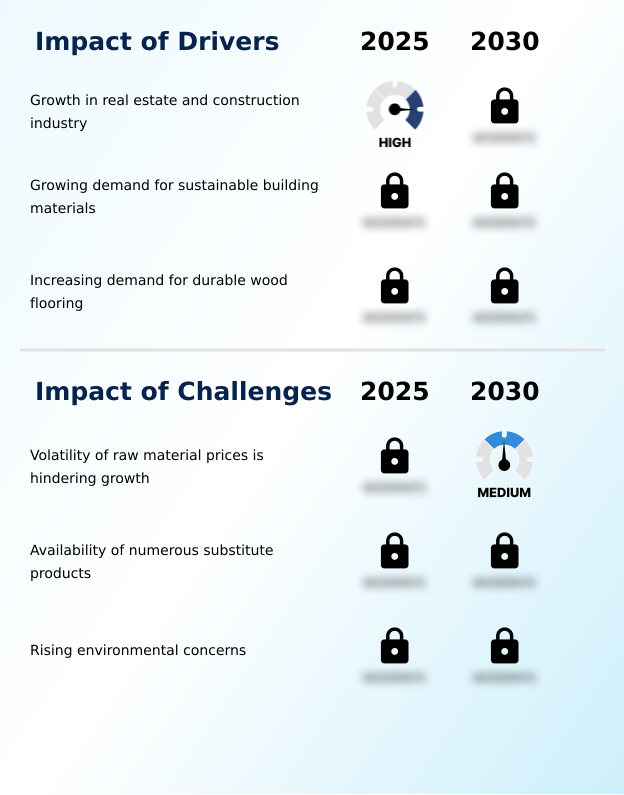
  • Growth in the global real estate and construction industry is a primary driver for the cross laminated timber market.

  • A major driver is the pursuit of resource-efficient construction, where engineered wood excels as a sustainable building material. Its performance characteristics, including high dimensional panel stability and superior building thermal performance, contribute to high-performance building envelopes.
  • Documented timber seismic performance and enhanced timber fire resistance are expanding its use in demanding applications. For instance, advanced timber manufacturing and off-site construction technology create lightweight structural materials ideal for urban densification solutions.
  • The ability to achieve reduced embodied carbon is a critical advantage, with a whole life carbon assessment often showing a 75% lower carbon footprint than steel alternatives.
  • Excellent wood acoustic insulation and the capacity for building carbon sequestration further cement its role as a preferred material.

What are the market trends shaping the Cross Laminated Timber Industry?

  • A focus on sustainable forestry management is a prominent trend expediting market growth. This approach ensures the integrity and long-term viability of the wood supply for the industry.

  • A key trend is the application of innovative building materials to increasingly ambitious projects. The use of modern construction techniques and prefabricated structural building components is enabling the development of multi-story wood buildings for both residential wood construction and non-residential timber projects. The material's high strength-to-weight ratio allows for efficient building envelope solutions in high-rise timber architecture.
  • Structures now commonly feature mass timber for structural load-bearing walls, engineered floor systems, and timber roof structures. This adoption supports the construction of energy-efficient buildings, with studies showing timber structures can achieve airtightness levels 50% better than required by code, significantly reducing heating and cooling loads. The evolution of timber frame construction continues to push architectural boundaries.

What challenges does the Cross Laminated Timber Industry face during its growth?

  • The volatility of raw material prices presents a significant challenge, hindering the market's growth by creating uncertainty in project financing.

  • While the market is growing, challenges remain in standardizing green construction practices and ensuring a consistent supply of certified forestry products through sustainable timber sourcing. Adherence to evolving green building standards and modern building codes, including complex frameworks like eurocode 5 timber design, requires significant expertise and can increase project costs by up to 10%.
  • Integrating architectural wood products into low-carbon building solutions necessitates ongoing structural engineering innovation. Achieving optimal construction site efficiency with advanced building materials also depends on a skilled labor force, which is not universally available. Balancing the principles of biophilic architectural design and the circular construction economy with project budgets presents a continuous challenge for developers and architects.

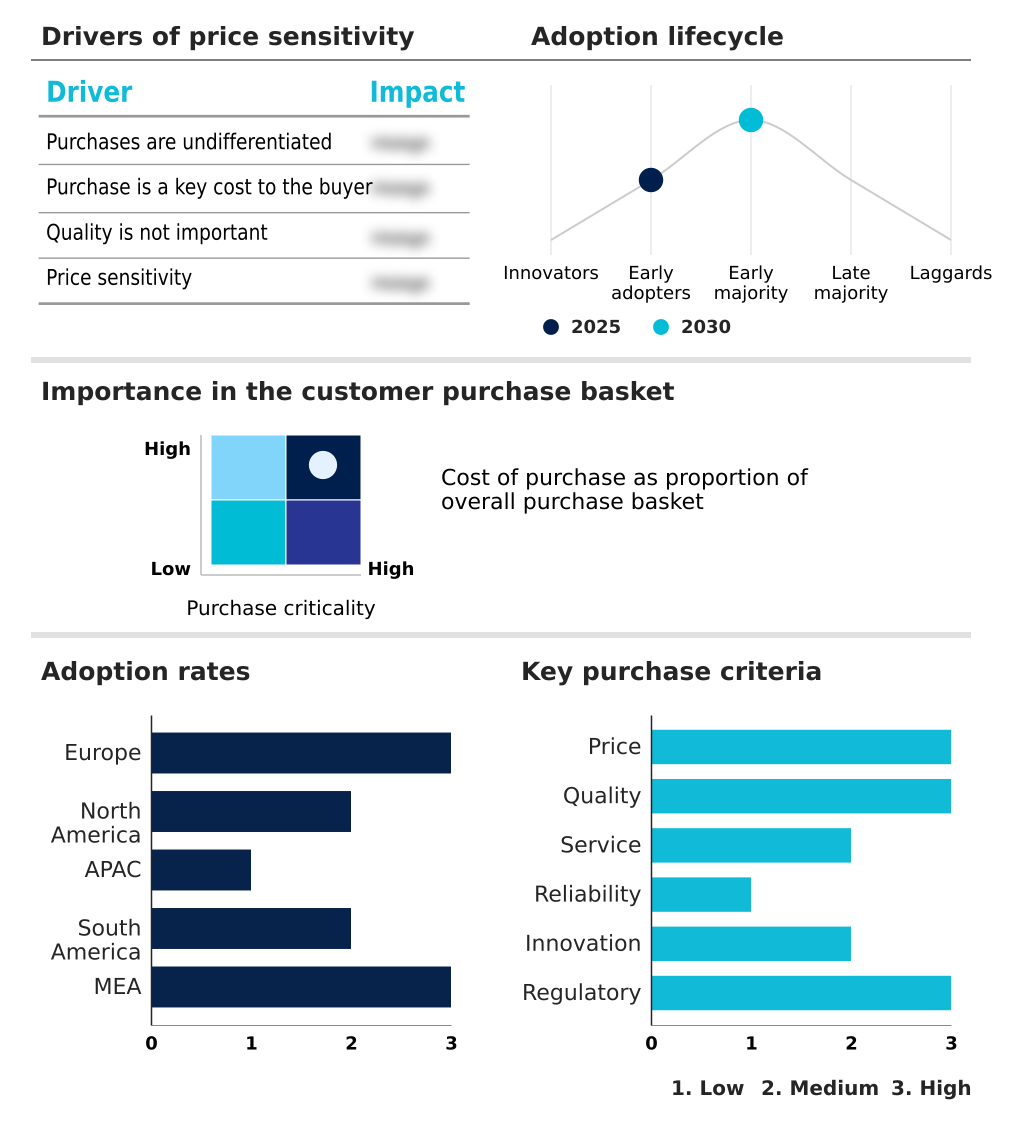
Exclusive Technavio Analysis on Customer Landscape

The cross laminated timber market forecasting report includes the adoption lifecycle of the market, covering from the innovator’s stage to the laggard’s stage. It focuses on adoption rates in different regions based on penetration. Furthermore, the cross laminated timber market report also includes key purchase criteria and drivers of price sensitivity to help companies evaluate and develop their market growth analysis strategies.

Customer Landscape of Cross Laminated Timber Industry

Competitive Landscape

Companies are implementing various strategies, such as strategic alliances, cross laminated timber market forecast, partnerships, mergers and acquisitions, geographical expansion, and product/service launches, to enhance their presence in the industry.

Binderholz GmbH - Analysis indicates a focus on integrated timber solutions, providing cross-laminated and engineered wood products for diverse construction and building applications.

The industry research and growth report includes detailed analyses of the competitive landscape of the market and information about key companies, including:

  • Binderholz GmbH
  • DERIX Group
  • Element5
  • Eugen Decker Holzindustrie KG
  • Hasslacher Holding GmbH
  • Kalesnikoff Lumber Co.
  • KLH Massivholz GmbH
  • Mayr Melnhof Holz Holding AG
  • Mercer International Inc.
  • Nordic Structures
  • Pfeifer Holding GmbH
  • Rubner Holding AG
  • Schilliger Holz AG
  • SmartLam NA
  • Sodra
  • Sterling Structural
  • Stora Enso Oyj
  • StructureCraft Builders Inc.
  • XLam Ltd.
  • Zueblin Timber GmbH

Qualitative and quantitative analysis of companies has been conducted to help clients understand the wider business environment as well as the strengths and weaknesses of key industry players. Data is qualitatively analyzed to categorize companies as pure play, category-focused, industry-focused, and diversified; it is quantitatively analyzed to categorize companies as dominant, leading, strong, tentative, and weak.

Recent Development and News in Cross laminated timber market

  • In April 2025, Stora Enso Oyj expanded its CLT supply agreements for multiple large-scale non-residential construction projects across Europe, including commercial office buildings and institutional facilities.
  • In November 2024, Binderholz GmbH announced the commissioning of a new production line for large-format cross-laminated timber panels, increasing its manufacturing capacity to meet growing demand in European markets.
  • In September 2024, Mercer International Inc. completed the strategic acquisition of a European sawmill, enhancing its vertical integration and securing the raw material supply for its mass timber production.
  • In May 2025, SmartLam NA secured a major contract to supply cross-laminated timber panels for a 15-story residential tower, marking a significant project for mass timber construction in North America.

Dive into Technavio’s robust research methodology, blending expert interviews, extensive data synthesis, and validated models for unparalleled Cross Laminated Timber Market insights. See full methodology.

Market Scope
Page number 276
Base year 2025
Historic period 2020-2024
Forecast period 2026-2030
Growth momentum & CAGR Accelerate at a CAGR of 17%
Market growth 2026-2030 USD 3596967.9 thousand
Market structure Fragmented
YoY growth 2025-2026(%) 16.7%
Key countries Germany, UK, France, Italy, Spain, The Netherlands, US, Canada, Mexico, China, Japan, India, South Korea, Australia, Indonesia, Brazil, Argentina, Chile, Saudi Arabia, UAE, South Africa, Israel and Turkey
Competitive landscape Leading Companies, Market Positioning of Companies, Competitive Strategies, and Industry Risks

Request Free Sample

Research Analyst Overview

  • The cross laminated timber market is maturing from a niche segment into a mainstream component of the construction industry, fundamentally altering project planning and execution. A critical trend is the industrialization of manufacturing processes, where digital design and automated fabrication are creating highly precise, prefabricated components.
  • This shift directly informs boardroom-level decisions regarding capital allocation and risk management, as the predictability of off-site manufacturing can de-risk project timelines and budgets. For example, developers leveraging mass timber have demonstrated the ability to reduce construction schedules by up to 30% compared to conventional in-situ concrete methods.
  • This acceleration enables a faster return on investment, a compelling argument for stakeholders. The industry's trajectory is now less about proving the material's viability and more about scaling production, optimizing supply chains, and navigating the evolving landscape of building codes to meet surging demand for sustainable, high-performance structures.

What are the Key Data Covered in this Cross Laminated Timber Market Research and Growth Report?

  • What is the expected growth of the Cross Laminated Timber Market between 2026 and 2030?

    • USD 3.60 billion, at a CAGR of 17%

  • What segmentation does the market report cover?

    • The report is segmented by End-user (Non-residential, and Residential), Application (Structural, and Non-structural), Type (Adhesive bonded, and Mechanically fastened) and Geography (Europe, North America, APAC, South America, Middle East and Africa)

  • Which regions are analyzed in the report?

    • Europe, North America, APAC, South America and Middle East and Africa

  • What are the key growth drivers and market challenges?

    • Growth in real estate and construction industry, Volatility of raw material prices is hindering growth

  • Who are the major players in the Cross Laminated Timber Market?

    • Binderholz GmbH, DERIX Group, Element5, Eugen Decker Holzindustrie KG, Hasslacher Holding GmbH, Kalesnikoff Lumber Co., KLH Massivholz GmbH, Mayr Melnhof Holz Holding AG, Mercer International Inc., Nordic Structures, Pfeifer Holding GmbH, Rubner Holding AG, Schilliger Holz AG, SmartLam NA, Sodra, Sterling Structural, Stora Enso Oyj, StructureCraft Builders Inc., XLam Ltd. and Zueblin Timber GmbH

Market Research Insights

  • The market is characterized by a dynamic shift toward innovative building materials that support sustainability and efficiency goals. The use of prefabricated structural building components enables modern construction techniques, achieving a 15% reduction in construction waste compared to on-site methods.
  • Building envelope solutions made from mass timber contribute to highly energy-efficient buildings, lowering operational energy costs by as much as 25% over the building's lifecycle. Traditional timber frame construction is being reimagined at a larger scale, with mass timber proving its viability in mid and high-rise structures.
  • This evolution is driven by performance advantages and alignment with green building certifications, making engineered wood a pivotal element in the future of construction.

We can help! Our analysts can customize this cross laminated timber market research report to meet your requirements.

Get in touch

1. Executive Summary

1.1 Market overview

Executive Summary - Chart on Market Overview
Executive Summary - Data Table on Market Overview
Executive Summary - Chart on Global Market Characteristics
Executive Summary - Chart on Market by Geography
Executive Summary - Chart on Market Segmentation by End-user
Executive Summary - Chart on Market Segmentation by Application
Executive Summary - Chart on Market Segmentation by Type
Executive Summary - Chart on Incremental Growth
Executive Summary - Data Table on Incremental Growth
Executive Summary - Chart on Company Market Positioning

2. Technavio Analysis

2.1 Analysis of price sensitivity, lifecycle, customer purchase basket, adoption rates, and purchase criteria

2.2 Criticality of inputs and Factors of differentiation

Chart on Overview on criticality of inputs and factors of differentiation

2.3 Factors of disruption

Chart on Overview on factors of disruption

2.4 Impact of drivers and challenges

Chart on Impact of drivers and challenges in 2025 and 2030

3. Market Landscape

3.1 Market ecosystem

Chart on Parent Market
Data Table on - Parent Market

3.2 Market characteristics

Chart on Market characteristics analysis

3.3 Value chain analysis

Chart on Value chain analysis

4. Market Sizing

4.1 Market definition

Data Table on Offerings of companies included in the market definition

4.2 Market segment analysis

Market segments

4.3 Market size 2025

4.4 Market outlook: Forecast for 2025-2030

Chart on Global - Market size and forecast 2025-2030 ($ thousand)
Data Table on Global - Market size and forecast 2025-2030 ($ thousand)
Chart on Global Market: Year-over-year growth 2025-2030 (%)
Data Table on Global Market: Year-over-year growth 2025-2030 (%)

5. Historic Market Size

5.1 Global Cross Laminated Timber Market 2020 - 2024

Historic Market Size - Data Table on Global Cross Laminated Timber Market 2020 - 2024 ($ thousand)

5.2 End-user segment analysis 2020 - 2024

Historic Market Size - End-user Segment 2020 - 2024 ($ thousand)

5.3 Application segment analysis 2020 - 2024

Historic Market Size - Application Segment 2020 - 2024 ($ thousand)

5.4 Type segment analysis 2020 - 2024

Historic Market Size - Type Segment 2020 - 2024 ($ thousand)

5.5 Geography segment analysis 2020 - 2024

Historic Market Size - Geography Segment 2020 - 2024 ($ thousand)

5.6 Country segment analysis 2020 - 2024

Historic Market Size - Country Segment 2020 - 2024 ($ thousand)

6. Qualitative Analysis

6.1 Impact of AI in Global Cross Laminated Timber Market

6.2 Impact of Geopolitical Conflicts on Global Cross Laminated Timber Market

7. Five Forces Analysis

7.1 Five forces summary

Five forces analysis - Comparison between 2025 and 2030

7.2 Bargaining power of buyers

Bargaining power of buyers - Impact of key factors 2025 and 2030

7.3 Bargaining power of suppliers

Bargaining power of suppliers - Impact of key factors in 2025 and 2030

7.4 Threat of new entrants

Threat of new entrants - Impact of key factors in 2025 and 2030

7.5 Threat of substitutes

Threat of substitutes - Impact of key factors in 2025 and 2030

7.6 Threat of rivalry

Threat of rivalry - Impact of key factors in 2025 and 2030

7.7 Market condition

Chart on Market condition - Five forces 2025 and 2030

8. Market Segmentation by End-user

8.1 Market segments

Chart on End-user - Market share 2025-2030 (%)
Data Table on End-user - Market share 2025-2030 (%)

8.2 Comparison by End-user

Chart on Comparison by End-user
Data Table on Comparison by End-user

8.3 Non-residential - Market size and forecast 2025-2030

Chart on Non-residential - Market size and forecast 2025-2030 ($ thousand)
Data Table on Non-residential - Market size and forecast 2025-2030 ($ thousand)
Chart on Non-residential - Year-over-year growth 2025-2030 (%)
Data Table on Non-residential - Year-over-year growth 2025-2030 (%)

8.4 Residential - Market size and forecast 2025-2030

Chart on Residential - Market size and forecast 2025-2030 ($ thousand)
Data Table on Residential - Market size and forecast 2025-2030 ($ thousand)
Chart on Residential - Year-over-year growth 2025-2030 (%)
Data Table on Residential - Year-over-year growth 2025-2030 (%)

8.5 Market opportunity by End-user

Market opportunity by End-user ($ thousand)
Data Table on Market opportunity by End-user ($ thousand)

9. Market Segmentation by Application

9.1 Market segments

Chart on Application - Market share 2025-2030 (%)
Data Table on Application - Market share 2025-2030 (%)

9.2 Comparison by Application

Chart on Comparison by Application
Data Table on Comparison by Application

9.3 Structural - Market size and forecast 2025-2030

Chart on Structural - Market size and forecast 2025-2030 ($ thousand)
Data Table on Structural - Market size and forecast 2025-2030 ($ thousand)
Chart on Structural - Year-over-year growth 2025-2030 (%)
Data Table on Structural - Year-over-year growth 2025-2030 (%)

9.4 Non-structural - Market size and forecast 2025-2030

Chart on Non-structural - Market size and forecast 2025-2030 ($ thousand)
Data Table on Non-structural - Market size and forecast 2025-2030 ($ thousand)
Chart on Non-structural - Year-over-year growth 2025-2030 (%)
Data Table on Non-structural - Year-over-year growth 2025-2030 (%)

9.5 Market opportunity by Application

Market opportunity by Application ($ thousand)
Data Table on Market opportunity by Application ($ thousand)

10. Market Segmentation by Type

10.1 Market segments

Chart on Type - Market share 2025-2030 (%)
Data Table on Type - Market share 2025-2030 (%)

10.2 Comparison by Type

Chart on Comparison by Type
Data Table on Comparison by Type

10.3 Adhesive bonded - Market size and forecast 2025-2030

Chart on Adhesive bonded - Market size and forecast 2025-2030 ($ thousand)
Data Table on Adhesive bonded - Market size and forecast 2025-2030 ($ thousand)
Chart on Adhesive bonded - Year-over-year growth 2025-2030 (%)
Data Table on Adhesive bonded - Year-over-year growth 2025-2030 (%)

10.4 Mechanically fastened - Market size and forecast 2025-2030

Chart on Mechanically fastened - Market size and forecast 2025-2030 ($ thousand)
Data Table on Mechanically fastened - Market size and forecast 2025-2030 ($ thousand)
Chart on Mechanically fastened - Year-over-year growth 2025-2030 (%)
Data Table on Mechanically fastened - Year-over-year growth 2025-2030 (%)

10.5 Market opportunity by Type

Market opportunity by Type ($ thousand)
Data Table on Market opportunity by Type ($ thousand)

11. Customer Landscape

11.1 Customer landscape overview

Analysis of price sensitivity, lifecycle, customer purchase basket, adoption rates, and purchase criteria

12. Geographic Landscape

12.1 Geographic segmentation

Chart on Market share by geography 2025-2030 (%)
Data Table on Market share by geography 2025-2030 (%)

12.2 Geographic comparison

Chart on Geographic comparison
Data Table on Geographic comparison

12.3 Europe - Market size and forecast 2025-2030

Chart on Europe - Market size and forecast 2025-2030 ($ thousand)
Data Table on Europe - Market size and forecast 2025-2030 ($ thousand)
Chart on Europe - Year-over-year growth 2025-2030 (%)
Data Table on Europe - Year-over-year growth 2025-2030 (%)
Chart on Regional Comparison - Europe
Data Table on Regional Comparison - Europe

12.3.1 Germany - Market size and forecast 2025-2030

Chart on Germany - Market size and forecast 2025-2030 ($ thousand)
Data Table on Germany - Market size and forecast 2025-2030 ($ thousand)
Chart on Germany - Year-over-year growth 2025-2030 (%)
Data Table on Germany - Year-over-year growth 2025-2030 (%)

12.3.2 UK - Market size and forecast 2025-2030

Chart on UK - Market size and forecast 2025-2030 ($ thousand)
Data Table on UK - Market size and forecast 2025-2030 ($ thousand)
Chart on UK - Year-over-year growth 2025-2030 (%)
Data Table on UK - Year-over-year growth 2025-2030 (%)

12.3.3 France - Market size and forecast 2025-2030

Chart on France - Market size and forecast 2025-2030 ($ thousand)
Data Table on France - Market size and forecast 2025-2030 ($ thousand)
Chart on France - Year-over-year growth 2025-2030 (%)
Data Table on France - Year-over-year growth 2025-2030 (%)

12.3.4 Italy - Market size and forecast 2025-2030

Chart on Italy - Market size and forecast 2025-2030 ($ thousand)
Data Table on Italy - Market size and forecast 2025-2030 ($ thousand)
Chart on Italy - Year-over-year growth 2025-2030 (%)
Data Table on Italy - Year-over-year growth 2025-2030 (%)

12.3.5 Spain - Market size and forecast 2025-2030

Chart on Spain - Market size and forecast 2025-2030 ($ thousand)
Data Table on Spain - Market size and forecast 2025-2030 ($ thousand)
Chart on Spain - Year-over-year growth 2025-2030 (%)
Data Table on Spain - Year-over-year growth 2025-2030 (%)

12.3.6 The Netherlands - Market size and forecast 2025-2030

Chart on The Netherlands - Market size and forecast 2025-2030 ($ thousand)
Data Table on The Netherlands - Market size and forecast 2025-2030 ($ thousand)
Chart on The Netherlands - Year-over-year growth 2025-2030 (%)
Data Table on The Netherlands - Year-over-year growth 2025-2030 (%)

12.4 North America - Market size and forecast 2025-2030

Chart on North America - Market size and forecast 2025-2030 ($ thousand)
Data Table on North America - Market size and forecast 2025-2030 ($ thousand)
Chart on North America - Year-over-year growth 2025-2030 (%)
Data Table on North America - Year-over-year growth 2025-2030 (%)
Chart on Regional Comparison - North America
Data Table on Regional Comparison - North America

12.4.1 US - Market size and forecast 2025-2030

Chart on US - Market size and forecast 2025-2030 ($ thousand)
Data Table on US - Market size and forecast 2025-2030 ($ thousand)
Chart on US - Year-over-year growth 2025-2030 (%)
Data Table on US - Year-over-year growth 2025-2030 (%)

12.4.2 Canada - Market size and forecast 2025-2030

Chart on Canada - Market size and forecast 2025-2030 ($ thousand)
Data Table on Canada - Market size and forecast 2025-2030 ($ thousand)
Chart on Canada - Year-over-year growth 2025-2030 (%)
Data Table on Canada - Year-over-year growth 2025-2030 (%)

12.4.3 Mexico - Market size and forecast 2025-2030

Chart on Mexico - Market size and forecast 2025-2030 ($ thousand)
Data Table on Mexico - Market size and forecast 2025-2030 ($ thousand)
Chart on Mexico - Year-over-year growth 2025-2030 (%)
Data Table on Mexico - Year-over-year growth 2025-2030 (%)

12.5 APAC - Market size and forecast 2025-2030

Chart on APAC - Market size and forecast 2025-2030 ($ thousand)
Data Table on APAC - Market size and forecast 2025-2030 ($ thousand)
Chart on APAC - Year-over-year growth 2025-2030 (%)
Data Table on APAC - Year-over-year growth 2025-2030 (%)
Chart on Regional Comparison - APAC
Data Table on Regional Comparison - APAC

12.5.1 China - Market size and forecast 2025-2030

Chart on China - Market size and forecast 2025-2030 ($ thousand)
Data Table on China - Market size and forecast 2025-2030 ($ thousand)
Chart on China - Year-over-year growth 2025-2030 (%)
Data Table on China - Year-over-year growth 2025-2030 (%)

12.5.2 Japan - Market size and forecast 2025-2030

Chart on Japan - Market size and forecast 2025-2030 ($ thousand)
Data Table on Japan - Market size and forecast 2025-2030 ($ thousand)
Chart on Japan - Year-over-year growth 2025-2030 (%)
Data Table on Japan - Year-over-year growth 2025-2030 (%)

12.5.3 India - Market size and forecast 2025-2030

Chart on India - Market size and forecast 2025-2030 ($ thousand)
Data Table on India - Market size and forecast 2025-2030 ($ thousand)
Chart on India - Year-over-year growth 2025-2030 (%)
Data Table on India - Year-over-year growth 2025-2030 (%)

12.5.4 South Korea - Market size and forecast 2025-2030

Chart on South Korea - Market size and forecast 2025-2030 ($ thousand)
Data Table on South Korea - Market size and forecast 2025-2030 ($ thousand)
Chart on South Korea - Year-over-year growth 2025-2030 (%)
Data Table on South Korea - Year-over-year growth 2025-2030 (%)

12.5.5 Australia - Market size and forecast 2025-2030

Chart on Australia - Market size and forecast 2025-2030 ($ thousand)
Data Table on Australia - Market size and forecast 2025-2030 ($ thousand)
Chart on Australia - Year-over-year growth 2025-2030 (%)
Data Table on Australia - Year-over-year growth 2025-2030 (%)

12.5.6 Indonesia - Market size and forecast 2025-2030

Chart on Indonesia - Market size and forecast 2025-2030 ($ thousand)
Data Table on Indonesia - Market size and forecast 2025-2030 ($ thousand)
Chart on Indonesia - Year-over-year growth 2025-2030 (%)
Data Table on Indonesia - Year-over-year growth 2025-2030 (%)

12.6 South America - Market size and forecast 2025-2030

Chart on South America - Market size and forecast 2025-2030 ($ thousand)
Data Table on South America - Market size and forecast 2025-2030 ($ thousand)
Chart on South America - Year-over-year growth 2025-2030 (%)
Data Table on South America - Year-over-year growth 2025-2030 (%)
Chart on Regional Comparison - South America
Data Table on Regional Comparison - South America

12.6.1 Brazil - Market size and forecast 2025-2030

Chart on Brazil - Market size and forecast 2025-2030 ($ thousand)
Data Table on Brazil - Market size and forecast 2025-2030 ($ thousand)
Chart on Brazil - Year-over-year growth 2025-2030 (%)
Data Table on Brazil - Year-over-year growth 2025-2030 (%)

12.6.2 Argentina - Market size and forecast 2025-2030

Chart on Argentina - Market size and forecast 2025-2030 ($ thousand)
Data Table on Argentina - Market size and forecast 2025-2030 ($ thousand)
Chart on Argentina - Year-over-year growth 2025-2030 (%)
Data Table on Argentina - Year-over-year growth 2025-2030 (%)

12.6.3 Chile - Market size and forecast 2025-2030

Chart on Chile - Market size and forecast 2025-2030 ($ thousand)
Data Table on Chile - Market size and forecast 2025-2030 ($ thousand)
Chart on Chile - Year-over-year growth 2025-2030 (%)
Data Table on Chile - Year-over-year growth 2025-2030 (%)

12.7 Middle East and Africa - Market size and forecast 2025-2030

Chart on Middle East and Africa - Market size and forecast 2025-2030 ($ thousand)
Data Table on Middle East and Africa - Market size and forecast 2025-2030 ($ thousand)
Chart on Middle East and Africa - Year-over-year growth 2025-2030 (%)
Data Table on Middle East and Africa - Year-over-year growth 2025-2030 (%)
Chart on Regional Comparison - Middle East and Africa
Data Table on Regional Comparison - Middle East and Africa

12.7.1 Saudi Arabia - Market size and forecast 2025-2030

Chart on Saudi Arabia - Market size and forecast 2025-2030 ($ thousand)
Data Table on Saudi Arabia - Market size and forecast 2025-2030 ($ thousand)
Chart on Saudi Arabia - Year-over-year growth 2025-2030 (%)
Data Table on Saudi Arabia - Year-over-year growth 2025-2030 (%)

12.7.2 UAE - Market size and forecast 2025-2030

Chart on UAE - Market size and forecast 2025-2030 ($ thousand)
Data Table on UAE - Market size and forecast 2025-2030 ($ thousand)
Chart on UAE - Year-over-year growth 2025-2030 (%)
Data Table on UAE - Year-over-year growth 2025-2030 (%)

12.7.3 South Africa - Market size and forecast 2025-2030

Chart on South Africa - Market size and forecast 2025-2030 ($ thousand)
Data Table on South Africa - Market size and forecast 2025-2030 ($ thousand)
Chart on South Africa - Year-over-year growth 2025-2030 (%)
Data Table on South Africa - Year-over-year growth 2025-2030 (%)

12.7.4 Israel - Market size and forecast 2025-2030

Chart on Israel - Market size and forecast 2025-2030 ($ thousand)
Data Table on Israel - Market size and forecast 2025-2030 ($ thousand)
Chart on Israel - Year-over-year growth 2025-2030 (%)
Data Table on Israel - Year-over-year growth 2025-2030 (%)

12.7.5 Turkey - Market size and forecast 2025-2030

Chart on Turkey - Market size and forecast 2025-2030 ($ thousand)
Data Table on Turkey - Market size and forecast 2025-2030 ($ thousand)
Chart on Turkey - Year-over-year growth 2025-2030 (%)
Data Table on Turkey - Year-over-year growth 2025-2030 (%)

12.8 Market opportunity by geography

Market opportunity by geography ($ thousand)
Data Tables on Market opportunity by geography ($ thousand)

13. Drivers, Challenges, and Opportunity

13.1 Market drivers

Growth in real estate and construction industry
Growing demand for sustainable building materials
Increasing demand for durable wood flooring

13.2 Market challenges

Volatility of raw material prices is hindering growth
Availability of numerous substitute products
Rising environmental concerns

13.3 Impact of drivers and challenges

Impact of drivers and challenges in 2025 and 2030

13.4 Market opportunities

Focus on forestry management is expediting market growth
Steady shift in wood supply from natural to plantation forests
Increasing number of office spaces

14. Competitive Landscape

14.1 Overview

14.2

Overview on criticality of inputs and factors of differentiation

14.3 Landscape disruption

Overview on factors of disruption

14.4 Industry risks

Impact of key risks on business

15. Competitive Analysis

15.1 Companies profiled

Companies covered

15.2 Company ranking index

15.3 Market positioning of companies

Matrix on companies position and classification

15.4 Binderholz GmbH

Binderholz GmbH - Overview
Binderholz GmbH - Product / Service
Binderholz GmbH - Key offerings
SWOT

15.5 DERIX Group

DERIX Group - Overview
DERIX Group - Product / Service
DERIX Group - Key offerings
SWOT

15.6 Eugen Decker Holzindustrie KG

Eugen Decker Holzindustrie KG - Overview
Eugen Decker Holzindustrie KG - Product / Service
Eugen Decker Holzindustrie KG - Key offerings
SWOT

15.7 Hasslacher Holding GmbH

Hasslacher Holding GmbH - Overview
Hasslacher Holding GmbH - Product / Service
Hasslacher Holding GmbH - Key offerings
SWOT

15.8 KLH Massivholz GmbH

KLH Massivholz GmbH - Overview
KLH Massivholz GmbH - Product / Service
KLH Massivholz GmbH - Key offerings
SWOT

15.9 Mayr Melnhof Holz Holding AG

Mayr Melnhof Holz Holding AG - Overview
Mayr Melnhof Holz Holding AG - Product / Service
Mayr Melnhof Holz Holding AG - Key offerings
SWOT

15.10 Mercer International Inc.

Mercer International Inc. - Overview
Mercer International Inc. - Business segments
Mercer International Inc. - Key offerings
Mercer International Inc. - Segment focus
SWOT

15.11 Nordic Structures

Nordic Structures - Overview
Nordic Structures - Product / Service
Nordic Structures - Key offerings
SWOT

15.12 Pfeifer Holding GmbH

Pfeifer Holding GmbH - Overview
Pfeifer Holding GmbH - Product / Service
Pfeifer Holding GmbH - Key offerings
SWOT

15.13 Schilliger Holz AG

Schilliger Holz AG - Overview
Schilliger Holz AG - Product / Service
Schilliger Holz AG - Key offerings
SWOT

15.14 SmartLam NA

SmartLam NA - Overview
SmartLam NA - Product / Service
SmartLam NA - Key offerings
SWOT

15.15 Sterling Structural

Sterling Structural - Overview
Sterling Structural - Product / Service
Sterling Structural - Key offerings
SWOT

15.16 Stora Enso Oyj

Stora Enso Oyj - Overview
Stora Enso Oyj - Business segments
Stora Enso Oyj - Key offerings
Stora Enso Oyj - Segment focus
SWOT

15.17 StructureCraft Builders Inc.

StructureCraft Builders Inc. - Overview
StructureCraft Builders Inc. - Product / Service
StructureCraft Builders Inc. - Key offerings
SWOT

15.18 Zueblin Timber GmbH

Zueblin Timber GmbH - Overview
Zueblin Timber GmbH - Product / Service
Zueblin Timber GmbH - Key offerings
SWOT

16. Appendix

16.1 Scope of the report

Market definition
Objectives
Notes and caveats

16.2 Inclusions and exclusions checklist

Inclusions checklist
Exclusions checklist

16.3 Currency conversion rates for US$

16.4 Research methodology

16.5 Data procurement

Information sources

16.6 Data validation

16.7 Validation techniques employed for market sizing

16.8 Data synthesis

16.9 360 degree market analysis

16.10 List of abbreviations

Research Methodology

Technavio presents a detailed picture of the market by way of study, synthesis, and summation of data from multiple sources. The analysts have presented the various facets of the market with a particular focus on identifying the key industry influencers. The data thus presented is comprehensive, reliable, and the result of extensive research, both primary and secondary.

INFORMATION SOURCES

Primary sources

  • Manufacturers and suppliers
  • Channel partners
  • Industry experts
  • Strategic decision makers

Secondary sources

  • Industry journals and periodicals
  • Government data
  • Financial reports of key industry players
  • Historical data
  • Press releases

DATA ANALYSIS

Data Synthesis

  • Collation of data
  • Estimation of key figures
  • Analysis of derived insights

Data Validation

  • Triangulation with data models
  • Reference against proprietary databases
  • Corroboration with industry experts

REPORT WRITING

Qualitative

  • Market drivers
  • Market challenges
  • Market trends
  • Five forces analysis

Quantitative

  • Market size and forecast
  • Market segmentation
  • Geographical insights
  • Competitive landscape

Interested in this report?

Get your sample now to see our research methodology and insights!

Download Now

Frequently Asked Questions

Cross Laminated Timber market growth will increase by USD 3596967.9 thousand thousand during 2026-2030.

The Cross Laminated Timber market is expected to grow at a CAGR of 17% during 2026-2030.

Cross Laminated Timber market is segmented by End-user (Non-residential, Residential) Application (Structural, Non-structural) Type (Adhesive bonded, Mechanically fastened)

Binderholz GmbH, DERIX Group, Element5, Eugen Decker Holzindustrie KG, Hasslacher Holding GmbH, Kalesnikoff Lumber Co., KLH Massivholz GmbH, Mayr Melnhof Holz Holding AG, Mercer International Inc., Nordic Structures, Pfeifer Holding GmbH, Rubner Holding AG, Schilliger Holz AG, SmartLam NA, Sodra, Sterling Structural, Stora Enso Oyj, StructureCraft Builders Inc., XLam Ltd., Zueblin Timber GmbH are a few of the key vendors in the Cross Laminated Timber market.

Europe will register the highest growth rate of 40.5% among the other regions. Therefore, the Cross Laminated Timber market in Europe is expected to garner significant business opportunities for the vendors during the forecast period.

Germany, UK, France, Italy, Spain, The Netherlands, US, Canada, Mexico, China, Japan, India, South Korea, Australia, Indonesia, Brazil, Argentina, Chile, Saudi Arabia, UAE, South Africa, Israel, Turkey

  • Growth in real estate and construction industry is the driving factor this market.

The Cross Laminated Timber market vendors should focus on grabbing business opportunities from the End-user segment as it accounted for the largest market share in the base year.
RIA - Research AI Assistant
Ask RIA