Crude Oil Desalter Market Analysis, Size, and Forecast 2025-2029: APAC (China, Japan, and India), North America (US, Canada, and Mexico), Europe (UK, France, and Italy), Middle East and Africa (Saudi Arabia, UAE, and South Africa), South America (Brazil, Argentina, and Colombia), and Rest of World (ROW)

Crude Oil Desalter Market Analysis, Size, and Forecast 2025-2029:
APAC (China, Japan, and India), North America (US, Canada, and Mexico), Europe (UK, France, and Italy), Middle East and Africa (Saudi Arabia, UAE, and South Africa), South America (Brazil, Argentina, and Colombia), and Rest of World (ROW)

Published: Dec 2025 288 Pages SKU: IRTNTR73684

Market Overview at a Glance

$92.9 Mn
Market Opportunity
6.3%
CAGR 2024 - 2029
34%
APAC Growth
$181.2 Mn
Multi-stage desalter segment 2023

Crude Oil Desalter Market Size 2025-2029

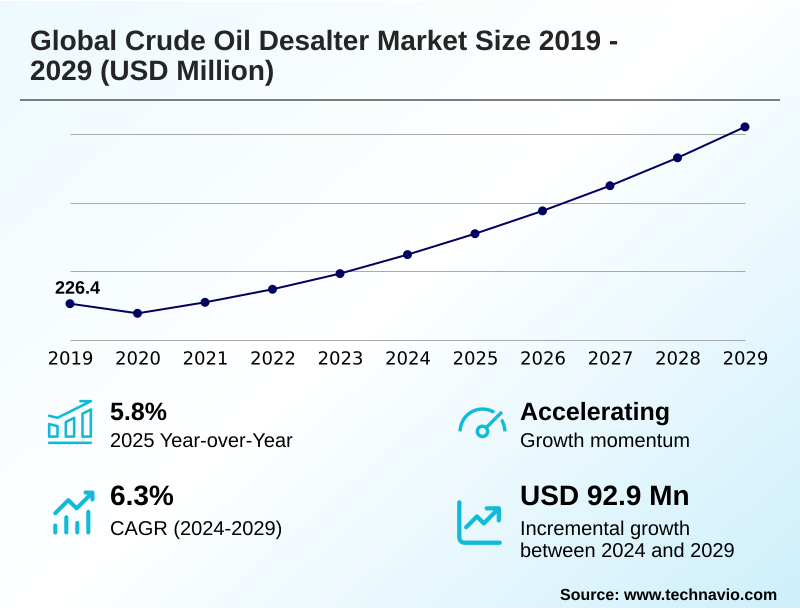
The crude oil desalter market size is valued to increase by USD 92.9 million, at a CAGR of 6.3% from 2024 to 2029. Processing heavier crude slates will drive the crude oil desalter market.

Major Market Trends & Insights

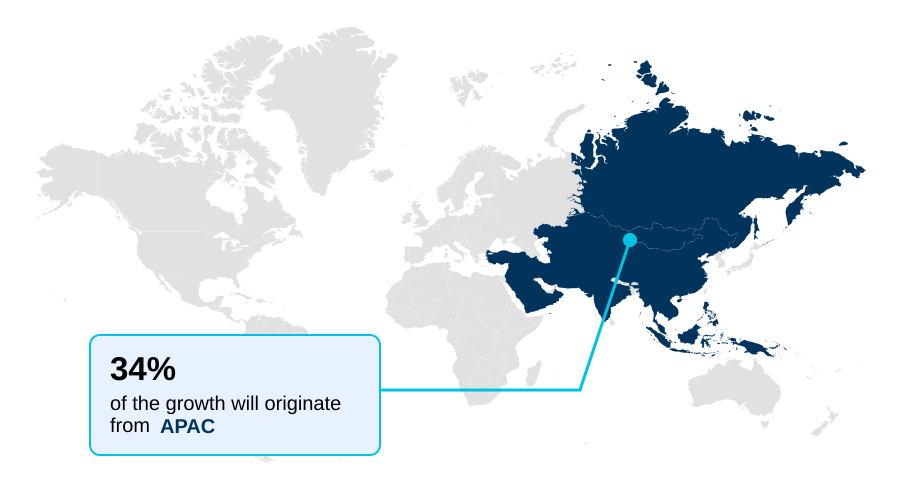
  • APAC dominated the market and accounted for a 34% growth during the forecast period.
  • By Product - Multi-stage desalter segment was valued at USD 181.2 million in 2023
  • By Type - Electrostatic dehydrator segment accounted for the largest market revenue share in 2023

Market Size & Forecast

  • Market Opportunities: USD 128.6 million
  • Market Future Opportunities: USD 92.9 million
  • CAGR from 2024 to 2029 : 6.3%

Market Summary

  • The crude oil desalter market is shaped by the critical need for efficient crude oil pre-treatment to protect downstream refinery assets. The industry's shift toward heavy crude processing necessitates advanced solutions like multi-stage desalting and sophisticated electrostatic coalescence to manage challenging water-in-oil emulsions and prevent catalyst poisoning prevention.
  • A key business scenario involves a refinery retrofitting its single-stage unit to a two-stage system to handle opportunity crudes; this investment in refinery modernization is justified by preventing costly downstream corrosion mitigation and heat exchanger fouling, thereby improving margins. Concurrently, trends like the adoption of compact desalter systems for offshore processing facilities are gaining traction.
  • Innovations in process control systems and demulsifier chemical programs are pivotal for optimizing performance. However, the market faces challenges related to the high capital cost of turnkey modular packages and the technical complexities of asphaltene stabilization.
  • Ultimately, the market evolves to balance economic incentives with operational reliability and environmental compliance, focusing on technologies that ensure efficient sediment and water removal and enable processing of diverse feedstocks, including those from crude-to-chemicals (COTC) operations.

What will be the Size of the Crude Oil Desalter Market during the forecast period?

Get Key Insights on Market Forecast (PDF) Request Free Sample

How is the Crude Oil Desalter Market Segmented?

The crude oil desalter industry research report provides comprehensive data (region-wise segment analysis), with forecasts and estimates in "USD million" for the period 2025-2029, as well as historical data from 2019-2023 for the following segments.

  • Product
    • Multi-stage desalter
    • Single-stage desalter
  • Type
    • Electrostatic dehydrator
    • Desalting process
  • Application
    • Refineries
    • Oil and gas production
    • Petrochemical plants
  • Geography
    • APAC
      • China
      • Japan
      • India
    • North America
      • US
      • Canada
      • Mexico
    • Europe
      • UK
      • France
      • Italy
    • Middle East and Africa
      • Saudi Arabia
      • UAE
      • South Africa
    • South America
      • Brazil
      • Argentina
      • Colombia
    • Rest of World (ROW)

By Product Insights

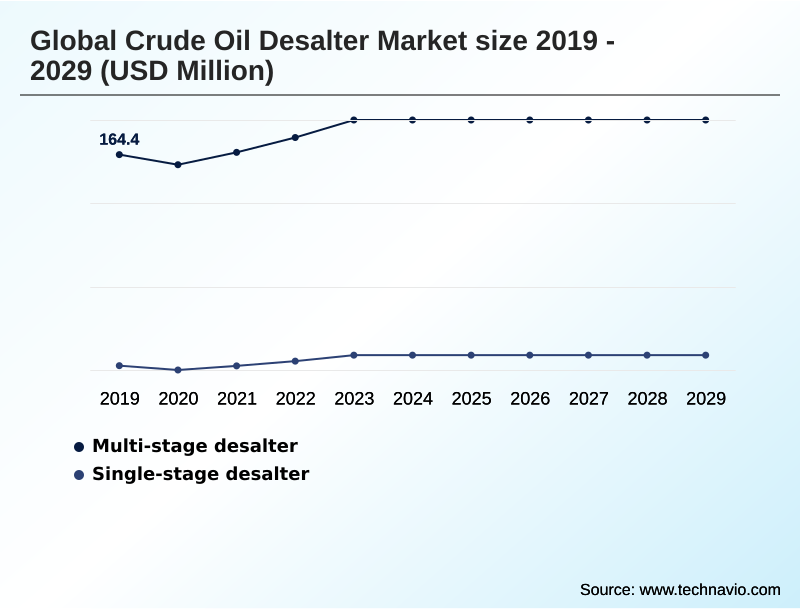
The multi-stage desalter segment is estimated to witness significant growth during the forecast period.

The multi-stage desalter segment is expanding, driven by the economic imperative for heavy crude processing. These systems employ sequential vessels for superior salt removal efficiency, which is critical for downstream corrosion mitigation.

Unlike single-stage units, multi-stage systems use a counter-current flow of crude and wash water, enabling a higher degree of purification and achieving up to 99% removal of corrosive salts.

This protects high-value downstream assets from accelerated heat exchanger fouling and catalyst poisoning prevention. The adoption of this technology is a direct response to the operational risks posed by opportunity crude processing, making it essential for refinery modernization.

This approach supports comprehensive asset integrity management and is vital for processing high salinity crude feedstocks.

Request Free Sample

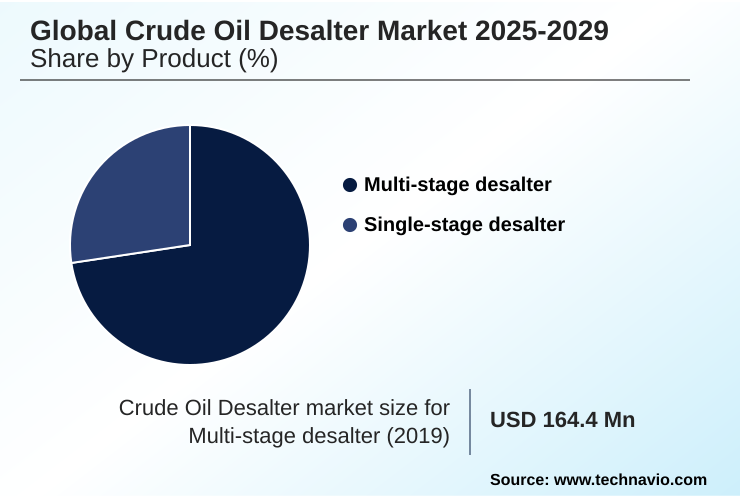
The Multi-stage desalter segment was valued at USD 181.2 million in 2023 and showed a gradual increase during the forecast period.

Request Free Sample

Regional Analysis

APAC is estimated to contribute 34% to the growth of the global market during the forecast period.Technavio’s analysts have elaborately explained the regional trends and drivers that shape the market during the forecast period.

See How Crude Oil Desalter Market Demand is Rising in APAC Request Free Sample

The geographic landscape of the market is characterized by distinct regional dynamics. APAC is the primary growth engine, contributing over 34% of the incremental growth, fueled by new refinery construction in China and India focused on heavy crude processing.

These projects demand advanced multi-stage desalting and electrostatic dehydrator units. In contrast, North America and Europe are mature markets where the focus is on refinery modernization and brownfield retrofit projects.

Here, investments are driven by regulatory compliance tools and the need for operational expenditure reduction, with facilities achieving up to 15% lower energy use after upgrading to modern process control systems.

The Middle East is expanding its crude-to-chemicals (COTC) capacity, requiring high-performance crude oil pre-treatment and produced water treatment technologies to protect sensitive catalysts.

Market Dynamics

Our researchers analyzed the data with 2024 as the base year, along with the key drivers, trends, and challenges. A holistic analysis of drivers will help companies refine their marketing strategies to gain a competitive advantage.

  • Strategic decision-making in the crude oil desalter market hinges on a deep understanding of long-tail operational factors. The desalter performance for heavy crude is a primary concern, as is optimizing chemical usage in desalters to manage costs without compromising emulsion breaking.
  • The total cost of desalter fouling, which can reduce heat transfer efficiency by over 25% compared to clean systems, is a critical metric driving investment in electrostatic grid design improvements and advanced desalting for opportunity crudes. For upstream operations, managing high water cut emulsions and preventing desalter electrical upsets are key to maintaining production.
  • In refineries, the focus is on upgrading single-stage to multi-stage systems to improve reliability and achieve effective corrosion control in crude units. Key performance indicators include desalter wash water optimization and reducing desalter energy consumption. The salt content impact on catalysts remains a paramount concern, pushing innovation in desalter control system automation.
  • For new projects, footprint reduction in modular desalters is vital for offshore platforms, while the ROI of desalter modernization must be clearly justified. The environmental impact of desalter effluent is driving demand for integrated desalter and water treatment solutions.
  • Furthermore, specialized desalting technology for shale oil and predictive analytics for desalter maintenance are becoming standard requirements, with desalter design for offshore platforms demanding unique engineering solutions.

What are the key market drivers leading to the rise in the adoption of Crude Oil Desalter Industry?

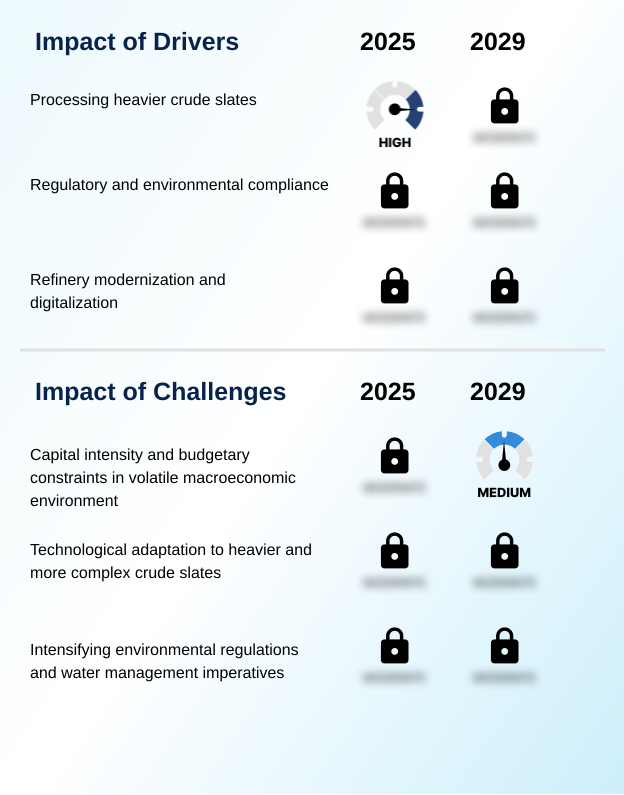
  • The increasing necessity to process heavier and more contaminated crude slates stands as a primary driver for the market.

  • Market growth is primarily propelled by the structural shift toward processing heavier, more challenging feedstocks. This necessity for heavy crude processing drives demand for advanced multi-stage desalting technologies capable of handling high salinity crude.
  • Refineries processing such opportunity crudes can improve margins by over 5%, but only with robust crude oil pre-treatment to avoid catastrophic equipment failure.
  • A second major driver is stringent regulatory pressure, compelling investment in high-performance regulatory compliance tools for effective downstream corrosion mitigation. Thirdly, the push for refinery modernization and operational expenditure reduction is accelerating the adoption of new technologies.
  • Upgrading to advanced electrostatic coalescence systems can increase processing throughput by 10% without expanding footprint.

What are the market trends shaping the Crude Oil Desalter Industry?

  • The integration of digitalization and advanced process control systems is emerging as a transformative market trend. This shift moves operations from traditional mechanical processes toward intelligent, data-driven optimization for enhanced efficiency.

  • Key trends are reshaping the market, moving beyond basic separation to integrated, intelligent systems. The digitalization of operations, incorporating the industrial internet of things (IIoT) and advanced process control (APC), is a major focus, with some operators reporting a 15% reduction in unplanned downtime through predictive maintenance models.
  • Another significant trend is the push toward sustainability, driving demand for advanced produced water treatment and zero-liquid discharge (ZLD) solutions to meet stricter wastewater effluent quality regulations. This focus on energy efficiency in refining has led to designs that improve heat integration.
  • Additionally, the move toward modular engineering packages and compact desalter systems allows for faster deployment in brownfield retrofit projects and offshore processing facilities, reducing installation time by up to 30%.

What challenges does the Crude Oil Desalter Industry face during its growth?

  • High capital intensity and budgetary constraints within a volatile macroeconomic environment present a significant challenge to industry growth.

  • The market faces significant hurdles, led by the high capital cost of new systems, which often delays brownfield retrofit projects in volatile economic climates. A primary technical challenge is the continuous adaptation required for effective dehydration and desalting of increasingly complex feedstocks, such as those from bitumen desalting and heavy oil upgrading.
  • Failure to manage difficult emulsions can lead to a 25% increase in maintenance costs for downstream units. Another major challenge is intensifying environmental regulation, which demands significant investment in hydrocarbon recovery systems and technologies to improve wastewater effluent quality.
  • Meeting these standards adds to the total cost of ownership, making asset integrity management more complex while navigating the need for operational excellence.

Exclusive Technavio Analysis on Customer Landscape

The crude oil desalter market forecasting report includes the adoption lifecycle of the market, covering from the innovator’s stage to the laggard’s stage. It focuses on adoption rates in different regions based on penetration. Furthermore, the crude oil desalter market report also includes key purchase criteria and drivers of price sensitivity to help companies evaluate and develop their market growth analysis strategies.

Customer Landscape of Crude Oil Desalter Industry

Competitive Landscape

Companies are implementing various strategies, such as strategic alliances, crude oil desalter market forecast, partnerships, mergers and acquisitions, geographical expansion, and product/service launches, to enhance their presence in the industry.

Agar Corp. - Key solutions focus on high-performance separation systems, engineered for optimized dehydration and effective salt removal to enhance crude oil quality and protect downstream assets.

The industry research and growth report includes detailed analyses of the competitive landscape of the market and information about key companies, including:

  • Agar Corp.
  • Alfa Laval AB
  • AMR Process Inc.
  • Axens Group
  • Baker Hughes Co.
  • Canadian Petroleum Processing Equipment Inc.
  • Croda International Plc
  • Desalters LLC
  • EN-FAB Inc
  • Forum Energy Technologies Inc.
  • Frames Energy Systems BV
  • GEA Group AG
  • Komax Systems
  • Mackenzie Hydrocarbons Australia Pty Ltd.
  • McDermott International Ltd.
  • Petro Techna International
  • Schlumberger Ltd.
  • TechnipFMC plc
  • Veolia Environment SA
  • VME Process Inc.

Qualitative and quantitative analysis of companies has been conducted to help clients understand the wider business environment as well as the strengths and weaknesses of key industry players. Data is qualitatively analyzed to categorize companies as pure play, category-focused, industry-focused, and diversified; it is quantitatively analyzed to categorize companies as dominant, leading, strong, tentative, and weak.

Recent Development and News in Crude oil desalter market

  • In August, 2024, PetroProcess Innovators announced a strategic partnership with Axiom Digital Solutions to develop a comprehensive digital twin for desalters, aiming to optimize chemical dosage and predict maintenance needs in real-time for heavy crude processing.
  • In November, 2024, Separation Specialists Inc. acquired Emulsion-Break Technologies, a niche provider of advanced demulsifier chemical programs, to enhance its integrated solutions for upstream and refinery applications.
  • In February, 2025, Modular Systems Co. launched its new compact desalter system, the 'Offshore Pro,' specifically designed for FPSO topside modules to reduce footprint and weight while maximizing water removal efficiency.
  • In April, 2025, Eco-Refine Technologies received regulatory approval for its integrated zero-liquid discharge (ZLD) system, which combines multi-stage desalting with advanced produced water treatment to meet stringent new environmental standards for refinery wastewater effluent.

Dive into Technavio’s robust research methodology, blending expert interviews, extensive data synthesis, and validated models for unparalleled Crude Oil Desalter Market insights. See full methodology.

Market Scope
Page number 288
Base year 2024
Historic period 2019-2023
Forecast period 2025-2029
Growth momentum & CAGR Accelerate at a CAGR of 6.3%
Market growth 2025-2029 USD 92.9 million
Market structure Fragmented
YoY growth 2024-2025(%) 5.8%
Key countries China, Japan, India, Australia, South Korea, Indonesia, US, Canada, Mexico, Russia, UK, France, Italy, The Netherlands, Spain, Saudi Arabia, UAE, South Africa, Israel, Turkey, Brazil, Argentina and Colombia
Competitive landscape Leading Companies, Market Positioning of Companies, Competitive Strategies, and Industry Risks

Request Free Sample

Research Analyst Overview

  • The crude oil desalter market is fundamentally driven by the need to protect refinery assets through effective crude oil pre-treatment. The shift to heavy crude processing requires advanced technologies like multi-stage desalting and dual-frequency treaters for robust emulsion breaking and sediment and water removal.
  • For boardroom decisions, the key consideration is balancing capital expenditure on turnkey modular packages against the long-term operational savings from downstream corrosion mitigation and catalyst poisoning prevention. A major trend is refinery modernization, where integrating advanced process control systems with electrostatic dehydrator units has demonstrated a reduction in chemical overuse by 20%.
  • Technologies such as high-voltage electrostatic fields and sophisticated interface level control are standard. Compact desalter systems are becoming critical for offshore processing facilities and crude-to-chemicals (COTC) plants, which have zero tolerance for contaminants. The market's evolution is also shaped by the performance of demulsifier chemical programs in handling water-in-oil emulsions and mitigating issues like asphaltene stabilization and heat exchanger fouling.
  • Efficient produced water treatment is now a key part of any desalter solution.

What are the Key Data Covered in this Crude Oil Desalter Market Research and Growth Report?

  • What is the expected growth of the Crude Oil Desalter Market between 2025 and 2029?

    • USD 92.9 million, at a CAGR of 6.3%

  • What segmentation does the market report cover?

    • The report is segmented by Product (Multi-stage desalter, Single-stage desalter), Type (Electrostatic dehydrator, Desalting process), Application (Refineries, Oil and gas production, Petrochemical plants) and Geography (APAC, North America, Europe, Middle East and Africa, South America)

  • Which regions are analyzed in the report?

    • APAC, North America, Europe, Middle East and Africa and South America

  • What are the key growth drivers and market challenges?

    • Processing heavier crude slates, Capital intensity and budgetary constraints in volatile macroeconomic environment

  • Who are the major players in the Crude Oil Desalter Market?

    • Agar Corp., Alfa Laval AB, AMR Process Inc., Axens Group, Baker Hughes Co., Canadian Petroleum Processing Equipment Inc., Croda International Plc, Desalters LLC, EN-FAB Inc, Forum Energy Technologies Inc., Frames Energy Systems BV, GEA Group AG, Komax Systems, Mackenzie Hydrocarbons Australia Pty Ltd., McDermott International Ltd., Petro Techna International, Schlumberger Ltd., TechnipFMC plc, Veolia Environment SA and VME Process Inc.

Market Research Insights

  • The market is shaped by dynamic forces including the need for opportunity crude processing and specialized bitumen desalting. Advances in modular engineering packages and skid-mounted systems are facilitating brownfield retrofit projects, driving operational expenditure reduction. The implementation of a digital twin for desalters, leveraging the industrial internet of things (IIoT) and advanced process control (APC), enables real-time optimization.
  • Refiners are achieving refinery margin improvement of over 5% through better crude oil conditioning and hydrocarbon recovery systems. Asset integrity management is enhanced by solutions for dehydration and desalting on FPSO topside modules. Stricter wastewater effluent quality standards are pushing the adoption of zero-liquid discharge (ZLD) technologies and other regulatory compliance tools, which can improve water recycling rates by 20%.
  • This focus on energy efficiency in refining and heavy oil upgrading is validated by predictive maintenance models that reduce downtime.

We can help! Our analysts can customize this crude oil desalter market research report to meet your requirements.

Get in touch

1. Executive Summary

1.1 Market overview

Executive Summary - Chart on Market Overview
Executive Summary - Data Table on Market Overview
Executive Summary - Chart on Global Market Characteristics
Executive Summary - Chart on Market by Geography
Executive Summary - Chart on Market Segmentation by Product
Executive Summary - Chart on Market Segmentation by Type
Executive Summary - Chart on Market Segmentation by Application
Executive Summary - Chart on Incremental Growth
Executive Summary - Data Table on Incremental Growth
Executive Summary - Chart on Company Market Positioning

2. Technavio Analysis

2.1 Analysis of price sensitivity, lifecycle, customer purchase basket, adoption rates, and purchase criteria

2.2 Criticality of inputs and Factors of differentiation

Chart on Overview on criticality of inputs and factors of differentiation

2.3 Factors of disruption

Chart on Overview on factors of disruption

2.4 Impact of drivers and challenges

Chart on Impact of drivers and challenges in 2024 and 2029

3. Market Landscape

3.1 Market ecosystem

Chart on Parent Market
Data Table on - Parent Market

3.2 Market characteristics

Chart on Market characteristics analysis

3.3 Value chain analysis

Chart on Value chain analysis

4. Market Sizing

4.1 Market definition

Data Table on Offerings of companies included in the market definition

4.2 Market segment analysis

Market segments

4.3 Market size 2024

4.4 Market outlook: Forecast for 2024-2029

Chart on Global - Market size and forecast 2024-2029 ($ million)
Data Table on Global - Market size and forecast 2024-2029 ($ million)
Chart on Global Market: Year-over-year growth 2024-2029 (%)
Data Table on Global Market: Year-over-year growth 2024-2029 (%)

5. Historic Market Size

5.1 Global Crude Oil Desalter Market 2019 - 2023

Historic Market Size - Data Table on Global Crude Oil Desalter Market 2019 - 2023 ($ million)

5.2 Product segment analysis 2019 - 2023

Historic Market Size - Product Segment 2019 - 2023 ($ million)

5.3 Type segment analysis 2019 - 2023

Historic Market Size - Type Segment 2019 - 2023 ($ million)

5.4 Application segment analysis 2019 - 2023

Historic Market Size - Application Segment 2019 - 2023 ($ million)

5.5 Geography segment analysis 2019 - 2023

Historic Market Size - Geography Segment 2019 - 2023 ($ million)

5.6 Country segment analysis 2019 - 2023

Historic Market Size - Country Segment 2019 - 2023 ($ million)

6. Qualitative Analysis

6.1 The impact of AI in Global Crude Oil Desalter Market

7. Five Forces Analysis

7.1 Five forces summary

Five forces analysis - Comparison between 2024 and 2029

7.2 Bargaining power of buyers

Bargaining power of buyers - Impact of key factors 2024 and 2029

7.3 Bargaining power of suppliers

Bargaining power of suppliers - Impact of key factors in 2024 and 2029

7.4 Threat of new entrants

Threat of new entrants - Impact of key factors in 2024 and 2029

7.5 Threat of substitutes

Threat of substitutes - Impact of key factors in 2024 and 2029

7.6 Threat of rivalry

Threat of rivalry - Impact of key factors in 2024 and 2029

7.7 Market condition

Chart on Market condition - Five forces 2024 and 2029

8. Market Segmentation by Product

8.1 Market segments

Chart on Product - Market share 2024-2029 (%)
Data Table on Product - Market share 2024-2029 (%)

8.2 Comparison by Product

Chart on Comparison by Product
Data Table on Comparison by Product

8.3 Multi-stage desalter - Market size and forecast 2024-2029

Chart on Multi-stage desalter - Market size and forecast 2024-2029 ($ million)
Data Table on Multi-stage desalter - Market size and forecast 2024-2029 ($ million)
Chart on Multi-stage desalter - Year-over-year growth 2024-2029 (%)
Data Table on Multi-stage desalter - Year-over-year growth 2024-2029 (%)

8.4 Single-stage desalter - Market size and forecast 2024-2029

Chart on Single-stage desalter - Market size and forecast 2024-2029 ($ million)
Data Table on Single-stage desalter - Market size and forecast 2024-2029 ($ million)
Chart on Single-stage desalter - Year-over-year growth 2024-2029 (%)
Data Table on Single-stage desalter - Year-over-year growth 2024-2029 (%)

8.5 Market opportunity by Product

Market opportunity by Product ($ million)
Data Table on Market opportunity by Product ($ million)

9. Market Segmentation by Type

9.1 Market segments

Chart on Type - Market share 2024-2029 (%)
Data Table on Type - Market share 2024-2029 (%)

9.2 Comparison by Type

Chart on Comparison by Type
Data Table on Comparison by Type

9.3 Electrostatic dehydrator - Market size and forecast 2024-2029

Chart on Electrostatic dehydrator - Market size and forecast 2024-2029 ($ million)
Data Table on Electrostatic dehydrator - Market size and forecast 2024-2029 ($ million)
Chart on Electrostatic dehydrator - Year-over-year growth 2024-2029 (%)
Data Table on Electrostatic dehydrator - Year-over-year growth 2024-2029 (%)

9.4 Desalting process - Market size and forecast 2024-2029

Chart on Desalting process - Market size and forecast 2024-2029 ($ million)
Data Table on Desalting process - Market size and forecast 2024-2029 ($ million)
Chart on Desalting process - Year-over-year growth 2024-2029 (%)
Data Table on Desalting process - Year-over-year growth 2024-2029 (%)

9.5 Market opportunity by Type

Market opportunity by Type ($ million)
Data Table on Market opportunity by Type ($ million)

10. Market Segmentation by Application

10.1 Market segments

Chart on Application - Market share 2024-2029 (%)
Data Table on Application - Market share 2024-2029 (%)

10.2 Comparison by Application

Chart on Comparison by Application
Data Table on Comparison by Application

10.3 Refineries - Market size and forecast 2024-2029

Chart on Refineries - Market size and forecast 2024-2029 ($ million)
Data Table on Refineries - Market size and forecast 2024-2029 ($ million)
Chart on Refineries - Year-over-year growth 2024-2029 (%)
Data Table on Refineries - Year-over-year growth 2024-2029 (%)

10.4 Oil and gas production - Market size and forecast 2024-2029

Chart on Oil and gas production - Market size and forecast 2024-2029 ($ million)
Data Table on Oil and gas production - Market size and forecast 2024-2029 ($ million)
Chart on Oil and gas production - Year-over-year growth 2024-2029 (%)
Data Table on Oil and gas production - Year-over-year growth 2024-2029 (%)

10.5 Petrochemical plants - Market size and forecast 2024-2029

Chart on Petrochemical plants - Market size and forecast 2024-2029 ($ million)
Data Table on Petrochemical plants - Market size and forecast 2024-2029 ($ million)
Chart on Petrochemical plants - Year-over-year growth 2024-2029 (%)
Data Table on Petrochemical plants - Year-over-year growth 2024-2029 (%)

10.6 Market opportunity by Application

Market opportunity by Application ($ million)
Data Table on Market opportunity by Application ($ million)

11. Customer Landscape

11.1 Customer landscape overview

Analysis of price sensitivity, lifecycle, customer purchase basket, adoption rates, and purchase criteria

12. Geographic Landscape

12.1 Geographic segmentation

Chart on Market share by geography 2024-2029 (%)
Data Table on Market share by geography 2024-2029 (%)

12.2 Geographic comparison

Chart on Geographic comparison
Data Table on Geographic comparison

12.3 APAC - Market size and forecast 2024-2029

Chart on APAC - Market size and forecast 2024-2029 ($ million)
Data Table on APAC - Market size and forecast 2024-2029 ($ million)
Chart on APAC - Year-over-year growth 2024-2029 (%)
Data Table on APAC - Year-over-year growth 2024-2029 (%)
Chart on Regional Comparison - APAC
Data Table on Regional Comparison - APAC

12.3.1 China - Market size and forecast 2024-2029

Chart on China - Market size and forecast 2024-2029 ($ million)
Data Table on China - Market size and forecast 2024-2029 ($ million)
Chart on China - Year-over-year growth 2024-2029 (%)
Data Table on China - Year-over-year growth 2024-2029 (%)

12.3.2 Japan - Market size and forecast 2024-2029

Chart on Japan - Market size and forecast 2024-2029 ($ million)
Data Table on Japan - Market size and forecast 2024-2029 ($ million)
Chart on Japan - Year-over-year growth 2024-2029 (%)
Data Table on Japan - Year-over-year growth 2024-2029 (%)

12.3.3 India - Market size and forecast 2024-2029

Chart on India - Market size and forecast 2024-2029 ($ million)
Data Table on India - Market size and forecast 2024-2029 ($ million)
Chart on India - Year-over-year growth 2024-2029 (%)
Data Table on India - Year-over-year growth 2024-2029 (%)

12.3.4 Australia - Market size and forecast 2024-2029

Chart on Australia - Market size and forecast 2024-2029 ($ million)
Data Table on Australia - Market size and forecast 2024-2029 ($ million)
Chart on Australia - Year-over-year growth 2024-2029 (%)
Data Table on Australia - Year-over-year growth 2024-2029 (%)

12.3.5 South Korea - Market size and forecast 2024-2029

Chart on South Korea - Market size and forecast 2024-2029 ($ million)
Data Table on South Korea - Market size and forecast 2024-2029 ($ million)
Chart on South Korea - Year-over-year growth 2024-2029 (%)
Data Table on South Korea - Year-over-year growth 2024-2029 (%)

12.3.6 Indonesia - Market size and forecast 2024-2029

Chart on Indonesia - Market size and forecast 2024-2029 ($ million)
Data Table on Indonesia - Market size and forecast 2024-2029 ($ million)
Chart on Indonesia - Year-over-year growth 2024-2029 (%)
Data Table on Indonesia - Year-over-year growth 2024-2029 (%)

12.4 North America - Market size and forecast 2024-2029

Chart on North America - Market size and forecast 2024-2029 ($ million)
Data Table on North America - Market size and forecast 2024-2029 ($ million)
Chart on North America - Year-over-year growth 2024-2029 (%)
Data Table on North America - Year-over-year growth 2024-2029 (%)
Chart on Regional Comparison - North America
Data Table on Regional Comparison - North America

12.4.1 US - Market size and forecast 2024-2029

Chart on US - Market size and forecast 2024-2029 ($ million)
Data Table on US - Market size and forecast 2024-2029 ($ million)
Chart on US - Year-over-year growth 2024-2029 (%)
Data Table on US - Year-over-year growth 2024-2029 (%)

12.4.2 Canada - Market size and forecast 2024-2029

Chart on Canada - Market size and forecast 2024-2029 ($ million)
Data Table on Canada - Market size and forecast 2024-2029 ($ million)
Chart on Canada - Year-over-year growth 2024-2029 (%)
Data Table on Canada - Year-over-year growth 2024-2029 (%)

12.4.3 Mexico - Market size and forecast 2024-2029

Chart on Mexico - Market size and forecast 2024-2029 ($ million)
Data Table on Mexico - Market size and forecast 2024-2029 ($ million)
Chart on Mexico - Year-over-year growth 2024-2029 (%)
Data Table on Mexico - Year-over-year growth 2024-2029 (%)

12.5 Europe - Market size and forecast 2024-2029

Chart on Europe - Market size and forecast 2024-2029 ($ million)
Data Table on Europe - Market size and forecast 2024-2029 ($ million)
Chart on Europe - Year-over-year growth 2024-2029 (%)
Data Table on Europe - Year-over-year growth 2024-2029 (%)
Chart on Regional Comparison - Europe
Data Table on Regional Comparison - Europe

12.5.1 Russia - Market size and forecast 2024-2029

Chart on Russia - Market size and forecast 2024-2029 ($ million)
Data Table on Russia - Market size and forecast 2024-2029 ($ million)
Chart on Russia - Year-over-year growth 2024-2029 (%)
Data Table on Russia - Year-over-year growth 2024-2029 (%)

12.5.2 UK - Market size and forecast 2024-2029

Chart on UK - Market size and forecast 2024-2029 ($ million)
Data Table on UK - Market size and forecast 2024-2029 ($ million)
Chart on UK - Year-over-year growth 2024-2029 (%)
Data Table on UK - Year-over-year growth 2024-2029 (%)

12.5.3 France - Market size and forecast 2024-2029

Chart on France - Market size and forecast 2024-2029 ($ million)
Data Table on France - Market size and forecast 2024-2029 ($ million)
Chart on France - Year-over-year growth 2024-2029 (%)
Data Table on France - Year-over-year growth 2024-2029 (%)

12.5.4 Italy - Market size and forecast 2024-2029

Chart on Italy - Market size and forecast 2024-2029 ($ million)
Data Table on Italy - Market size and forecast 2024-2029 ($ million)
Chart on Italy - Year-over-year growth 2024-2029 (%)
Data Table on Italy - Year-over-year growth 2024-2029 (%)

12.5.5 The Netherlands - Market size and forecast 2024-2029

Chart on The Netherlands - Market size and forecast 2024-2029 ($ million)
Data Table on The Netherlands - Market size and forecast 2024-2029 ($ million)
Chart on The Netherlands - Year-over-year growth 2024-2029 (%)
Data Table on The Netherlands - Year-over-year growth 2024-2029 (%)

12.5.6 Spain - Market size and forecast 2024-2029

Chart on Spain - Market size and forecast 2024-2029 ($ million)
Data Table on Spain - Market size and forecast 2024-2029 ($ million)
Chart on Spain - Year-over-year growth 2024-2029 (%)
Data Table on Spain - Year-over-year growth 2024-2029 (%)

12.6 Middle East and Africa - Market size and forecast 2024-2029

Chart on Middle East and Africa - Market size and forecast 2024-2029 ($ million)
Data Table on Middle East and Africa - Market size and forecast 2024-2029 ($ million)
Chart on Middle East and Africa - Year-over-year growth 2024-2029 (%)
Data Table on Middle East and Africa - Year-over-year growth 2024-2029 (%)
Chart on Regional Comparison - Middle East and Africa
Data Table on Regional Comparison - Middle East and Africa

12.6.1 Saudi Arabia - Market size and forecast 2024-2029

Chart on Saudi Arabia - Market size and forecast 2024-2029 ($ million)
Data Table on Saudi Arabia - Market size and forecast 2024-2029 ($ million)
Chart on Saudi Arabia - Year-over-year growth 2024-2029 (%)
Data Table on Saudi Arabia - Year-over-year growth 2024-2029 (%)

12.6.2 UAE - Market size and forecast 2024-2029

Chart on UAE - Market size and forecast 2024-2029 ($ million)
Data Table on UAE - Market size and forecast 2024-2029 ($ million)
Chart on UAE - Year-over-year growth 2024-2029 (%)
Data Table on UAE - Year-over-year growth 2024-2029 (%)

12.6.3 South Africa - Market size and forecast 2024-2029

Chart on South Africa - Market size and forecast 2024-2029 ($ million)
Data Table on South Africa - Market size and forecast 2024-2029 ($ million)
Chart on South Africa - Year-over-year growth 2024-2029 (%)
Data Table on South Africa - Year-over-year growth 2024-2029 (%)

12.6.4 Israel - Market size and forecast 2024-2029

Chart on Israel - Market size and forecast 2024-2029 ($ million)
Data Table on Israel - Market size and forecast 2024-2029 ($ million)
Chart on Israel - Year-over-year growth 2024-2029 (%)
Data Table on Israel - Year-over-year growth 2024-2029 (%)

12.6.5 Turkey - Market size and forecast 2024-2029

Chart on Turkey - Market size and forecast 2024-2029 ($ million)
Data Table on Turkey - Market size and forecast 2024-2029 ($ million)
Chart on Turkey - Year-over-year growth 2024-2029 (%)
Data Table on Turkey - Year-over-year growth 2024-2029 (%)

12.7 South America - Market size and forecast 2024-2029

Chart on South America - Market size and forecast 2024-2029 ($ million)
Data Table on South America - Market size and forecast 2024-2029 ($ million)
Chart on South America - Year-over-year growth 2024-2029 (%)
Data Table on South America - Year-over-year growth 2024-2029 (%)
Chart on Regional Comparison - South America
Data Table on Regional Comparison - South America

12.7.1 Brazil - Market size and forecast 2024-2029

Chart on Brazil - Market size and forecast 2024-2029 ($ million)
Data Table on Brazil - Market size and forecast 2024-2029 ($ million)
Chart on Brazil - Year-over-year growth 2024-2029 (%)
Data Table on Brazil - Year-over-year growth 2024-2029 (%)

12.7.2 Argentina - Market size and forecast 2024-2029

Chart on Argentina - Market size and forecast 2024-2029 ($ million)
Data Table on Argentina - Market size and forecast 2024-2029 ($ million)
Chart on Argentina - Year-over-year growth 2024-2029 (%)
Data Table on Argentina - Year-over-year growth 2024-2029 (%)

12.7.3 Colombia - Market size and forecast 2024-2029

Chart on Colombia - Market size and forecast 2024-2029 ($ million)
Data Table on Colombia - Market size and forecast 2024-2029 ($ million)
Chart on Colombia - Year-over-year growth 2024-2029 (%)
Data Table on Colombia - Year-over-year growth 2024-2029 (%)

12.8 Market opportunity by geography

Market opportunity by geography ($ million)
Data Tables on Market opportunity by geography ($ million)

13. Drivers, Challenges, and Opportunity

13.1 Market drivers

Processing heavier crude slates
Regulatory and environmental compliance
Refinery modernization and digitalization

13.2 Market challenges

Capital intensity and budgetary constraints in volatile macroeconomic environment
Technological adaptation to heavier and more complex crude slates
Intensifying environmental regulations and water management imperatives

13.3 Impact of drivers and challenges

Impact of drivers and challenges in 2024 and 2029

13.4 Market opportunities

Digitalization and advanced process control
Integration of water treatment and sustainability solutions
Modular and compact system design

14. Competitive Landscape

14.1 Overview

14.2

Overview on criticality of inputs and factors of differentiation

14.3 Landscape disruption

Overview on factors of disruption

14.4 Industry risks

Impact of key risks on business

15. Competitive Analysis

15.1 Companies profiled

Companies covered

15.2 Company ranking index

15.3 Market positioning of companies

Matrix on companies position and classification

15.4 Alfa Laval AB

Alfa Laval AB - Overview
Alfa Laval AB - Business segments
Alfa Laval AB - Key news
Alfa Laval AB - Key offerings
Alfa Laval AB - Segment focus
SWOT

15.5 AMR Process Inc.

AMR Process Inc. - Overview
AMR Process Inc. - Product / Service
AMR Process Inc. - Key offerings
SWOT

15.6 Axens Group

Axens Group - Overview
Axens Group - Product / Service
Axens Group - Key offerings
SWOT

15.7 Baker Hughes Co.

Baker Hughes Co. - Overview
Baker Hughes Co. - Business segments
Baker Hughes Co. - Key news
Baker Hughes Co. - Key offerings
Baker Hughes Co. - Segment focus
SWOT

15.8 Canadian Petroleum Processing Equipment Inc.

Canadian Petroleum Processing Equipment Inc. - Overview
Canadian Petroleum Processing Equipment Inc. - Product / Service
Canadian Petroleum Processing Equipment Inc. - Key offerings
SWOT

15.9 Croda International Plc

Croda International Plc - Overview
Croda International Plc - Business segments
Croda International Plc - Key offerings
Croda International Plc - Segment focus
SWOT

15.10 Desalters LLC

Desalters LLC - Overview
Desalters LLC - Product / Service
Desalters LLC - Key offerings
SWOT

15.11 EN-FAB Inc

EN-FAB Inc - Overview
EN-FAB Inc - Product / Service
EN-FAB Inc - Key offerings
SWOT

15.12 Forum Energy Technologies Inc.

Forum Energy Technologies Inc. - Overview
Forum Energy Technologies Inc. - Business segments
Forum Energy Technologies Inc. - Key news
Forum Energy Technologies Inc. - Key offerings
Forum Energy Technologies Inc. - Segment focus
SWOT

15.13 Frames Energy Systems BV

Frames Energy Systems BV - Overview
Frames Energy Systems BV - Product / Service
Frames Energy Systems BV - Key offerings
SWOT

15.14 Mackenzie Hydrocarbons Australia Pty Ltd.

Mackenzie Hydrocarbons Australia Pty Ltd. - Overview
Mackenzie Hydrocarbons Australia Pty Ltd. - Product / Service
Mackenzie Hydrocarbons Australia Pty Ltd. - Key offerings
SWOT

15.15 McDermott International Ltd.

McDermott International Ltd. - Overview
McDermott International Ltd. - Product / Service
McDermott International Ltd. - Key offerings
SWOT

15.16 Petro Techna International

Petro Techna International - Overview
Petro Techna International - Product / Service
Petro Techna International - Key offerings
SWOT

15.17 Schlumberger Ltd.

Schlumberger Ltd. - Overview
Schlumberger Ltd. - Business segments
Schlumberger Ltd. - Key news
Schlumberger Ltd. - Key offerings
Schlumberger Ltd. - Segment focus
SWOT

15.18 TechnipFMC plc

TechnipFMC plc - Overview
TechnipFMC plc - Product / Service
TechnipFMC plc - Key offerings
SWOT

16. Appendix

16.1 Scope of the report

Market definition
Objectives
Notes and caveats

16.2 Inclusions and exclusions checklist

Inclusions checklist
Exclusions checklist

16.3 Currency conversion rates for US$

16.4 Research methodology

16.5 Data procurement

Information sources

16.6 Data validation

16.7 Validation techniques employed for market sizing

16.8 Data synthesis

16.9 360 degree market analysis

16.10 List of abbreviations

Research Methodology

Technavio presents a detailed picture of the market by way of study, synthesis, and summation of data from multiple sources. The analysts have presented the various facets of the market with a particular focus on identifying the key industry influencers. The data thus presented is comprehensive, reliable, and the result of extensive research, both primary and secondary.

INFORMATION SOURCES

Primary sources

  • Manufacturers and suppliers
  • Channel partners
  • Industry experts
  • Strategic decision makers

Secondary sources

  • Industry journals and periodicals
  • Government data
  • Financial reports of key industry players
  • Historical data
  • Press releases

DATA ANALYSIS

Data Synthesis

  • Collation of data
  • Estimation of key figures
  • Analysis of derived insights

Data Validation

  • Triangulation with data models
  • Reference against proprietary databases
  • Corroboration with industry experts

REPORT WRITING

Qualitative

  • Market drivers
  • Market challenges
  • Market trends
  • Five forces analysis

Quantitative

  • Market size and forecast
  • Market segmentation
  • Geographical insights
  • Competitive landscape

Interested in this report?

Get your sample now to see our research methodology and insights!

Download Now

Frequently Asked Questions

Crude Oil Desalter market growth will increase by USD 92.9 million during 2025-2029.

The Crude Oil Desalter market is expected to grow at a CAGR of 6.3% during 2025-2029.

Crude Oil Desalter market is segmented by Product (Multi-stage desalter, Single-stage desalter) Type (Electrostatic dehydrator, Desalting process) Application (Refineries, Oil and gas production, Petrochemical plants)

Agar Corp., Alfa Laval AB, AMR Process Inc., Axens Group, Baker Hughes Co., Canadian Petroleum Processing Equipment Inc., Croda International Plc, Desalters LLC, EN-FAB Inc, Forum Energy Technologies Inc., Frames Energy Systems BV, GEA Group AG, Komax Systems, Mackenzie Hydrocarbons Australia Pty Ltd., McDermott International Ltd., Petro Techna International, Schlumberger Ltd., TechnipFMC plc, Veolia Environment SA, VME Process Inc. are a few of the key vendors in the Crude Oil Desalter market.

APAC will register the highest growth rate of 34% among the other regions. Therefore, the Crude Oil Desalter market in APAC is expected to garner significant business opportunities for the vendors during the forecast period.

China, Japan, India, Australia, South Korea, Indonesia, US, Canada, Mexico, Russia, UK, France, Italy, The Netherlands, Spain, Saudi Arabia, UAE, South Africa, Israel, Turkey, Brazil, Argentina, Colombia

  • Processing heavier crude slates is the driving factor this market.

The Crude Oil Desalter market vendors should focus on grabbing business opportunities from the Product segment as it accounted for the largest market share in the base year.