Crushing Equipment Market Analysis APAC, North America, Europe, South America, Middle East and Africa - US, China, India, Japan, Germany, Brazil, Australia, UK, Canada, France - Size and Forecast 2025-2029

Crushing Equipment Market Analysis APAC, North America, Europe, South America, Middle East and Africa - US, China, India, Japan, Germany, Brazil, Australia, UK, Canada, France - Size and Forecast 2025-2029

Published: Mar 2025 235 Pages SKU: IRTNTR43947

Market Overview at a Glance

$1.29 B
Market Opportunity
3.8%
CAGR
3.6
YoY growth 2024-2025(%)

Crushing Equipment Market Size 2025-2029

The crushing equipment market size is forecast to increase by USD 1.29 billion at a CAGR of 3.8% between 2024 and 2029.

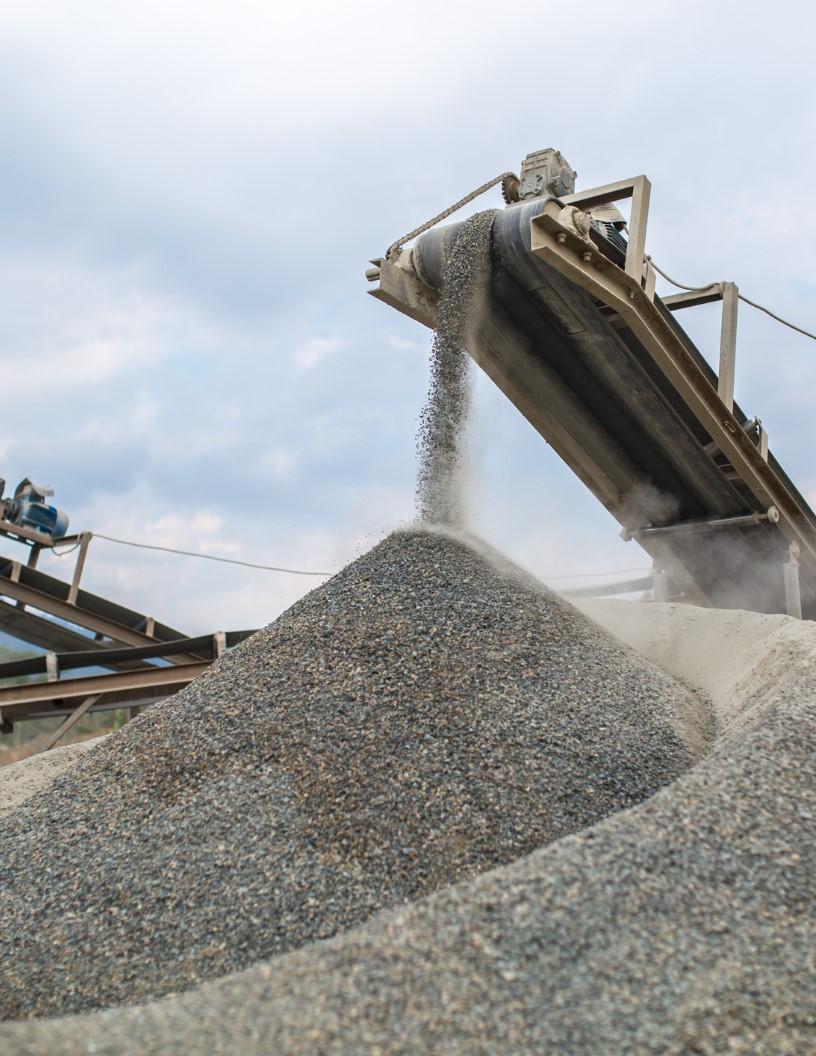
  • The market is experiencing significant growth, driven by the increasing demand for artificial sand in construction work. This trend is particularly prominent in regions with a high concentration of construction activities, such as Asia-Pacific. Another key driver is the preference for equipment with lower carbon emissions, as sustainability becomes a priority for many industries. However, the market is not without challenges. The uncertainty in the mining industry, due to regulatory changes and price volatility, poses a significant risk to market growth. Companies seeking to capitalize on market opportunities must stay informed of regulatory developments and invest in innovative technologies to reduce their carbon footprint.
  • Additionally, strategic partnerships and collaborations can help mitigate risks and expand market reach. Overall, the market presents both challenges and opportunities for investors and businesses alike. By staying informed of market trends and regulatory developments, companies can navigate these challenges effectively and capitalize on the growing demand for efficient and sustainable crushing solutions.

What will be the Size of the Crushing Equipment Market during the forecast period?

Crushing Equipment Market Size

 Request Free Sample

  • The soft rock crushing market encompasses various technologies and applications, including artificial intelligence and machine learning, which optimize energy consumption and improve process automation. The Internet of Things and closed-loop control systems enable real-time monitoring and analysis, enhancing material characterization and particle size distribution. Aggregate recycling and wear liners made of abrasive materials extend the life of crushing plants, reducing environmental impact and lowering costs. Metallurgical applications, such as diesel crushing and hydraulic crushing, play a crucial role in mineral processing and mining. Crushing design and quality control are essential for ensuring product quality and meeting customer demands.
  • Hard rock crushing, crushing simulation, and cone crushing technology are integral to the market's evolution. Electric crushing, asphalt recycling, rod mills, and water management are other key aspects, with a focus on sustainability and predictive maintenance. Jaw crushing technology and grinding media are essential components of size reduction processes. Carbon footprint reduction and life cycle assessment are essential considerations in the market, driving innovation and growth.

How is this Crushing Equipment Industry segmented?

The crushing equipment industry research report provides comprehensive data (region-wise segment analysis), with forecasts and estimates in "USD million" for the period 2025-2029, as well as historical data from 2019-2023 for the following segments.

  • Type
    • Jaw crushers
    • Roller crushers
    • Cone crushers
    • Others
  • End-user
    • Mining
    • Quarrying
    • Recycling
    • Construction and infrastructure
    • Others
  • Service
    • Stationary
    • Portable
    • Mobile
  • Geography
    • North America
      • US
      • Canada
    • Europe
      • France
      • Germany
      • UK
    • Middle East and Africa
      • APAC
        • Australia
        • China
        • India
        • Japan
      • South America
        • Brazil
      • Rest of World (ROW)

      By Type Insights

      The jaw crushers segment is estimated to witness significant growth during the forecast period.

      Jaw crushers, a crucial component in mining and construction industries, are known for their versatility in handling materials with varying hardness levels. These crushers, available in both stationary and portable versions, deliver crushing capacities that cater to diverse applications. In mining operations, jaw crushers reduce the size of copper and gold ores before they proceed to the crushing circuit. Emission reduction is a significant concern in mining, and jaw crushers contribute by ensuring minimal dust generation during the crushing process. Jaw crushers are integral to the mining and infrastructure sectors, with applications ranging from aggregate production and cement manufacturing to ore crushing.

      These crushers feature a reduction ratio of 3:1 to 5:1, enabling them to process dry to slightly wet materials. The jaw crusher design includes two vertical jaws: a fixed jaw and a swing jaw. The swing jaw moves back and forth relative to the fixed jaw, crushing the material between them. Material handling is an essential aspect of mining and quarry operations, and jaw crushers play a vital role in this process. Digital monitoring systems facilitate efficient remote control of these crushers, ensuring optimal performance. Impact crushers and cone crushers are alternative options for secondary and tertiary crushing, while gyratory crushers are suitable for large-scale primary crushing.

      Wear parts, such as jaw plates and liners, are essential components of jaw crushers, and their wear resistance is crucial for ensuring longevity and productivity. The mining industry's focus on sustainable practices extends to crushing, with energy efficiency and waste management being critical considerations. Particle size reduction is a primary objective of crushing, and jaw crushers deliver consistent product sizes that meet the requirements of downstream processes, such as grinding mills and screening equipment. In the context of mobile crushing, jaw crushers are increasingly popular due to their adaptability and ease of transportation. Crushed stone, produced through the crushing process, is a valuable resource in various industries, including construction and infrastructure.

      Feeding systems, such as vibrating feeders, ensure a consistent feed size to the jaw crusher, enhancing its overall performance.

      Crushing Equipment Market Size

      Get a glance at the market report of share of various segments Request Free Sample

      The Jaw crushers segment was valued at USD 2.29 billion in 2019 and showed a gradual increase during the forecast period.

      Regional Analysis

      APAC is estimated to contribute 43% to the growth of the global market during the forecast period.Technavio’s analysts have elaborately explained the regional trends and drivers that shape the market during the forecast period.

      Crushing Equipment Market Share by Geography

      For more insights on the market size of various regions, Request Free Sample

      The construction equipment market in Asia Pacific (APAC) is experiencing increased demand compared to Middle East and Africa, South America, and North America. This trend can be attributed to the numerous infrastructure projects underway in APAC, which require substantial amounts of sand and gravel. Crushing equipment, specifically, benefits from this market dynamic as it is integral to the production of crushed stone and aggregate for these projects. Indonesia and the Philippines are among the Southeast Asian countries spearheading infrastructure development, with plans to construct roads, airports, and railway lines from 2015 to 2025. This initiative is expected to fuel the demand for construction equipment, including crushing machinery.

      Crushing equipment, such as jaw crushers, impact crushers, gyratory crushers, and cone crushers, play a crucial role in the mining and quarrying industries. These machines are employed for various applications, including primary, secondary, and tertiary crushing, as well as for reducing the particle size of materials like copper ore, gold ore, iron ore, and waste management. The market for crushing equipment is also witnessing advancements in technology, with digital monitoring systems, remote control, and energy efficiency becoming increasingly important. Wear resistance and parts supply are also essential factors that influence the selection of crushing equipment. Crushing equipment is also used in industries like cement production and aggregate production, where it is employed for reducing the size of raw materials and enhancing overall production efficiency.

      The demand for crushing equipment is further driven by the need for sustainable crushing methods and the reduction of emissions in mining operations. In summary, the demand for crushing equipment in APAC is driven by the region's infrastructure development and the resulting demand for construction materials. The market is characterized by advancements in technology, energy efficiency, and a focus on sustainable crushing methods.

      Market Dynamics

      Our researchers analyzed the data with 2024 as the base year, along with the key drivers, trends, and challenges. A holistic analysis of drivers will help companies refine their marketing strategies to gain a competitive advantage.

      What are the key market drivers leading to the rise in the adoption of Crushing Equipment Industry?

      • Use of artificial sand for construction work is the key driver of the market. 

      • The construction industry relies on river sand as a crucial ingredient for various applications, including cement, brick, asphalt, and concrete. River sand provides essential properties such as strength, bulk, and adhesiveness. However, the extraction of river sand for commercial purposes has raised concerns due to its negative environmental impact. Since 2010, several regional governments and countries, including Cambodia and India, have imposed export bans on river sand. The primary reasons are the erosion of river banks and the adverse effect on biodiversity. Moreover, the depletion of river sand resources due to extensive mining is a significant concern. Additionally, the transportation of river sand from river banks to construction sites adds to the project's overall cost due to its location being mostly away from these sites.
      • These factors have led to the exploration of alternative sand sources, such as manufactured sand and recycled sand, to mitigate the environmental and logistical challenges associated with river sand mining.

      What are the market trends shaping the Crushing Equipment Industry?

      • Demand for crushing equipment with less carbon emissions is the upcoming market trend. 

      • Construction equipment contributes significantly to the emission of harmful pollutants such as hydrocarbons (HC), nitrogen oxides (NOx), carbon monoxide (CO), and particulate matter (PM), surpassing the levels emitted by highway vehicles. This issue has led various countries' pollution control boards and environmental agencies to establish stringent emission norms for construction equipment. The US and the EU have set the most rigorous standards, with plans to impose further regulations to minimize emissions. Developing nations are also striving to adopt these emission standards, with the ultimate goal of rendering construction equipment's emission levels obsolete.
      • The emission of substantial pollutants not only harms the environment but also increases fuel consumption. As a professional assistant, it's essential to emphasize the importance of adhering to these regulations to reduce the environmental impact and promote sustainability in the construction sector.

      What challenges does the Crushing Equipment Industry face during its growth?

      • Uncertainty in mining industry is a key challenge affecting the industry growth. 

      • The mining industry has experienced a significant downturn due to the decline in commodity prices since 2011. Coal, aluminum, copper, and iron ore have all seen a decrease in prices, leading to a revenue slump for mining companies. This uncertainty has resulted in reduced demand for metals and minerals. Furthermore, the COVID-19 pandemic exacerbated the situation, causing a considerable decrease in demand and subsequent price drops.
      • Despite these challenges, operational costs, including labor, energy, and equipment, have remained constant or increased. Consequently, major mining corporations have shifted their focus towards expanding existing projects instead of investing in new ones. This trend is expected to continue until commodity prices recover.

      Exclusive Customer Landscape

      The crushing equipment market forecasting report includes the adoption lifecycle of the market, covering from the innovator’s stage to the laggard’s stage. It focuses on adoption rates in different regions based on penetration. Furthermore, the crushing equipment market report also includes key purchase criteria and drivers of price sensitivity to help companies evaluate and develop their market growth analysis strategies.

      Crushing Equipment Market Share by Geography

       Customer Landscape

      Key Companies & Market Insights

      Companies are implementing various strategies, such as strategic alliances, crushing equipment market forecast, partnerships, mergers and acquisitions, geographical expansion, and product/service launches, to enhance their presence in the industry.

      Astec Industries Inc. - The company specializes in providing crushing solutions through equipment offerings, including a Jaw crusher and a Cone crusher. These machines are integral components in processing various materials, delivering efficient and productive results. The Jaw crusher is renowned for its robust design and high capacity, making it a preferred choice for primary crushing applications. The Cone crusher, on the other hand, is known for its versatility and ability to produce a consistent output, making it an excellent selection for secondary and tertiary crushing stages. With a commitment to innovation and quality, the company's crushing equipment is designed to meet the evolving needs of diverse industries.

      The industry research and growth report includes detailed analyses of the competitive landscape of the market and information about key companies, including:

      • Astec Industries Inc.
      • Caterpillar Inc.
      • Deere and Co.
      • Eagle Crusher Co. Inc.
      • FLSmidth and Co. AS
      • IROCK Crushers
      • Komatsu Ltd.
      • McLanahan Corp.
      • Metso Outotec Corp.
      • Minyu Machinery Corp.
      • Mormak Equipment Inc.
      • R.R. EQUIPMENT Co.
      • Rock Engineered Machinery Co. Inc.
      • Sandvik AB
      • SCREEN MACHINE INDUSTRIES LLC
      • Shibang Industry and Technology Group Co. Ltd.
      • Terex Corp.
      • The Weir Group Plc
      • thyssenkrupp AG
      • Zhengzhou YiFan Machinery Co. Ltd.

      Qualitative and quantitative analysis of companies has been conducted to help clients understand the wider business environment as well as the strengths and weaknesses of key industry players. Data is qualitatively analyzed to categorize companies as pure play, category-focused, industry-focused, and diversified; it is quantitatively analyzed to categorize companies as dominant, leading, strong, tentative, and weak.

      Research Analyst Overview

      The market encompasses a range of machines designed to reduce the size of raw materials, such as jaw crushers, portable crushing units, gyratory crushers, cone crushers, impact crushers, roll crushers, hammer mills, and grinding mills. These machines play a crucial role in various industries, including mining operations, waste management, and aggregate production. Crushing capacity is a significant factor in the selection of crushing equipment. The ability to process large volumes of material efficiently is essential for optimizing mining operations and reducing downtime. Copper ore, gold ore, iron ore, and other mineral resources require crushing to prepare them for further processing.

      Emission reduction is a growing concern in the crushing industry, as mining and quarrying operations strive to minimize their environmental footprint. Energy efficiency, wear resistance, and sustainable crushing practices are key areas of focus. Stationary crushing systems and digital monitoring systems help improve energy efficiency and reduce wear on parts. Material handling and feeding systems are essential components of a crushing circuit. Remote control and automation technologies enable efficient and safe material handling, while reducing the need for manual labor. Crushing equipment manufacturers continually innovate to improve design and functionality. Primary and secondary crushing stages are essential for reducing the size of raw materials, while tertiary crushing stages are used to achieve the desired product size.

      Reduction ratio and particle size are critical factors in the design of crushing equipment. Wear parts, such as hammers, liners, and screens, are essential components of crushing equipment. Wear resistance and parts supply are crucial considerations for maintaining optimal performance and minimizing downtime. Crushing equipment is used in various applications, including quarry operations, cement production, and waste management. The versatility of these machines allows them to be used in a wide range of industries and applications. The market for crushing equipment is dynamic, with ongoing advancements in technology and design. Energy efficiency, digital monitoring, and remote control are key trends driving innovation in the market.

      The ability to produce high-quality crushed materials at optimal efficiency and with minimal environmental impact is a critical factor in the success of crushing equipment manufacturers.

      Market Scope

      Report Coverage

      Details

      Page number

      235

      Base year

      2024

      Historic period

      2019-2023

      Forecast period

      2025-2029

      Growth momentum & CAGR

      Accelerate at a CAGR of 3.8%

      Market growth 2025-2029

      USD 1286 million

      Market structure

      Fragmented

      YoY growth 2024-2025(%)

      3.6

      Key countries

      US, China, India, Japan, Germany, Brazil, Australia, UK, Canada, and France

      Competitive landscape

      Leading Companies, Market Positioning of Companies, Competitive Strategies, and Industry Risks

      Request Free Sample

      What are the Key Data Covered in this Crushing Equipment Market Research and Growth Report?

      • CAGR of the Crushing Equipment industry during the forecast period
      • Detailed information on factors that will drive the growth and forecasting between 2025 and 2029
      • Precise estimation of the size of the market and its contribution of the industry in focus to the parent market
      • Accurate predictions about upcoming growth and trends and changes in consumer behaviour
      • Growth of the market across APAC, North America, Europe, South America, and Middle East and Africa
      • Thorough analysis of the market’s competitive landscape and detailed information about companies
      • Comprehensive analysis of factors that will challenge the crushing equipment market growth of industry companies

      We can help! Our analysts can customize this crushing equipment market research report to meet your requirements.

      Get in touch


      1 Executive Summary

      • 1.1 Market overview
        • Executive Summary - Chart on Market Overview
        • Executive Summary - Data Table on Market Overview
        • Executive Summary - Chart on Global Market Characteristics
        • Executive Summary - Chart on Market by Geography
        • Executive Summary - Chart on Market Segmentation by Type
        • Executive Summary - Chart on Market Segmentation by End-user
        • Executive Summary - Chart on Market Segmentation by Service
        • Executive Summary - Chart on Incremental Growth
        • Executive Summary - Data Table on Incremental Growth
        • Executive Summary - Chart on Company Market Positioning

      2 Technavio Analysis

      • 2.1 Analysis of price sensitivity, lifecycle, customer purchase basket, adoption rates, and purchase criteria
        • Analysis of price sensitivity, lifecycle, customer purchase basket, adoption rates, and purchase criteria
      • 2.2 Criticality of inputs and Factors of differentiation
        • Overview on criticality of inputs and factors of differentiation
      • 2.3 Factors of disruption
        • Overview on factors of disruption
      • 2.4 Impact of drivers and challenges
        • Impact of drivers and challenges in 2024 and 2029

      3 Market Landscape

      • 3.1 Market ecosystem
        • Parent Market
        • Data Table on - Parent Market
      • 3.2 Market characteristics
        • Market characteristics analysis
      • 3.3 Value chain analysis
        • Value chain analysis

      4 Market Sizing

      • 4.1 Market definition
        • Offerings of companies included in the market definition
      • 4.2 Market segment analysis
        • Market segments
      • 4.3 Market size 2024
        • 4.4 Market outlook: Forecast for 2024-2029
          • Chart on Global - Market size and forecast 2024-2029 ($ million)
          • Data Table on Global - Market size and forecast 2024-2029 ($ million)
          • Chart on Global Market: Year-over-year growth 2024-2029 (%)
          • Data Table on Global Market: Year-over-year growth 2024-2029 (%)

        5 Historic Market Size

        • 5.1 Global Crushing Equipment Market 2019 - 2023
          • Historic Market Size - Data Table on Global Crushing Equipment Market 2019 - 2023 ($ million)
        • 5.2 Type segment analysis 2019 - 2023
          • Historic Market Size - Type Segment 2019 - 2023 ($ million)
        • 5.3 End-user segment analysis 2019 - 2023
          • Historic Market Size - End-user Segment 2019 - 2023 ($ million)
        • 5.4 Service segment analysis 2019 - 2023
          • Historic Market Size - Service Segment 2019 - 2023 ($ million)
        • 5.5 Geography segment analysis 2019 - 2023
          • Historic Market Size - Geography Segment 2019 - 2023 ($ million)
        • 5.6 Country segment analysis 2019 - 2023
          • Historic Market Size - Country Segment 2019 - 2023 ($ million)

        6 Qualitative Analysis

        • 6.1 Impact of AI on the Global Crushing Equipment Market

          7 Five Forces Analysis

          • 7.1 Five forces summary
            • Five forces analysis - Comparison between 2024 and 2029
          • 7.2 Bargaining power of buyers
            • Bargaining power of buyers - Impact of key factors 2024 and 2029
          • 7.3 Bargaining power of suppliers
            • Bargaining power of suppliers - Impact of key factors in 2024 and 2029
          • 7.4 Threat of new entrants
            • Threat of new entrants - Impact of key factors in 2024 and 2029
          • 7.5 Threat of substitutes
            • Threat of substitutes - Impact of key factors in 2024 and 2029
          • 7.6 Threat of rivalry
            • Threat of rivalry - Impact of key factors in 2024 and 2029
          • 7.7 Market condition
            • Chart on Market condition - Five forces 2024 and 2029

          8 Market Segmentation by Type

          • 8.1 Market segments
            • Chart on Type - Market share 2024-2029 (%)
            • Data Table on Type - Market share 2024-2029 (%)
          • 8.2 Comparison by Type
            • Chart on Comparison by Type
            • Data Table on Comparison by Type
          • 8.3 Jaw crushers - Market size and forecast 2024-2029
            • Chart on Jaw crushers - Market size and forecast 2024-2029 ($ million)
            • Data Table on Jaw crushers - Market size and forecast 2024-2029 ($ million)
            • Chart on Jaw crushers - Year-over-year growth 2024-2029 (%)
            • Data Table on Jaw crushers - Year-over-year growth 2024-2029 (%)
          • 8.4 Roller crushers - Market size and forecast 2024-2029
            • Chart on Roller crushers - Market size and forecast 2024-2029 ($ million)
            • Data Table on Roller crushers - Market size and forecast 2024-2029 ($ million)
            • Chart on Roller crushers - Year-over-year growth 2024-2029 (%)
            • Data Table on Roller crushers - Year-over-year growth 2024-2029 (%)
          • 8.5 Cone crushers - Market size and forecast 2024-2029
            • Chart on Cone crushers - Market size and forecast 2024-2029 ($ million)
            • Data Table on Cone crushers - Market size and forecast 2024-2029 ($ million)
            • Chart on Cone crushers - Year-over-year growth 2024-2029 (%)
            • Data Table on Cone crushers - Year-over-year growth 2024-2029 (%)
          • 8.6 Others - Market size and forecast 2024-2029
            • Chart on Others - Market size and forecast 2024-2029 ($ million)
            • Data Table on Others - Market size and forecast 2024-2029 ($ million)
            • Chart on Others - Year-over-year growth 2024-2029 (%)
            • Data Table on Others - Year-over-year growth 2024-2029 (%)
          • 8.7 Market opportunity by Type
            • Market opportunity by Type ($ million)
            • Data Table on Market opportunity by Type ($ million)

          9 Market Segmentation by End-user

          • 9.1 Market segments
            • Chart on End-user - Market share 2024-2029 (%)
            • Data Table on End-user - Market share 2024-2029 (%)
          • 9.2 Comparison by End-user
            • Chart on Comparison by End-user
            • Data Table on Comparison by End-user
          • 9.3 Mining - Market size and forecast 2024-2029
            • Chart on Mining - Market size and forecast 2024-2029 ($ million)
            • Data Table on Mining - Market size and forecast 2024-2029 ($ million)
            • Chart on Mining - Year-over-year growth 2024-2029 (%)
            • Data Table on Mining - Year-over-year growth 2024-2029 (%)
          • 9.4 Quarrying - Market size and forecast 2024-2029
            • Chart on Quarrying - Market size and forecast 2024-2029 ($ million)
            • Data Table on Quarrying - Market size and forecast 2024-2029 ($ million)
            • Chart on Quarrying - Year-over-year growth 2024-2029 (%)
            • Data Table on Quarrying - Year-over-year growth 2024-2029 (%)
          • 9.5 Recycling - Market size and forecast 2024-2029
            • Chart on Recycling - Market size and forecast 2024-2029 ($ million)
            • Data Table on Recycling - Market size and forecast 2024-2029 ($ million)
            • Chart on Recycling - Year-over-year growth 2024-2029 (%)
            • Data Table on Recycling - Year-over-year growth 2024-2029 (%)
          • 9.6 Construction and infrastructure - Market size and forecast 2024-2029
            • Chart on Construction and infrastructure - Market size and forecast 2024-2029 ($ million)
            • Data Table on Construction and infrastructure - Market size and forecast 2024-2029 ($ million)
            • Chart on Construction and infrastructure - Year-over-year growth 2024-2029 (%)
            • Data Table on Construction and infrastructure - Year-over-year growth 2024-2029 (%)
          • 9.7 Others - Market size and forecast 2024-2029
            • Chart on Others - Market size and forecast 2024-2029 ($ million)
            • Data Table on Others - Market size and forecast 2024-2029 ($ million)
            • Chart on Others - Year-over-year growth 2024-2029 (%)
            • Data Table on Others - Year-over-year growth 2024-2029 (%)
          • 9.8 Market opportunity by End-user
            • Market opportunity by End-user ($ million)
            • Data Table on Market opportunity by End-user ($ million)

          10 Market Segmentation by Service

          • 10.1 Market segments
            • Chart on Service - Market share 2024-2029 (%)
            • Data Table on Service - Market share 2024-2029 (%)
          • 10.2 Comparison by Service
            • Chart on Comparison by Service
            • Data Table on Comparison by Service
          • 10.3 Stationary - Market size and forecast 2024-2029
            • Chart on Stationary - Market size and forecast 2024-2029 ($ million)
            • Data Table on Stationary - Market size and forecast 2024-2029 ($ million)
            • Chart on Stationary - Year-over-year growth 2024-2029 (%)
            • Data Table on Stationary - Year-over-year growth 2024-2029 (%)
          • 10.4 Portable - Market size and forecast 2024-2029
            • Chart on Portable - Market size and forecast 2024-2029 ($ million)
            • Data Table on Portable - Market size and forecast 2024-2029 ($ million)
            • Chart on Portable - Year-over-year growth 2024-2029 (%)
            • Data Table on Portable - Year-over-year growth 2024-2029 (%)
          • 10.5 Mobile - Market size and forecast 2024-2029
            • Chart on Mobile - Market size and forecast 2024-2029 ($ million)
            • Data Table on Mobile - Market size and forecast 2024-2029 ($ million)
            • Chart on Mobile - Year-over-year growth 2024-2029 (%)
            • Data Table on Mobile - Year-over-year growth 2024-2029 (%)
          • 10.6 Market opportunity by Service
            • Market opportunity by Service ($ million)
            • Data Table on Market opportunity by Service ($ million)

          11 Customer Landscape

          • 11.1 Customer landscape overview
            • Analysis of price sensitivity, lifecycle, customer purchase basket, adoption rates, and purchase criteria

          12 Geographic Landscape

          • 12.1 Geographic segmentation
            • Chart on Market share by geography 2024-2029 (%)
            • Data Table on Market share by geography 2024-2029 (%)
          • 12.2 Geographic comparison
            • Chart on Geographic comparison
            • Data Table on Geographic comparison
          • 12.3 APAC - Market size and forecast 2024-2029
            • Chart on APAC - Market size and forecast 2024-2029 ($ million)
            • Data Table on APAC - Market size and forecast 2024-2029 ($ million)
            • Chart on APAC - Year-over-year growth 2024-2029 (%)
            • Data Table on APAC - Year-over-year growth 2024-2029 (%)
          • 12.4 North America - Market size and forecast 2024-2029
            • Chart on North America - Market size and forecast 2024-2029 ($ million)
            • Data Table on North America - Market size and forecast 2024-2029 ($ million)
            • Chart on North America - Year-over-year growth 2024-2029 (%)
            • Data Table on North America - Year-over-year growth 2024-2029 (%)
          • 12.5 Europe - Market size and forecast 2024-2029
            • Chart on Europe - Market size and forecast 2024-2029 ($ million)
            • Data Table on Europe - Market size and forecast 2024-2029 ($ million)
            • Chart on Europe - Year-over-year growth 2024-2029 (%)
            • Data Table on Europe - Year-over-year growth 2024-2029 (%)
          • 12.6 South America - Market size and forecast 2024-2029
            • Chart on South America - Market size and forecast 2024-2029 ($ million)
            • Data Table on South America - Market size and forecast 2024-2029 ($ million)
            • Chart on South America - Year-over-year growth 2024-2029 (%)
            • Data Table on South America - Year-over-year growth 2024-2029 (%)
          • 12.7 Middle East and Africa - Market size and forecast 2024-2029
            • Chart on Middle East and Africa - Market size and forecast 2024-2029 ($ million)
            • Data Table on Middle East and Africa - Market size and forecast 2024-2029 ($ million)
            • Chart on Middle East and Africa - Year-over-year growth 2024-2029 (%)
            • Data Table on Middle East and Africa - Year-over-year growth 2024-2029 (%)
          • 12.8 US - Market size and forecast 2024-2029
            • Chart on US - Market size and forecast 2024-2029 ($ million)
            • Data Table on US - Market size and forecast 2024-2029 ($ million)
            • Chart on US - Year-over-year growth 2024-2029 (%)
            • Data Table on US - Year-over-year growth 2024-2029 (%)
          • 12.9 China - Market size and forecast 2024-2029
            • Chart on China - Market size and forecast 2024-2029 ($ million)
            • Data Table on China - Market size and forecast 2024-2029 ($ million)
            • Chart on China - Year-over-year growth 2024-2029 (%)
            • Data Table on China - Year-over-year growth 2024-2029 (%)
          • 12.10 India - Market size and forecast 2024-2029
            • Chart on India - Market size and forecast 2024-2029 ($ million)
            • Data Table on India - Market size and forecast 2024-2029 ($ million)
            • Chart on India - Year-over-year growth 2024-2029 (%)
            • Data Table on India - Year-over-year growth 2024-2029 (%)
          • 12.11 Japan - Market size and forecast 2024-2029
            • Chart on Japan - Market size and forecast 2024-2029 ($ million)
            • Data Table on Japan - Market size and forecast 2024-2029 ($ million)
            • Chart on Japan - Year-over-year growth 2024-2029 (%)
            • Data Table on Japan - Year-over-year growth 2024-2029 (%)
          • 12.12 Germany - Market size and forecast 2024-2029
            • Chart on Germany - Market size and forecast 2024-2029 ($ million)
            • Data Table on Germany - Market size and forecast 2024-2029 ($ million)
            • Chart on Germany - Year-over-year growth 2024-2029 (%)
            • Data Table on Germany - Year-over-year growth 2024-2029 (%)
          • 12.13 Brazil - Market size and forecast 2024-2029
            • Chart on Brazil - Market size and forecast 2024-2029 ($ million)
            • Data Table on Brazil - Market size and forecast 2024-2029 ($ million)
            • Chart on Brazil - Year-over-year growth 2024-2029 (%)
            • Data Table on Brazil - Year-over-year growth 2024-2029 (%)
          • 12.14 Australia - Market size and forecast 2024-2029
            • Chart on Australia - Market size and forecast 2024-2029 ($ million)
            • Data Table on Australia - Market size and forecast 2024-2029 ($ million)
            • Chart on Australia - Year-over-year growth 2024-2029 (%)
            • Data Table on Australia - Year-over-year growth 2024-2029 (%)
          • 12.15 UK - Market size and forecast 2024-2029
            • Chart on UK - Market size and forecast 2024-2029 ($ million)
            • Data Table on UK - Market size and forecast 2024-2029 ($ million)
            • Chart on UK - Year-over-year growth 2024-2029 (%)
            • Data Table on UK - Year-over-year growth 2024-2029 (%)
          • 12.16 Canada - Market size and forecast 2024-2029
            • Chart on Canada - Market size and forecast 2024-2029 ($ million)
            • Data Table on Canada - Market size and forecast 2024-2029 ($ million)
            • Chart on Canada - Year-over-year growth 2024-2029 (%)
            • Data Table on Canada - Year-over-year growth 2024-2029 (%)
          • 12.17 France - Market size and forecast 2024-2029
            • Chart on France - Market size and forecast 2024-2029 ($ million)
            • Data Table on France - Market size and forecast 2024-2029 ($ million)
            • Chart on France - Year-over-year growth 2024-2029 (%)
            • Data Table on France - Year-over-year growth 2024-2029 (%)
          • 12.18 Market opportunity by geography
            • Market opportunity by geography ($ million)
            • Data Tables on Market opportunity by geography ($ million)

          13 Drivers, Challenges, and Opportunity/Restraints

          • 13.1 Market drivers
            • 13.2 Market challenges
              • 13.3 Impact of drivers and challenges
                • Impact of drivers and challenges in 2024 and 2029
              • 13.4 Market opportunities/restraints

                14 Competitive Landscape

                • 14.1 Overview
                  • 14.2 Competitive Landscape
                    • Overview on criticality of inputs and factors of differentiation
                  • 14.3 Landscape disruption
                    • Overview on factors of disruption
                  • 14.4 Industry risks
                    • Impact of key risks on business

                  15 Competitive Analysis

                  • 15.1 Companies profiled
                    • Companies covered
                  • 15.2 Company ranking index
                    • Company ranking index
                  • 15.3 Market positioning of companies
                    • Matrix on companies position and classification
                  • 15.4 Astec Industries Inc.
                    • Astec Industries Inc. - Overview
                    • Astec Industries Inc. - Business segments
                    • Astec Industries Inc. - Key news
                    • Astec Industries Inc. - Key offerings
                    • Astec Industries Inc. - Segment focus
                    • SWOT
                  • 15.5 Deere and Co.
                    • Deere and Co. - Overview
                    • Deere and Co. - Business segments
                    • Deere and Co. - Key news
                    • Deere and Co. - Key offerings
                    • Deere and Co. - Segment focus
                    • SWOT
                  • 15.6 Eagle Crusher Co. Inc.
                    • Eagle Crusher Co. Inc. - Overview
                    • Eagle Crusher Co. Inc. - Product / Service
                    • Eagle Crusher Co. Inc. - Key offerings
                    • SWOT
                  • 15.7 FLSmidth and Co. AS
                    • FLSmidth and Co. AS - Overview
                    • FLSmidth and Co. AS - Business segments
                    • FLSmidth and Co. AS - Key news
                    • FLSmidth and Co. AS - Key offerings
                    • FLSmidth and Co. AS - Segment focus
                    • SWOT
                  • 15.8 IROCK Crushers
                    • IROCK Crushers - Overview
                    • IROCK Crushers - Product / Service
                    • IROCK Crushers - Key offerings
                    • SWOT
                  • 15.9 Komatsu Ltd.
                    • Komatsu Ltd. - Overview
                    • Komatsu Ltd. - Business segments
                    • Komatsu Ltd. - Key news
                    • Komatsu Ltd. - Key offerings
                    • Komatsu Ltd. - Segment focus
                    • SWOT
                  • 15.10 McLanahan Corp.
                    • McLanahan Corp. - Overview
                    • McLanahan Corp. - Product / Service
                    • McLanahan Corp. - Key offerings
                    • SWOT
                  • 15.11 Metso Outotec Corp.
                    • Metso Outotec Corp. - Overview
                    • Metso Outotec Corp. - Business segments
                    • Metso Outotec Corp. - Key news
                    • Metso Outotec Corp. - Key offerings
                    • Metso Outotec Corp. - Segment focus
                    • SWOT
                  • 15.12 Minyu Machinery Corp.
                    • Minyu Machinery Corp. - Overview
                    • Minyu Machinery Corp. - Product / Service
                    • Minyu Machinery Corp. - Key offerings
                    • SWOT
                  • 15.13 Mormak Equipment Inc.
                    • Mormak Equipment Inc. - Overview
                    • Mormak Equipment Inc. - Product / Service
                    • Mormak Equipment Inc. - Key offerings
                    • SWOT
                  • 15.14 Sandvik AB
                    • Sandvik AB - Overview
                    • Sandvik AB - Business segments
                    • Sandvik AB - Key news
                    • Sandvik AB - Key offerings
                    • Sandvik AB - Segment focus
                    • SWOT
                  • 15.15 Shibang Industry and Technology Group Co. Ltd.
                    • Shibang Industry and Technology Group Co. Ltd. - Overview
                    • Shibang Industry and Technology Group Co. Ltd. - Product / Service
                    • Shibang Industry and Technology Group Co. Ltd. - Key offerings
                    • SWOT
                  • 15.16 Terex Corp.
                    • Terex Corp. - Overview
                    • Terex Corp. - Business segments
                    • Terex Corp. - Key news
                    • Terex Corp. - Key offerings
                    • Terex Corp. - Segment focus
                    • SWOT
                  • 15.17 The Weir Group Plc
                    • The Weir Group Plc - Overview
                    • The Weir Group Plc - Business segments
                    • The Weir Group Plc - Key news
                    • The Weir Group Plc - Key offerings
                    • The Weir Group Plc - Segment focus
                    • SWOT
                  • 15.18 thyssenkrupp AG
                    • thyssenkrupp AG - Overview
                    • thyssenkrupp AG - Business segments
                    • thyssenkrupp AG - Key news
                    • thyssenkrupp AG - Key offerings
                    • thyssenkrupp AG - Segment focus
                    • SWOT

                  16 Appendix

                  • 16.1 Scope of the report
                    • 16.2 Inclusions and exclusions checklist
                      • Inclusions checklist
                      • Exclusions checklist
                    • 16.3 Currency conversion rates for US$
                      • Currency conversion rates for US$
                    • 16.4 Research methodology
                      • Research methodology
                    • 16.5 Data procurement
                      • Information sources
                    • 16.6 Data validation
                      • Data validation
                    • 16.7 Validation techniques employed for market sizing
                      • Validation techniques employed for market sizing
                    • 16.8 Data synthesis
                      • Data synthesis
                    • 16.9 360 degree market analysis
                      • 360 degree market analysis
                    • 16.10 List of abbreviations
                      • List of abbreviations

                    Research Methodology

                    Technavio presents a detailed picture of the market by way of study, synthesis, and summation of data from multiple sources. The analysts have presented the various facets of the market with a particular focus on identifying the key industry influencers. The data thus presented is comprehensive, reliable, and the result of extensive research, both primary and secondary.

                    INFORMATION SOURCES

                    Primary sources

                    • Manufacturers and suppliers
                    • Channel partners
                    • Industry experts
                    • Strategic decision makers

                    Secondary sources

                    • Industry journals and periodicals
                    • Government data
                    • Financial reports of key industry players
                    • Historical data
                    • Press releases

                    DATA ANALYSIS

                    Data Synthesis

                    • Collation of data
                    • Estimation of key figures
                    • Analysis of derived insights

                    Data Validation

                    • Triangulation with data models
                    • Reference against proprietary databases
                    • Corroboration with industry experts

                    REPORT WRITING

                    Qualitative

                    • Market drivers
                    • Market challenges
                    • Market trends
                    • Five forces analysis

                    Quantitative

                    • Market size and forecast
                    • Market segmentation
                    • Geographical insights
                    • Competitive landscape

                    Interested in this report?

                    Get your sample now to see our research methodology and insights!

                    Download Now

                    Frequently Asked Questions

                    Crushing Equipment market growth will increase by $ 1286 mn during 2025-2029.

                    The Crushing Equipment market is expected to grow at a CAGR of 3.8% during 2025-2029.

                    Crushing Equipment market is segmented by Type( Jaw crushers, Roller crushers, Cone crushers, Others) End-user( Mining, Quarrying, Recycling, Construction and infrastructure, Others) Service( Stationary, Portable, Mobile, South America, Middle East and Africa)

                    Astec Industries Inc., Caterpillar Inc., Deere and Co., Eagle Crusher Co. Inc., FLSmidth and Co. AS, IROCK Crushers, Komatsu Ltd., McLanahan Corp., Metso Outotec Corp., Minyu Machinery Corp., Mormak Equipment Inc., R.R. EQUIPMENT Co., Rock Engineered Machinery Co. Inc., Sandvik AB, SCREEN MACHINE INDUSTRIES LLC, Shibang Industry and Technology Group Co. Ltd., Terex Corp., The Weir Group Plc, thyssenkrupp AG, Zhengzhou YiFan Machinery Co. Ltd. are a few of the key vendors in the Crushing Equipment market.

                    APAC will register the highest growth rate of 43% among the other regions. Therefore, the Crushing Equipment market in APAC is expected to garner significant business opportunities for the vendors during the forecast period.

                    US, China, India, Japan, Germany, Brazil, Australia, UK, Canada, France

                    • Use of artificial sand for construction workConstruction and infrastructure projects make use of river sand. River sand provides strength is the driving factor this market.
                    • bulk is the driving factor this market.
                    • and adhesive properties to construction materials is the driving factor this market.
                    • such as cement is the driving factor this market.
                    • brick is the driving factor this market.
                    • asphalt is the driving factor this market.
                    • and concrete. It is also used for landscaping projects. However is the driving factor this market.
                    • since 2010 is the driving factor this market.
                    • many regional governments and countries is the driving factor this market.
                    • such as Cambodia and India is the driving factor this market.
                    • have banned the export of river sand. This is because sand mining results in the erosion of river banks and negatively impacts biodiversity. Also is the driving factor this market.
                    • river sand is exhausting rapidly because of extensive mining. In addition is the driving factor this market.
                    • most infrastructure and construction projects are situated away from river banks. The transportation of river sand from river banks to construction sites proves to be difficult and adds to the overall cost of the project. Hence is the driving factor this market.
                    • construction project owners opt for better alternatives to river sand. The artificial sand produced by the crushing equipment is one of the best substitutes for river sand. Artificial sand is produced by crushing basalt or granite rock through a 3-stage crushing process. It is expected that in the near future is the driving factor this market.
                    • most countries will ban the use of natural river sand is the driving factor this market.
                    • which is the driving factor this market.
                    • in turn is the driving factor this market.
                    • will positively impact the use of artificial sand. Government regulations is the driving factor this market.
                    • increasing prices is the driving factor this market.
                    • and less availability drive the demand for artificial sand by construction project owners. The number of construction projects is expected to increase is the driving factor this market.
                    • which will drive the demand for artificial sand during the forecast period. Such factors will drive the growth of the global crushing equipment market during the forecast period. is the driving factor this market.

                    The Crushing Equipment market vendors should focus on grabbing business opportunities from the Jaw crushers segment as it accounted for the largest market share in the base year.