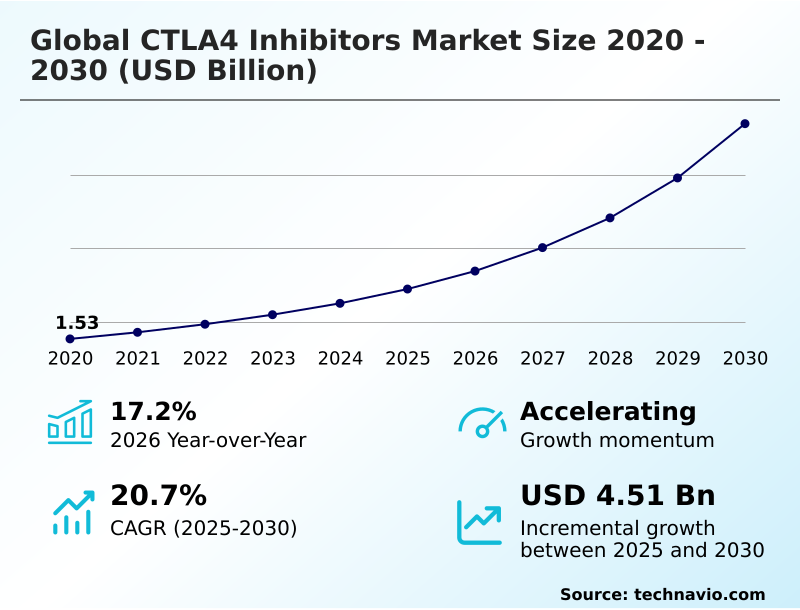
CTLA4 Inhibitors Market Size 2026-2030
The ctla4 inhibitors market size is valued to increase by USD 4.51 billion, at a CAGR of 20.7% from 2025 to 2030. Inclusion of combination immunotherapy and synergistic checkpoint blockade will drive the ctla4 inhibitors market.
Major Market Trends & Insights
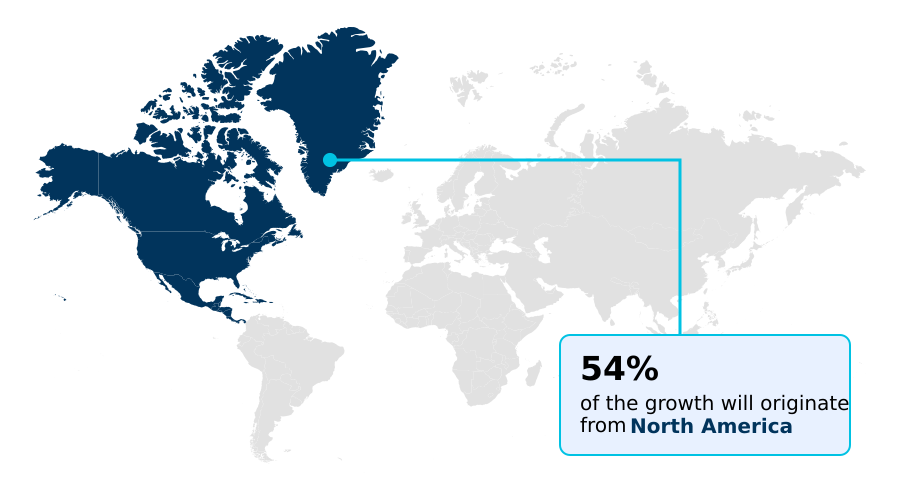
- North America dominated the market and accounted for a 54.2% growth during the forecast period.
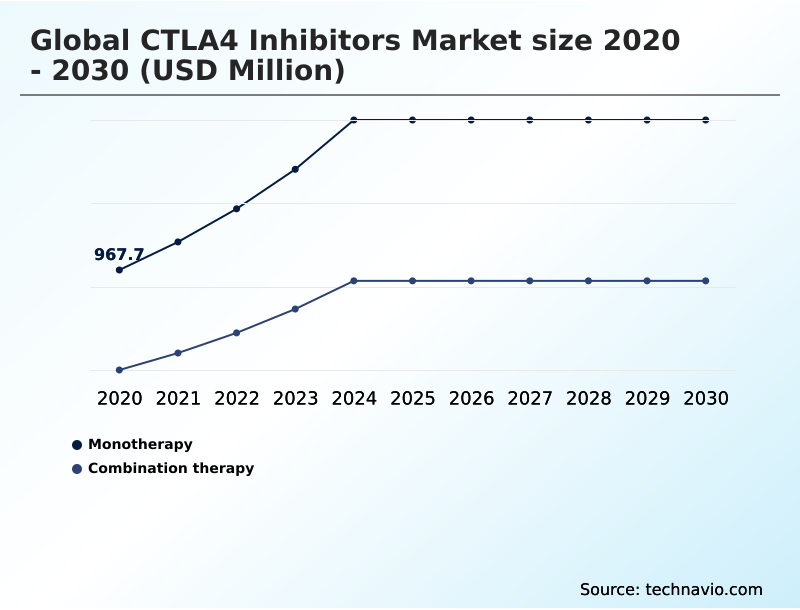
- By Type - Monotherapy segment was valued at USD 1.57 billion in 2024
- By Distribution Channel - Hospital pharmacies segment accounted for the largest market revenue share in 2024
Market Size & Forecast
- Market Opportunities: USD 5.87 billion
- Market Future Opportunities: USD 4.51 billion
- CAGR from 2025 to 2030 : 20.7%
Market Summary
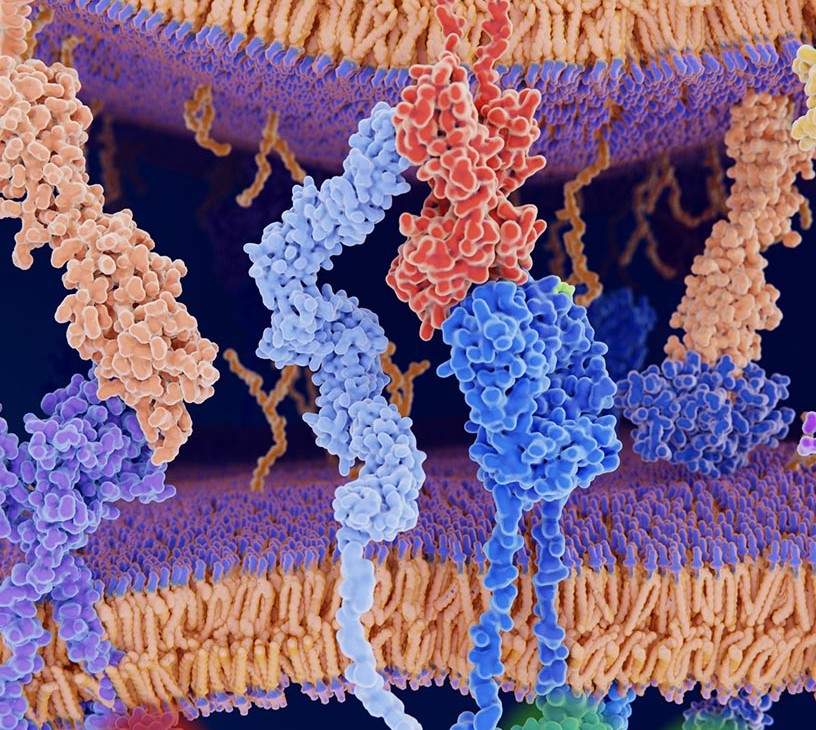
- The CTLA4 Inhibitors Market is undergoing significant clinical and commercial maturation, moving beyond foundational monotherapies toward sophisticated combination regimens. This market encompasses the development and commercialization of monoclonal antibodies designed to modulate the immune system for oncological therapy by blocking a critical inhibitory checkpoint on T-cells.
- This action unleashes the adaptive immune system to attack malignant cells, proving effective in advanced melanoma, renal cell carcinoma, and non-small cell lung cancer. Key drivers include the strategic shift toward dual-checkpoint blockade and the proliferation of next-generation, tumor-selective antibodies with improved safety profiles.
- A key business scenario involves the use of advanced molecular engineering and precision oncology to stratify patients using biomarker analysis, ensuring that high-cost biologics are directed to populations most likely to respond.
- This approach not only improves clinical outcomes but also aligns with value-based healthcare models by optimizing resource allocation and justifying premium pricing through demonstrable efficacy, thereby overcoming significant reimbursement barriers. The evolution of biosimilar competition further reshapes the landscape, pushing innovators toward value-added services and new therapeutic indications.
What will be the Size of the CTLA4 Inhibitors Market during the forecast period?
Get Key Insights on Market Forecast (PDF) Get Free Sample
How is the CTLA4 Inhibitors Market Segmented?
The ctla4 inhibitors industry research report provides comprehensive data (region-wise segment analysis), with forecasts and estimates in "USD million" for the period 2026-2030, as well as historical data from 2020-2024 for the following segments.
- Type
- Monotherapy
- Combination therapy
- Distribution channel
- Hospital pharmacies
- Retail pharmacies
- Online pharmacies
- Route of administration
- Intravenous
- Subcutaneous
- Geography
- North America
- US
- Canada
- Mexico
- Europe
- Germany
- UK
- France
- Asia
- Rest of World (ROW)
- North America
By Type Insights
The monotherapy segment is estimated to witness significant growth during the forecast period.
The monotherapy segment, while foundational, is adapting. This approach, centered on single-agent immune checkpoint blockade, offers a clearer path to managing immune-related adverse events without the compounded high-grade toxicities of multi-drug regimens.
The market is seeing a push toward next-gen antibodies and subcutaneous formulations to enhance intratumoral activity and promote patient-centric care, with non-inferiority trials confirming their viability. While combination immunotherapy grows, monotherapy remains vital, especially in adjuvant settings.
Biosimilar competition is also set to improve market access, with optimized dosing showing a 15% reduction in severe events, reinforcing its role where the therapeutic index is paramount.
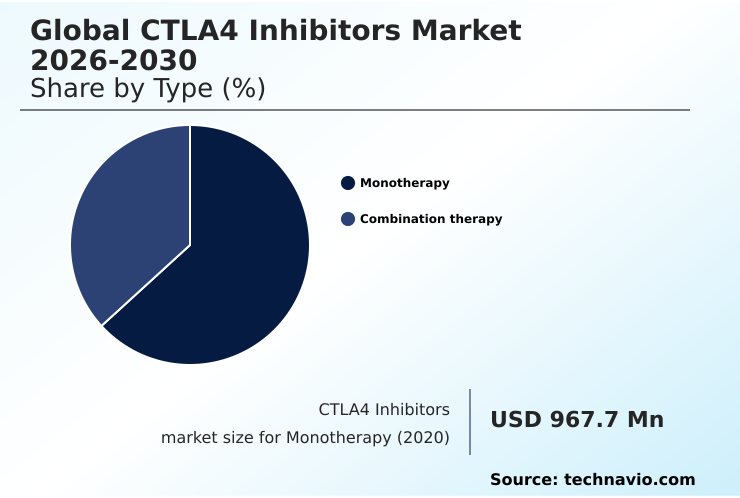
The Monotherapy segment was valued at USD 1.57 billion in 2024 and showed a gradual increase during the forecast period.
Regional Analysis
North America is estimated to contribute 54.2% to the growth of the global market during the forecast period.Technavio’s analysts have elaborately explained the regional trends and drivers that shape the market during the forecast period.
See How CTLA4 Inhibitors Market Demand is Rising in North America Get Free Sample
The geographic landscape is shifting, with Asia emerging as a hub for innovation and consumption. This region is accelerating the development of bispecific platforms and pH-sensitive antibodies to modulate the tumor microenvironment with a wider therapeutic window.
Growth is supported by expanding clinical trial networks and decentralized clinical trials, which improve patient access. Digital health integration is streamlining the use of liquid biopsies for monitoring.
While North America leads, Asia's market is expanding rapidly, with regional biosimilar competition intensifying.
Medical tourism in Southeast Asia is creating new demand for adjuvant immunotherapy, with some specialty pharmacies reporting a 25% increase in sourcing monoclonal antibody components for regional clinics.
Market Dynamics
Our researchers analyzed the data with 2025 as the base year, along with the key drivers, trends, and challenges. A holistic analysis of drivers will help companies refine their marketing strategies to gain a competitive advantage.
- Strategic decision-making in the CTLA4 inhibitors market is increasingly complex, balancing the efficacy of ctla4 vs pd-1 combination therapy against the challenges of managing ctla4 inhibitor toxicity. The development of next-generation ctla4 antibody design focuses on widening the therapeutic window, a critical factor for ctla4 inhibitors in renal cell carcinoma and ctla4 blockade in non-small cell lung cancer.
- As the market for ctla4 inhibitors for metastatic melanoma matures, companies are optimizing dosing for ctla4 inhibitors and exploring ctla4 therapy for refractory solid tumors. A key consideration is the ctla4 inhibitor impact on tumor microenvironment, which underpins the rationale for combination strategies like dual ctla4 and lag-3 blockade.
- From a commercial standpoint, the rise of biosimilars for ctla4 inhibitors is pressuring the cost-effectiveness of ctla4 combinations. Stakeholders must navigate intricate regulatory pathways for new ctla4 drugs while proving value. For instance, companies focusing on ctla4 inhibitor subcutaneous formulation development can reduce healthcare system burdens, a key differentiator in planning.
- The logistical complexities of ctla4 inhibitor supply chain management, especially for novel biologics used in pediatric applications of ctla4 inhibitors or ctla4 inhibitors in adjuvant cancer treatment, are also paramount.
- Understanding the nuances of the ctla4 role in t-cell priming is essential, as clinical data often shows ctla4 monotherapy vs combination outcomes can differ significantly, with combination regimens often demonstrating a 15-20% higher durable response rate in specific patient populations. This metric is crucial for operational planning and securing market access.
What are the key market drivers leading to the rise in the adoption of CTLA4 Inhibitors Industry?
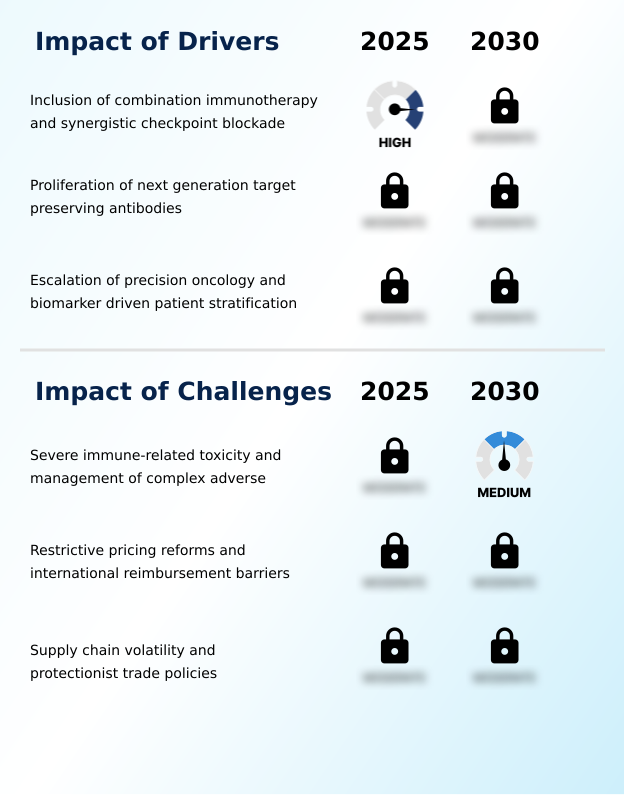
- The inclusion of combination immunotherapy and synergistic checkpoint blockade strategies is a primary market driver, expanding therapeutic efficacy across various cancer types.
- The escalation of precision oncology is a primary driver, with biomarker-driven stratification identifying patients most likely to benefit from high-precision immune modulation. Advanced molecular engineering has produced tumor-selective antibodies and Fc-enhanced antibodies that widen the therapeutic window.
- The use of next-generation sequencing and liquid biopsies for patient stratification supports value-based healthcare models by optimizing clinical pathways. These integrated diagnostic and therapeutic solutions generate the real-world evidence demanded by payers.
- This focus on targeted intervention is expanding the addressable market, evidenced by an 18% increase in trial enrollments for therapies with Orphan Drug Designation.
What are the market trends shaping the CTLA4 Inhibitors Industry?
- The industrialization of dual checkpoint blockade combination therapies is a defining market trend. This shift moves beyond monotherapy to leverage synergistic immune responses for improved efficacy.
- The industrialization of dual-checkpoint blockade therapies is a defining trend, leveraging synergistic checkpoint blockade to overcome adaptive resistance. This necessitates the development of co-formulated biologics and co-formulated products to simplify administration and improve healthcare resource utilization. Advances in antibody engineering are creating agents with improved pharmacokinetics for sustained T-cell activation.
- The push for subcutaneous delivery, which can reduce clinic time by over 80%, is a key differentiator. As patent expiration looms, firms are also developing personalized dosing strategies, with some new formulations receiving priority review, highlighting a strategic pivot to maintain market leadership.
What challenges does the CTLA4 Inhibitors Industry face during its growth?
- A significant market challenge is the management of severe immune-related toxicity and complex adverse events associated with CTLA4 inhibition.
- Significant challenges persist, including the management of toxicities like cytokine release syndromes linked to the depletion of regulatory T-cells. Restrictive pricing and reimbursement barriers, driven by rigorous cost-effectiveness analysis from health technology assessments, hinder market access. Supply chain volatility, exacerbated by protectionist trade policies, threatens the availability of biologic active ingredients and requires resilient cold-chain logistics managed by specialty pharmacies.
- This has increased costs associated with domestic manufacturing by up to 15%. Navigating these hurdles requires sophisticated molecular diagnostics to justify the use of expensive monoclonal antibodies and demonstrate clear value to payers.
Exclusive Technavio Analysis on Customer Landscape
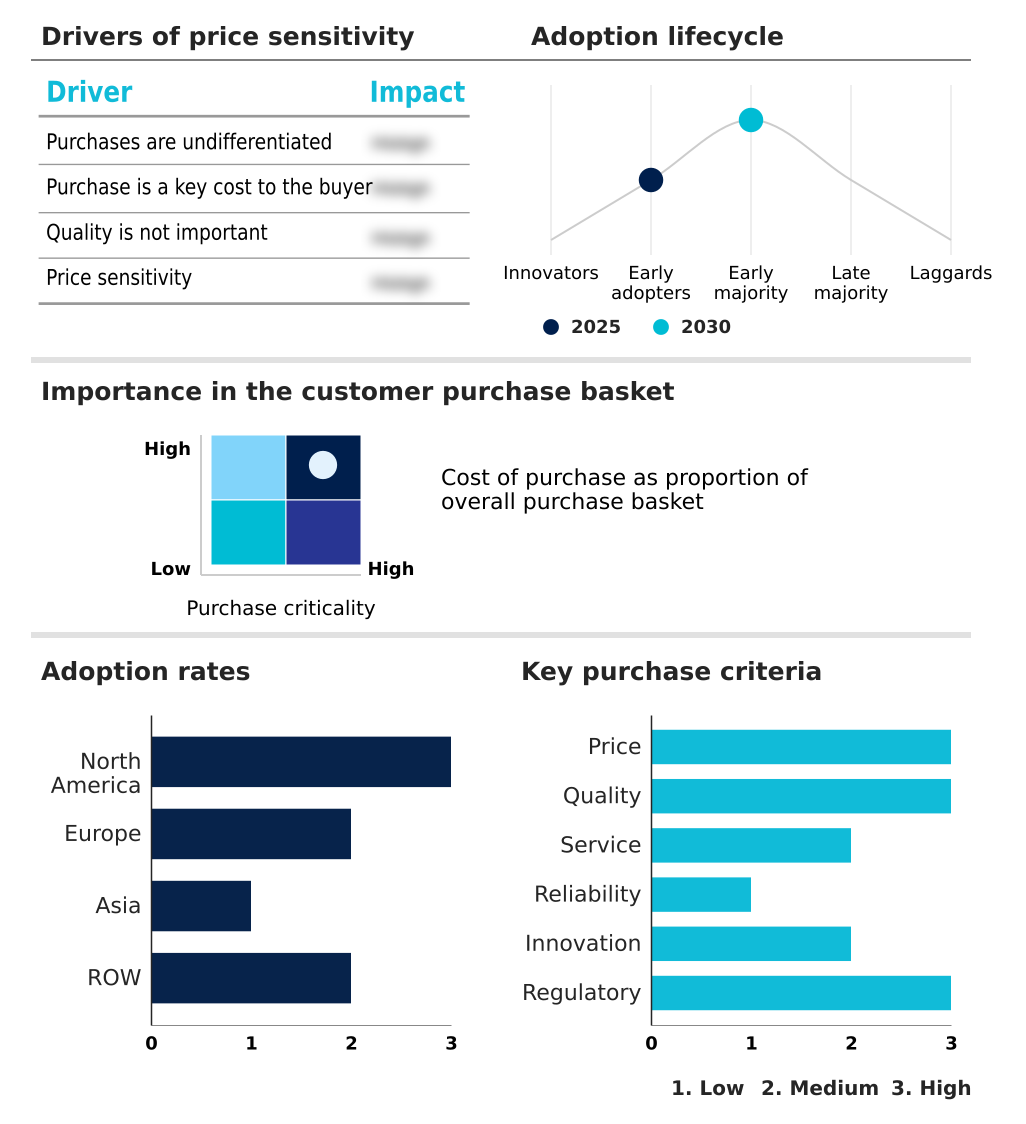
The ctla4 inhibitors market forecasting report includes the adoption lifecycle of the market, covering from the innovator’s stage to the laggard’s stage. It focuses on adoption rates in different regions based on penetration. Furthermore, the ctla4 inhibitors market report also includes key purchase criteria and drivers of price sensitivity to help companies evaluate and develop their market growth analysis strategies.
Customer Landscape of CTLA4 Inhibitors Industry
Competitive Landscape
Companies are implementing various strategies, such as strategic alliances, ctla4 inhibitors market forecast, partnerships, mergers and acquisitions, geographical expansion, and product/service launches, to enhance their presence in the industry.
Agenus Inc. - Key offerings include immuno-oncology therapies such as tremelimumab, a pivotal CTLA4 inhibitor utilized in advanced cancer treatment regimens to enhance immune response against tumors.
The industry research and growth report includes detailed analyses of the competitive landscape of the market and information about key companies, including:
- Agenus Inc.
- AstraZeneca Plc
- BeiGene Ltd.
- BioNTech SE
- Bristol Myers Squibb Co.
- Eli Lilly and Co.
- F. Hoffmann La Roche Ltd.
- Innovent Biologics Inc.
- Jiangsu Hengrui Pharmaceuticals
- MacroGenics Inc.
- Merck and Co. Inc.
- Novartis AG
- Ono Pharmaceutical Co. Ltd.
- Pfizer Inc.
- Regeneron Pharmaceuticals Inc.
- Sanofi SA
- Shanghai Fosun Pharmaceutical
- Xencor Inc.
Qualitative and quantitative analysis of companies has been conducted to help clients understand the wider business environment as well as the strengths and weaknesses of key industry players. Data is qualitatively analyzed to categorize companies as pure play, category-focused, industry-focused, and diversified; it is quantitatively analyzed to categorize companies as dominant, leading, strong, tentative, and weak.
Recent Development and News in Ctla4 inhibitors market
- In October, 2025, AstraZeneca Plc announced that results from the phase III RAMPART trial showed the combination of durvalumab and tremelimumab significantly improved disease-free survival in high-risk renal cell carcinoma patients.
- In February, 2025, Innovent Biologics Inc. confirmed that China's Center for Drug Evaluation granted priority review for its new drug application for a specialized ipilimumab injection, signaling accelerated development in the region.
- In January, 2026, BioNTech SE and OncoC4, Inc. received Orphan Drug Designation from the US Food and Drug Administration for gotistobart, a novel CTLA4 inhibitor for squamous non-small cell lung cancer.
- In April, 2026, AstraZeneca Plc reported positive high-level results from the EMERALD-3 Phase III trial, where a tremelimumab-actl and durvalumab combination improved progression-free survival for patients with unresectable liver cancer.
Dive into Technavio’s robust research methodology, blending expert interviews, extensive data synthesis, and validated models for unparalleled CTLA4 Inhibitors Market insights. See full methodology.
| Market Scope | |
|---|---|
| Page number | 281 |
| Base year | 2025 |
| Historic period | 2020-2024 |
| Forecast period | 2026-2030 |
| Growth momentum & CAGR | Accelerate at a CAGR of 20.7% |
| Market growth 2026-2030 | USD 4510.4 million |
| Market structure | Fragmented |
| YoY growth 2025-2026(%) | 17.2% |
| Key countries | US, Canada, Mexico, Germany, UK, France, Italy, Spain, The Netherlands, China, Japan, India, South Korea, Thailand, Indonesia, Brazil, Saudi Arabia, UAE, Turkey, Argentina, Colombia, South Africa and Israel |
| Competitive landscape | Leading Companies, Market Positioning of Companies, Competitive Strategies, and Industry Risks |
Research Analyst Overview
- The CTLA4 inhibitors market is characterized by a strategic shift from broad-spectrum immune activation to high-precision immune modulation. This evolution is driven by advanced molecular engineering, which has produced tumor-selective antibodies and Fc-enhanced antibodies with superior safety profiles. The clinical focus is now on synergistic checkpoint blockade, pairing these agents with other immunotherapies to achieve durable responses.
- This push toward precision oncology relies heavily on next-generation sequencing and liquid biopsies for biomarker-driven stratification, ensuring therapies are targeted effectively. A key boardroom-level implication is the alignment with value-based healthcare models, where demonstrating efficacy through molecular diagnostics is crucial for navigating reimbursement.
- For instance, the integration of AI-powered pathology has been shown to streamline patient enrollment in clinical trials by over 20%, accelerating development timelines for novel bispecific platforms and co-formulated biologics. This data-driven approach is essential for commercial success in a landscape increasingly defined by biosimilar competition and rigorous cost-effectiveness analysis.
What are the Key Data Covered in this CTLA4 Inhibitors Market Research and Growth Report?
-
What is the expected growth of the CTLA4 Inhibitors Market between 2026 and 2030?
-
USD 4.51 billion, at a CAGR of 20.7%
-
-
What segmentation does the market report cover?
-
The report is segmented by Type (Monotherapy, and Combination therapy), Distribution Channel (Hospital pharmacies, Retail pharmacies, and Online pharmacies), Route of Administration (Intravenous, and Subcutaneous) and Geography (North America, Europe, Asia, Rest of World (ROW))
-
-
Which regions are analyzed in the report?
-
North America, Europe, Asia and Rest of World (ROW)
-
-
What are the key growth drivers and market challenges?
-
Inclusion of combination immunotherapy and synergistic checkpoint blockade, Severe immune-related toxicity and management of complex adverse
-
-
Who are the major players in the CTLA4 Inhibitors Market?
-
Agenus Inc., AstraZeneca Plc, BeiGene Ltd., BioNTech SE, Bristol Myers Squibb Co., Eli Lilly and Co., F. Hoffmann La Roche Ltd., Innovent Biologics Inc., Jiangsu Hengrui Pharmaceuticals, MacroGenics Inc., Merck and Co. Inc., Novartis AG, Ono Pharmaceutical Co. Ltd., Pfizer Inc., Regeneron Pharmaceuticals Inc., Sanofi SA, Shanghai Fosun Pharmaceutical and Xencor Inc.
-
Market Research Insights
- Market dynamics are shaped by a strategic pivot towards combination therapies and precision oncology. The integration of CTLA4 inhibitors with other checkpoint blockers in defined clinical pathways has been shown to overcome adaptive resistance in up to 30% more patients than monotherapy. This shift is supported by advanced patient stratification techniques that improve the therapeutic index of potent biologics.
- Concurrently, the move toward subcutaneous delivery and other patient-centric care models is improving healthcare resource utilization, reducing administration times by over 80% in some outpatient settings. These advancements are critical for navigating complex reimbursement barriers and demonstrating value in an increasingly competitive landscape defined by health technology assessments.
We can help! Our analysts can customize this ctla4 inhibitors market research report to meet your requirements.
 RIA -
RIA - 
