
Cultured Meat Market Analysis, Size, and Forecast 2026-2030: North America (US, Canada, and Mexico), Europe (The Netherlands, UK, and Germany), APAC (China, Japan, and South Korea), Middle East and Africa (Israel, UAE, and Saudi Arabia), South America (Brazil, Argentina, and Colombia), and Rest of World (ROW)

Cultured Meat Market Analysis, Size, and Forecast 2026-2030:
North America (US, Canada, and Mexico), Europe (The Netherlands, UK, and Germany), APAC (China, Japan, and South Korea), Middle East and Africa (Israel, UAE, and Saudi Arabia), South America (Brazil, Argentina, and Colombia), and Rest of World (ROW)

Published: Oct 2026 315 Pages SKU: IRTNTR81631

Market Overview at a Glance

$489.16 Mn
Market Opportunity
19.1%
CAGR 2025 - 2030
32.7%
North America Growth
$113.16 Mn
Poultry segment 2024

Cultured Meat Market Size 2026-2030

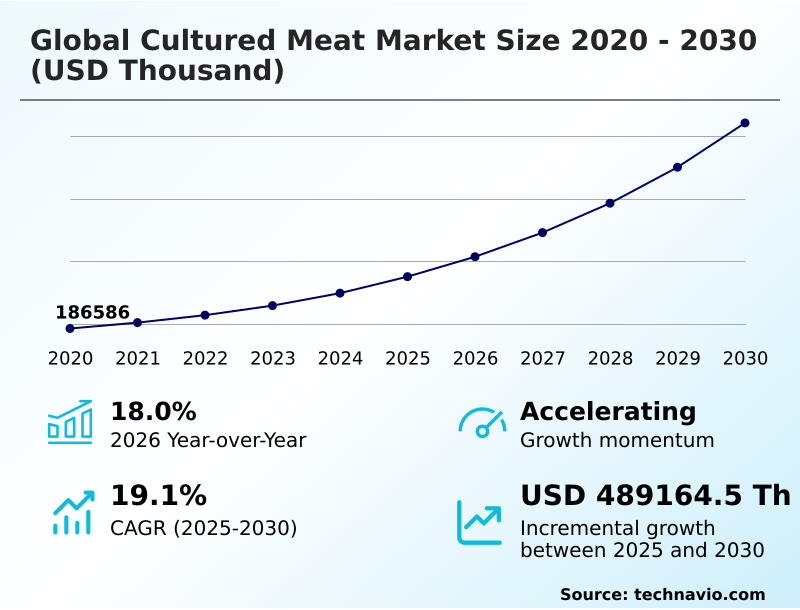
The cultured meat market size is valued to increase by USD 489.16 million, at a CAGR of 19.1% from 2025 to 2030. Ethical and environmental sustainability imperatives driving cultured meat market will drive the cultured meat market.

Major Market Trends & Insights

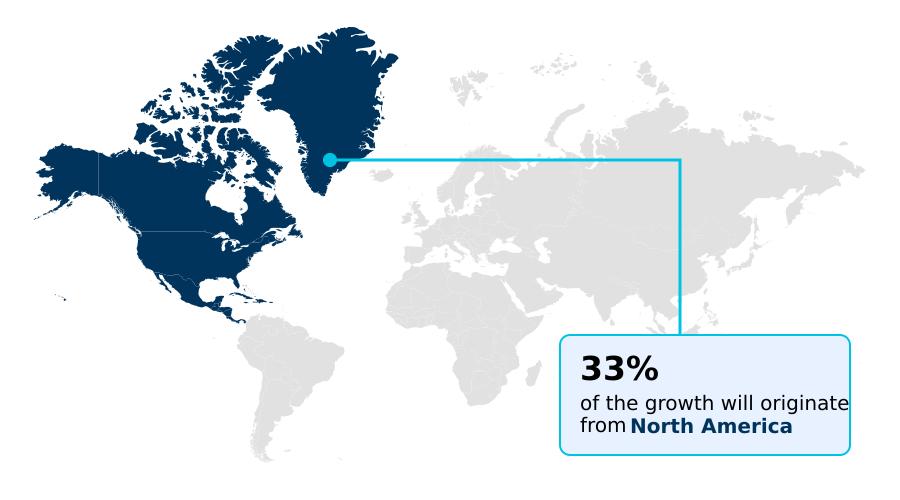
  • North America dominated the market and accounted for a 32.7% growth during the forecast period.
  • By Source - Poultry segment was valued at USD 113.16 million in 2024
  • By End-user - Foodservice segment accounted for the largest market revenue share in 2024

Market Size & Forecast

  • Market Opportunities:
  • Market Future Opportunities: USD 489.16 million
  • CAGR from 2025 to 2030 : 19.1%

Market Summary

  • The Cultured Meat Market is undergoing a rapid transition from foundational laboratory research to pilot-scale commercial manufacturing, driven by systemic shifts in global protein procurement. Ethical and environmental sustainability imperatives act as a primary catalyst, as food conglomerates seek viable mechanisms to reduce agricultural land usage and mitigate greenhouse gas emissions associated with conventional livestock.
  • However, prohibitive capital outlays for specialized bioprocessing infrastructure severely constrain production capacities, limiting immediate mass-market retail viability. To overcome supply chain bottlenecks, biotechnology firms are strategically partnering with traditional meat processors to leverage existing cold-chain logistics and distribution networks.
  • This operational integration has allowed early adopters to reduce downstream logistics expenditures by up to 22% compared to isolated startup distribution models. Facilities implementing automated monitoring protocols achieve highly consistent biomass yields while lowering contamination risks. Furthermore, advancements in serum-free cell nutrition are steadily moving the industry toward cost parity with conventional meat.
  • Expanding international regulatory frameworks will continue to facilitate cross-border trade, cementing cellular agriculture as a permanent fixture within the broader commercial food ecosystem.

What will be the Size of the Cultured Meat Market during the forecast period?
Get Key Insights on Market Forecast (PDF) Get Free Sample

How is the Cultured Meat Market Segmented?

The cultured meat industry research report provides comprehensive data (region-wise segment analysis), with forecasts and estimates in "USD thousand" for the period 2026-2030, as well as historical data from 2020-2024 for the following segments.

  • Source
    • Poultry
    • Beef
    • Seafood
    • Pork
    • Duck
  • End-user
    • Foodservice
    • Food manufacturers
    • Retail
    • Research institutes
  • Application
    • Nuggets
    • Burgers
    • Meatballs
    • Sausages
    • Hot Dogs
  • Geography
    • North America
      • US
      • Canada
      • Mexico
    • Europe
      • The Netherlands
      • UK
      • Germany
      • France
      • Italy
      • Spain
    • APAC
      • China
      • Japan
      • South Korea
      • Australia
      • India
      • Indonesia
    • Middle East and Africa
      • Israel
      • UAE
      • Saudi Arabia
      • South Africa
      • Turkey
    • South America
      • Brazil
      • Argentina
      • Colombia

By Source Insights

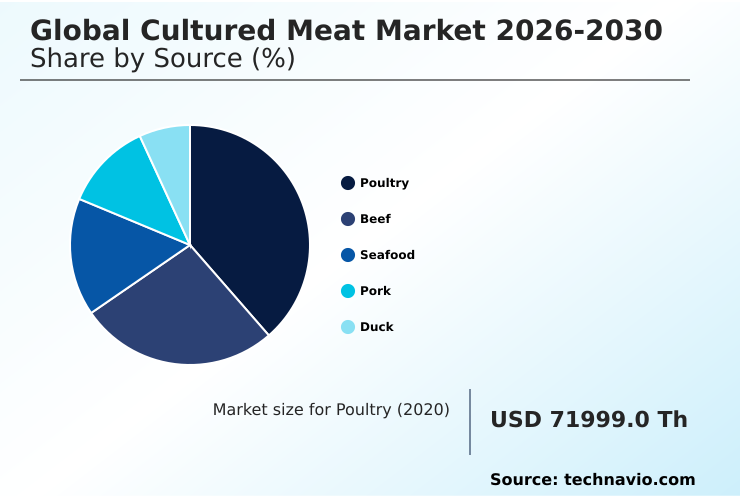
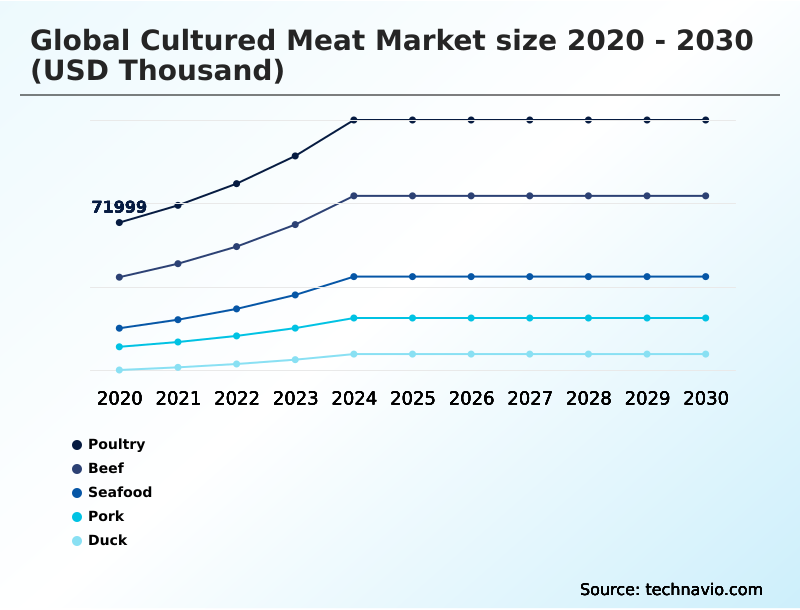
The poultry segment is estimated to witness significant growth during the forecast period.

The avian protein sector demonstrates the highest operational maturity within the cellular agriculture domain, propelled by highly efficient growth kinetics and neutral flavor baselines.

Commercialization efforts are rapidly advancing due to the robust properties of skeletal muscle satellite cells and induced pluripotent stem cells, which facilitate rapid biomass accumulation.

Facilities utilizing optimized micro milled cell paste combined with cell cultured meat ingredients have reported a 28% improvement in structural cohesion compared to earlier formulations.

This advancement accelerates the deployment of continuous extrusion equipment for unstructured items like nuggets and patties. Furthermore, achieving precise myogenesis and adipogenesis allows for authentic thermal melting behavior replication during cooking.

By employing targeted post processing flavor interventions, manufacturers have increased batch flavor consistency by 15% across large scale runs, driving cost effective retail expansion and supply chain stability.
Get Free Sample

The Poultry segment was valued at USD 113.16 million in 2024 and showed a gradual increase during the forecast period.
Get Free Sample

Regional Analysis

North America is estimated to contribute 32.7% to the growth of the global market during the forecast period.Technavio’s analysts have elaborately explained the regional trends and drivers that shape the market during the forecast period.
See How Cultured Meat Market Demand is Rising in North America Get Free Sample

North America and Europe demonstrate contrasting deployment strategies within the Cultured Meat sector based on differing regulatory frameworks and investment climates.

North America leads in scaling high capacity airlift bioreactors, achieving a 30% higher facility throughput rate than European counterparts due to streamlined domestic approvals.

European entities, navigating stricter novel food mandates, prioritize premium structural tissue engineering and extracellular matrix mimicry to target high value gastronomic markets.

By optimizing mammalian cell proliferation within advanced three dimensional biomaterial scaffolds, European developers have improved tissue density by 18%.

Conversely, North American firms focus on rapid commercialization of unstructured animal free protein choices, utilizing efficient cellular vascularization pathways to reduce nutrient media expenses by 22%.

These regional operational adaptations dictate supply chain architectures, with North America driving mass market volume scale up while Europe excels in specialized, high margin cellular agriculture engineering.

Market Dynamics

Our researchers analyzed the data with 2025 as the base year, along with the key drivers, trends, and challenges. A holistic analysis of drivers will help companies refine their marketing strategies to gain a competitive advantage.

  • Transitioning cellular agriculture from research environments to commercial viability requires extensive integration of advanced biomanufacturing technologies. Operational planning heavily relies on industrial scale bioreactor design and the deployment of high capacity hollow fiber bioreactors to maximize volumetric output.
  • By implementing continuous bioprocessing automated monitoring, facilities experience a near two-fold improvement in batch consistency compared to manual sampling methodologies, directly enhancing supply chain predictability. The commercial foundation also depends upon rigorous cell line genetic stability testing and efficient induced pluripotent stem cell isolation to maintain robust replication cycles.
  • Furthermore, achieving cost parity demands serum free media formulation optimization utilizing cost effective recombinant growth factors and precision fermented animal free proteins. This shift lowers raw input expenditures significantly, allowing companies to focus on advanced mammalian cell proliferation protocols.
  • Downstream product architecture is evolving through hybrid cultivated meat matrix development, blending plant bases with micro milled cultivated meat paste to accelerate retail entry. For premium whole cut alternatives, developers employ three dimensional scaffold tissue engineering alongside lipid tissue aromatic compound extraction to replicate authentic culinary experiences.
  • Ensuring absolute biological safety, these processes are housed within sterile closed loop manufacturing systems. Finally, to mitigate logistics disruptions, companies are establishing localized decentralized biomanufacturing hubs, which shorten distribution networks and lower cold chain overheads, driving superior operational resilience across the sustainable protein sector.
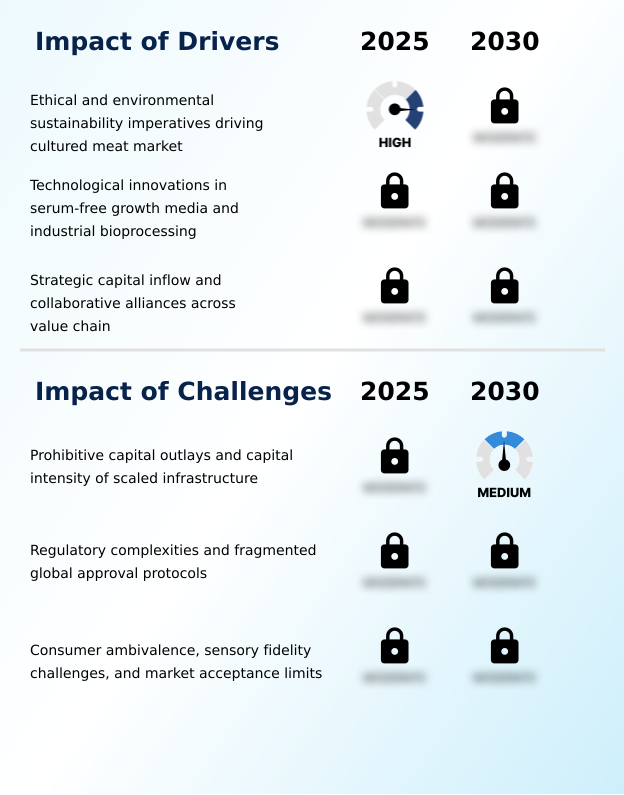
What are the key market drivers leading to the rise in the adoption of Cultured Meat Industry?

  • Ethical and environmental sustainability imperatives are serving as a primary driver for market expansion, compelling food systems to adopt less resource-intensive production methodologies.

  • Escalating corporate commitments to environmental sustainability and stringent climate policies are powerfully accelerating the deployment of ethical protein options.
  • The commercial viability of cultivated tissue production is driven by critical cellular biology breakthroughs, particularly the transition to serum free cell culture media.
  • Utilizing precision fermented growth factors and fetal bovine serum alternatives, manufacturers have successfully reduced raw media expenditures by over 40%, directly addressing a major historical financial bottleneck. This cost reduction is further amplified by intense industrial bioprocessing optimization.
  • The integration of bioprocess automation and sophisticated automated nutrient delivery systems ensures stable metabolic environments for non genetically modified cells.
  • These systemic upgrades have subsequently improved overall cellular harvest yields by 22%, empowering food brands to aggressively scale clean label protein portfolios without compromising supply chain margins.

What are the market trends shaping the Cultured Meat Industry?

  • Regulatory harmonization and accelerated novel food approval frameworks represent a defining trend shaping the industry landscape. These standardized evaluation protocols are significantly reducing commercialization timelines and fostering international market expansion.

  • The transition toward decentralized biomanufacturing infrastructure is fundamentally reshaping the Cultured Meat supply chain, enabling companies to bypass international cold chain vulnerabilities. By establishing modular biomanufacturing hubs near urban consumption centers, producers have slashed transportation logistics costs by up to 25%. This architectural shift is driven by the necessity to create scalable, highly responsive local food systems.
  • Concurrently, the adoption of continuous industrial fermentation systems enhances operational efficiency, reducing facility downtime by 30% compared to traditional batch processing. To accelerate retail readiness, developers are deploying hybrid product architectures that combine cultivated cells with plant based scaffold structures.
  • The precise application of advanced lipid culturing techniques and specialized bio ink formulations allows these hybrid items to achieve authentic sensory profiles at lower price points. These technical innovations dramatically decrease the required cell density per unit, facilitating faster market entry for sustainable alternative proteins.

What challenges does the Cultured Meat Industry face during its growth?

  • Prohibitive capital outlays and the extreme capital intensity required for scaled biomanufacturing infrastructure present substantial barriers to widespread commercialization.

  • The extreme capital intensity required for commercial biomanufacturing poses a severe structural limitation on rapid market scaling. Constructing advanced sterile closed loop environments demands massive upfront financial investments, effectively extending the time to profitability for early stage ventures. Achieving standardized batch production remains difficult due to the complexities of bioreactor engineering and precise shear stress environment maintenance at large scales.
  • While cleanroom environment optimization has reduced contamination related batch losses by 15%, the operational costs associated with cell line immortalization and genetic stability testing remain elevated. Furthermore, developing scalable cell isolation protocols and sourcing food grade recombinant protein mixtures inflate ongoing operational expenditures by nearly 35% compared to traditional agricultural feed.
  • These financial and technical barriers require immense long term capital deployment before volumetric scaling solutions can yield accessible consumer price points.

Exclusive Technavio Analysis on Customer Landscape

The cultured meat market forecasting report includes the adoption lifecycle of the market, covering from the innovator’s stage to the laggard’s stage. It focuses on adoption rates in different regions based on penetration. Furthermore, the cultured meat market report also includes key purchase criteria and drivers of price sensitivity to help companies evaluate and develop their market growth analysis strategies.
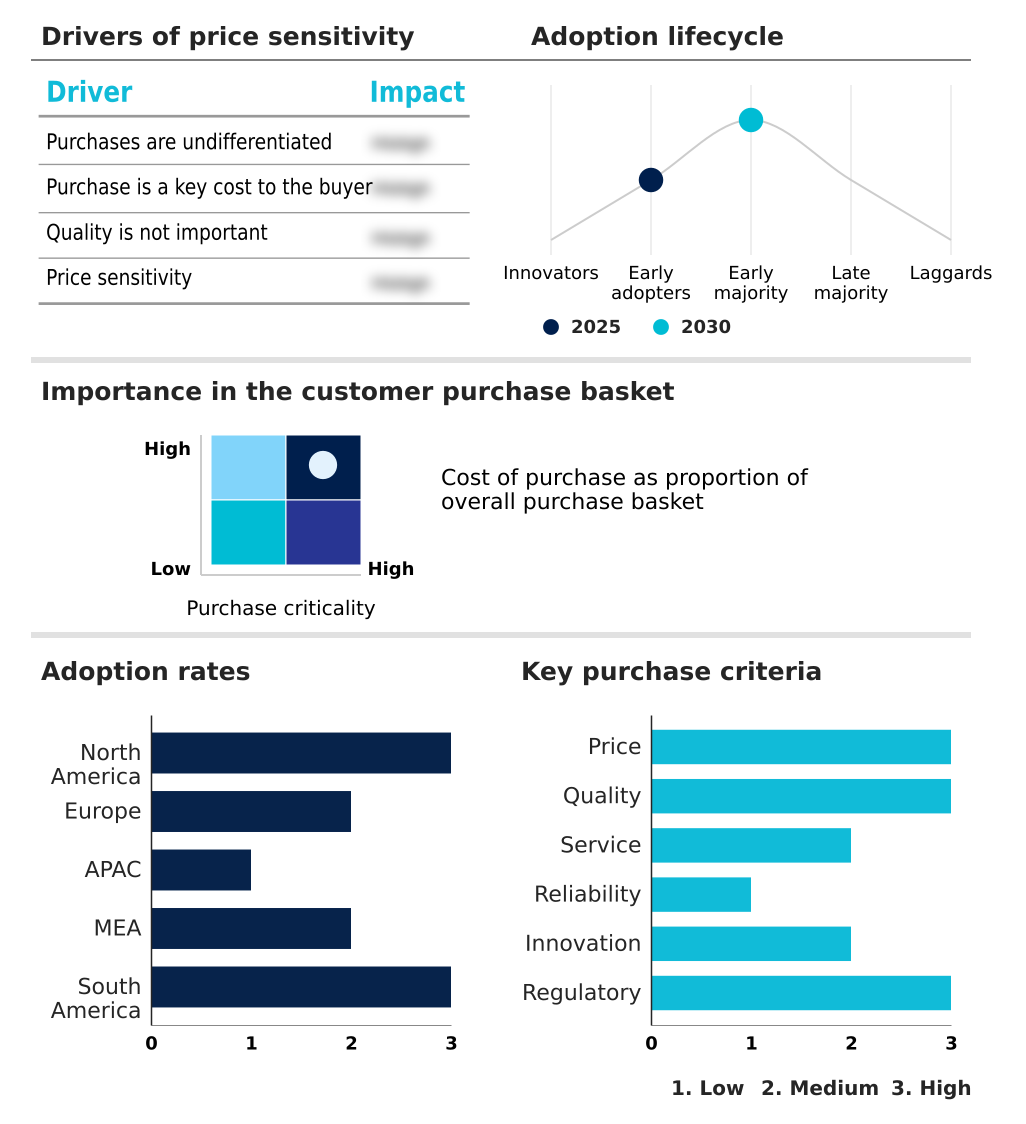
Customer Landscape of Cultured Meat Industry

Competitive Landscape

Companies are implementing various strategies, such as strategic alliances, cultured meat market forecast, partnerships, mergers and acquisitions, geographical expansion, and product/service launches, to enhance their presence in the industry.

Aleph Farms Ltd. - This entity engineers premium cultivated beef steaks utilizing non genetically modified animal cells to deliver authentic tissue structures and advance sustainable alternative protein solutions globally.

The industry research and growth report includes detailed analyses of the competitive landscape of the market and information about key companies, including:

  • Aleph Farms Ltd.
  • BlueNalu Inc.
  • Bluu GMBH
  • CELLMEAT CO. LTD
  • Clever Carnivore
  • Finless Foods Inc.
  • Fork and Good Inc
  • Forsea
  • GOOD Meat
  • Gourmey
  • Ivy Farm
  • Magic Valley
  • Mission Barns
  • Mosa Meat BV
  • SuperMeat
  • Upside Foods Inc.
  • Vital Meat
  • Vow
  • Wanda Fish
  • Wildtype

Qualitative and quantitative analysis of companies has been conducted to help clients understand the wider business environment as well as the strengths and weaknesses of key industry players. Data is qualitatively analyzed to categorize companies as pure play, category-focused, industry-focused, and diversified; it is quantitatively analyzed to categorize companies as dominant, leading, strong, tentative, and weak.

Recent Development and News in Cultured meat market

  • In the Packaged Foods and Meats industry, the widespread adoption of net-zero supply chain mandates by multinational food conglomerates has accelerated corporate capital deployment, directly impacting Cultured Meat demand by creating guaranteed downstream off-take agreements for sustainably produced protein.
  • Stringent environmental regulations targeting agricultural runoff and greenhouse gas emissions from conventional livestock facilities have forced processors to diversify protein portfolios, resulting in a 25% increase in pilot-scale infrastructure investments for alternative meat cultivation.
  • The commercial integration of precision fermentation technology for food-grade amino acids has significantly lowered the cost of raw material inputs, overcoming a critical supply chain bottleneck and improving the unit economics of cellular agriculture manufacturing.
  • Rising occurrences of zoonotic disease outbreaks in traditional avian and swine supply chains have disrupted global meat logistics, prompting institutional foodservice operators to shift procurement strategies toward highly biosecure lab-cultivated protein sources to ensure stable inventory.

Dive into Technavio’s robust research methodology, blending expert interviews, extensive data synthesis, and validated models for unparalleled Cultured Meat Market insights. See full methodology.

Market Scope
Page number 315
Base year 2025
Historic period 2020-2024
Forecast period 2026-2030
Growth momentum & CAGR Accelerate at a CAGR of 19.1%
Market growth 2026-2030 USD 489164.5 thousand
Market structure Fragmented
YoY growth 2025-2026(%) 18.0%
Key countries US, Canada, Mexico, The Netherlands, UK, Germany, France, Italy, Spain, China, Japan, South Korea, Australia, India, Indonesia, Israel, UAE, Saudi Arabia, South Africa, Turkey, Brazil, Argentina and Colombia
Competitive landscape Leading Companies, Market Positioning of Companies, Competitive Strategies, and Industry Risks

Request Free Sample

Research Analyst Overview

  • The transition toward cell cultivated protein represents a fundamental structural shift in global food procurement, requiring immediate boardroom level strategy realignment regarding supply chain sustainability and product portfolio diversification. Executives are increasingly prioritizing regulatory compliance and raw material sourcing as traditional livestock networks face unprecedented ecological constraints.
  • By investing in scalable biomanufacturing infrastructure, forward thinking conglomerates are mitigating long term volatility in agricultural commodity markets. The integration of advanced lipid profiling and post processing flavor interventions has directly addressed consumer sensory expectations, allowing new formulations to achieve a 40% improvement in blind taste test parity against conventional animal tissue.
  • Furthermore, leveraging recombinant collagen scaffolds enables the precise replication of complex whole cut textures. Optimizing bioprocess fluid dynamics within industrial vessels guarantees consistent nutrient distribution, drastically lowering batch failure rates. This strategic shift not only aligns with international environmental mandates but also establishes a resilient, biosecure food production framework capable of meeting escalating global protein demands without exacerbating ecological degradation.

What are the Key Data Covered in this Cultured Meat Market Research and Growth Report?

  • What is the expected growth of the Cultured Meat Market between 2026 and 2030?

    • USD 489.16 million, at a CAGR of 19.1%

  • What segmentation does the market report cover?

    • The report is segmented by Source (Poultry, Beef, Seafood, Pork, and Duck), End-user (Foodservice, Food manufacturers, Retail, and Research institutes), Application (Nuggets, Burgers, Meatballs, Sausages, and Hot Dogs) and Geography (North America, Europe, APAC, Middle East and Africa, South America)

  • Which regions are analyzed in the report?

    • North America, Europe, APAC, Middle East and Africa and South America

  • What are the key growth drivers and market challenges?

    • Ethical and environmental sustainability imperatives driving cultured meat market, Prohibitive capital outlays and capital intensity of scaled infrastructure

  • Who are the major players in the Cultured Meat Market?

    • Aleph Farms Ltd., BlueNalu Inc., Bluu GMBH, CELLMEAT CO. LTD, Clever Carnivore, Finless Foods Inc., Fork and Good Inc, Forsea, GOOD Meat, Gourmey, Ivy Farm, Magic Valley, Mission Barns, Mosa Meat BV, SuperMeat, Upside Foods Inc., Vital Meat, Vow, Wanda Fish and Wildtype

Market Research Insights

  • The Cultured Meat Market is accelerating as food developers deploy specialized biomanufacturing equipment to transition away from traditional animal agriculture. By implementing continuous bioreactor designs, manufacturers have successfully increased cellular yield efficiency by 35% compared to legacy batch processing methods.
  • This operational shift is heavily supported by the development of a decentralized biomanufacturing infrastructure, which reduces long haul transportation costs by nearly 20% by locating production closer to urban demand centers. Furthermore, integrating concentrated animal fat matrices into plant based bases has improved flavor retention scores by 25% during consumer sensory trials.
  • These measurable improvements in cost and product quality are empowering food conglomerates to scale sustainable protein alternatives effectively.

We can help! Our analysts can customize this cultured meat market research report to meet your requirements.

Get in touch

1. Executive Summary

1.1 Market overview

Executive Summary - Chart on Market Overview
Executive Summary - Data Table on Market Overview
Executive Summary - Chart on Global Market Characteristics
Executive Summary - Chart on Market by Geography
Executive Summary - Chart on Market Segmentation by Source
Executive Summary - Chart on Market Segmentation by End-user
Executive Summary - Chart on Market Segmentation by Application
Executive Summary - Chart on Incremental Growth
Executive Summary - Data Table on Incremental Growth
Executive Summary - Chart on Company Market Positioning

2. Technavio Analysis

2.1 Analysis of price sensitivity, lifecycle, customer purchase basket, adoption rates, and purchase criteria

2.2 Criticality of inputs and Factors of differentiation

Chart on Overview on criticality of inputs and factors of differentiation

2.3 Factors of disruption

Chart on Overview on factors of disruption

2.4 Impact of drivers and challenges

Chart on Impact of drivers and challenges in 2025 and 2030

3. Market Landscape

3.1 Market ecosystem

Chart on Parent Market
Data Table on - Parent Market

3.2 Market characteristics

Chart on Market characteristics analysis

3.3 Value chain analysis

Chart on Value chain analysis

4. Market Sizing

4.1 Market definition

Data Table on Offerings of companies included in the market definition

4.2 Market segment analysis

Market segments

4.3 Market size 2025

4.4 Market outlook: Forecast for 2025-2030

Chart on Global - Market size and forecast 2025-2030 ($ thousand)
Data Table on Global - Market size and forecast 2025-2030 ($ thousand)
Chart on Global Market: Year-over-year growth 2025-2030 (%)
Data Table on Global Market: Year-over-year growth 2025-2030 (%)

5. Historic Market Size

5.1 Global Cultured Meat Market 2020 - 2024

Historic Market Size - Data Table on Global Cultured Meat Market 2020 - 2024 ($ thousand)

5.2 Source segment analysis 2020 - 2024

Historic Market Size - Source Segment 2020 - 2024 ($ thousand)

5.3 End-user segment analysis 2020 - 2024

Historic Market Size - End-user Segment 2020 - 2024 ($ thousand)

5.4 Application segment analysis 2020 - 2024

Historic Market Size - Application Segment 2020 - 2024 ($ thousand)

5.5 Geography segment analysis 2020 - 2024

Historic Market Size - Geography Segment 2020 - 2024 ($ thousand)

5.6 Country segment analysis 2020 - 2024

Historic Market Size - Country Segment 2020 - 2024 ($ thousand)

6. Qualitative Analysis

6.1 Impact of AI on Global Cultured Meat Market

6.2 Impact of Geopolitical Conflicts on Global Cultured Meat Market

7. Five Forces Analysis

7.1 Five forces summary

Five forces analysis - Comparison between 2025 and 2030

7.2 Bargaining power of buyers

Bargaining power of buyers - Impact of key factors 2025 and 2030

7.3 Bargaining power of suppliers

Bargaining power of suppliers - Impact of key factors in 2025 and 2030

7.4 Threat of new entrants

Threat of new entrants - Impact of key factors in 2025 and 2030

7.5 Threat of substitutes

Threat of substitutes - Impact of key factors in 2025 and 2030

7.6 Threat of rivalry

Threat of rivalry - Impact of key factors in 2025 and 2030

7.7 Market condition

Chart on Market condition - Five forces 2025 and 2030

8. Market Segmentation by Source

8.1 Market segments

Chart on Source - Market share 2025-2030 (%)
Data Table on Source - Market share 2025-2030 (%)

8.2 Comparison by Source

Chart on Comparison by Source
Data Table on Comparison by Source

8.3 Poultry - Market size and forecast 2025-2030

Chart on Poultry - Market size and forecast 2025-2030 ($ thousand)
Data Table on Poultry - Market size and forecast 2025-2030 ($ thousand)
Chart on Poultry - Year-over-year growth 2025-2030 (%)
Data Table on Poultry - Year-over-year growth 2025-2030 (%)

8.4 Beef - Market size and forecast 2025-2030

Chart on Beef - Market size and forecast 2025-2030 ($ thousand)
Data Table on Beef - Market size and forecast 2025-2030 ($ thousand)
Chart on Beef - Year-over-year growth 2025-2030 (%)
Data Table on Beef - Year-over-year growth 2025-2030 (%)

8.5 Seafood - Market size and forecast 2025-2030

Chart on Seafood - Market size and forecast 2025-2030 ($ thousand)
Data Table on Seafood - Market size and forecast 2025-2030 ($ thousand)
Chart on Seafood - Year-over-year growth 2025-2030 (%)
Data Table on Seafood - Year-over-year growth 2025-2030 (%)

8.6 Pork - Market size and forecast 2025-2030

Chart on Pork - Market size and forecast 2025-2030 ($ thousand)
Data Table on Pork - Market size and forecast 2025-2030 ($ thousand)
Chart on Pork - Year-over-year growth 2025-2030 (%)
Data Table on Pork - Year-over-year growth 2025-2030 (%)

8.7 Duck - Market size and forecast 2025-2030

Chart on Duck - Market size and forecast 2025-2030 ($ thousand)
Data Table on Duck - Market size and forecast 2025-2030 ($ thousand)
Chart on Duck - Year-over-year growth 2025-2030 (%)
Data Table on Duck - Year-over-year growth 2025-2030 (%)

8.8 Market opportunity by Source

Market opportunity by Source ($ thousand)
Data Table on Market opportunity by Source ($ thousand)

9. Market Segmentation by End-user

9.1 Market segments

Chart on End-user - Market share 2025-2030 (%)
Data Table on End-user - Market share 2025-2030 (%)

9.2 Comparison by End-user

Chart on Comparison by End-user
Data Table on Comparison by End-user

9.3 Foodservice - Market size and forecast 2025-2030

Chart on Foodservice - Market size and forecast 2025-2030 ($ thousand)
Data Table on Foodservice - Market size and forecast 2025-2030 ($ thousand)
Chart on Foodservice - Year-over-year growth 2025-2030 (%)
Data Table on Foodservice - Year-over-year growth 2025-2030 (%)

9.4 Food manufacturers - Market size and forecast 2025-2030

Chart on Food manufacturers - Market size and forecast 2025-2030 ($ thousand)
Data Table on Food manufacturers - Market size and forecast 2025-2030 ($ thousand)
Chart on Food manufacturers - Year-over-year growth 2025-2030 (%)
Data Table on Food manufacturers - Year-over-year growth 2025-2030 (%)

9.5 Retail - Market size and forecast 2025-2030

Chart on Retail - Market size and forecast 2025-2030 ($ thousand)
Data Table on Retail - Market size and forecast 2025-2030 ($ thousand)
Chart on Retail - Year-over-year growth 2025-2030 (%)
Data Table on Retail - Year-over-year growth 2025-2030 (%)

9.6 Research institutes - Market size and forecast 2025-2030

Chart on Research institutes - Market size and forecast 2025-2030 ($ thousand)
Data Table on Research institutes - Market size and forecast 2025-2030 ($ thousand)
Chart on Research institutes - Year-over-year growth 2025-2030 (%)
Data Table on Research institutes - Year-over-year growth 2025-2030 (%)

9.7 Market opportunity by End-user

Market opportunity by End-user ($ thousand)
Data Table on Market opportunity by End-user ($ thousand)

10. Market Segmentation by Application

10.1 Market segments

Chart on Application - Market share 2025-2030 (%)
Data Table on Application - Market share 2025-2030 (%)

10.2 Comparison by Application

Chart on Comparison by Application
Data Table on Comparison by Application

10.3 Nuggets - Market size and forecast 2025-2030

Chart on Nuggets - Market size and forecast 2025-2030 ($ thousand)
Data Table on Nuggets - Market size and forecast 2025-2030 ($ thousand)
Chart on Nuggets - Year-over-year growth 2025-2030 (%)
Data Table on Nuggets - Year-over-year growth 2025-2030 (%)

10.4 Burgers - Market size and forecast 2025-2030

Chart on Burgers - Market size and forecast 2025-2030 ($ thousand)
Data Table on Burgers - Market size and forecast 2025-2030 ($ thousand)
Chart on Burgers - Year-over-year growth 2025-2030 (%)
Data Table on Burgers - Year-over-year growth 2025-2030 (%)

10.5 Meatballs - Market size and forecast 2025-2030

Chart on Meatballs - Market size and forecast 2025-2030 ($ thousand)
Data Table on Meatballs - Market size and forecast 2025-2030 ($ thousand)
Chart on Meatballs - Year-over-year growth 2025-2030 (%)
Data Table on Meatballs - Year-over-year growth 2025-2030 (%)

10.6 Sausages - Market size and forecast 2025-2030

Chart on Sausages - Market size and forecast 2025-2030 ($ thousand)
Data Table on Sausages - Market size and forecast 2025-2030 ($ thousand)
Chart on Sausages - Year-over-year growth 2025-2030 (%)
Data Table on Sausages - Year-over-year growth 2025-2030 (%)

10.7 Hot Dogs - Market size and forecast 2025-2030

Chart on Hot Dogs - Market size and forecast 2025-2030 ($ thousand)
Data Table on Hot Dogs - Market size and forecast 2025-2030 ($ thousand)
Chart on Hot Dogs - Year-over-year growth 2025-2030 (%)
Data Table on Hot Dogs - Year-over-year growth 2025-2030 (%)

10.8 Market opportunity by Application

Market opportunity by Application ($ thousand)
Data Table on Market opportunity by Application ($ thousand)

11. Customer Landscape

11.1 Customer landscape overview

Analysis of price sensitivity, lifecycle, customer purchase basket, adoption rates, and purchase criteria

12. Geographic Landscape

12.1 Geographic segmentation

Chart on Market share by geography 2025-2030 (%)
Data Table on Market share by geography 2025-2030 (%)

12.2 Geographic comparison

Chart on Geographic comparison
Data Table on Geographic comparison

12.3 North America - Market size and forecast 2025-2030

Chart on North America - Market size and forecast 2025-2030 ($ thousand)
Data Table on North America - Market size and forecast 2025-2030 ($ thousand)
Chart on North America - Year-over-year growth 2025-2030 (%)
Data Table on North America - Year-over-year growth 2025-2030 (%)
Chart on Regional Comparison - North America
Data Table on Regional Comparison - North America

12.3.1 US - Market size and forecast 2025-2030

Chart on US - Market size and forecast 2025-2030 ($ thousand)
Data Table on US - Market size and forecast 2025-2030 ($ thousand)
Chart on US - Year-over-year growth 2025-2030 (%)
Data Table on US - Year-over-year growth 2025-2030 (%)

12.3.2 Canada - Market size and forecast 2025-2030

Chart on Canada - Market size and forecast 2025-2030 ($ thousand)
Data Table on Canada - Market size and forecast 2025-2030 ($ thousand)
Chart on Canada - Year-over-year growth 2025-2030 (%)
Data Table on Canada - Year-over-year growth 2025-2030 (%)

12.3.3 Mexico - Market size and forecast 2025-2030

Chart on Mexico - Market size and forecast 2025-2030 ($ thousand)
Data Table on Mexico - Market size and forecast 2025-2030 ($ thousand)
Chart on Mexico - Year-over-year growth 2025-2030 (%)
Data Table on Mexico - Year-over-year growth 2025-2030 (%)

12.4 Europe - Market size and forecast 2025-2030

Chart on Europe - Market size and forecast 2025-2030 ($ thousand)
Data Table on Europe - Market size and forecast 2025-2030 ($ thousand)
Chart on Europe - Year-over-year growth 2025-2030 (%)
Data Table on Europe - Year-over-year growth 2025-2030 (%)
Chart on Regional Comparison - Europe
Data Table on Regional Comparison - Europe

12.4.1 The Netherlands - Market size and forecast 2025-2030

Chart on The Netherlands - Market size and forecast 2025-2030 ($ thousand)
Data Table on The Netherlands - Market size and forecast 2025-2030 ($ thousand)
Chart on The Netherlands - Year-over-year growth 2025-2030 (%)
Data Table on The Netherlands - Year-over-year growth 2025-2030 (%)

12.4.2 UK - Market size and forecast 2025-2030

Chart on UK - Market size and forecast 2025-2030 ($ thousand)
Data Table on UK - Market size and forecast 2025-2030 ($ thousand)
Chart on UK - Year-over-year growth 2025-2030 (%)
Data Table on UK - Year-over-year growth 2025-2030 (%)

12.4.3 Germany - Market size and forecast 2025-2030

Chart on Germany - Market size and forecast 2025-2030 ($ thousand)
Data Table on Germany - Market size and forecast 2025-2030 ($ thousand)
Chart on Germany - Year-over-year growth 2025-2030 (%)
Data Table on Germany - Year-over-year growth 2025-2030 (%)

12.4.4 France - Market size and forecast 2025-2030

Chart on France - Market size and forecast 2025-2030 ($ thousand)
Data Table on France - Market size and forecast 2025-2030 ($ thousand)
Chart on France - Year-over-year growth 2025-2030 (%)
Data Table on France - Year-over-year growth 2025-2030 (%)

12.4.5 Italy - Market size and forecast 2025-2030

Chart on Italy - Market size and forecast 2025-2030 ($ thousand)
Data Table on Italy - Market size and forecast 2025-2030 ($ thousand)
Chart on Italy - Year-over-year growth 2025-2030 (%)
Data Table on Italy - Year-over-year growth 2025-2030 (%)

12.4.6 Spain - Market size and forecast 2025-2030

Chart on Spain - Market size and forecast 2025-2030 ($ thousand)
Data Table on Spain - Market size and forecast 2025-2030 ($ thousand)
Chart on Spain - Year-over-year growth 2025-2030 (%)
Data Table on Spain - Year-over-year growth 2025-2030 (%)

12.5 APAC - Market size and forecast 2025-2030

Chart on APAC - Market size and forecast 2025-2030 ($ thousand)
Data Table on APAC - Market size and forecast 2025-2030 ($ thousand)
Chart on APAC - Year-over-year growth 2025-2030 (%)
Data Table on APAC - Year-over-year growth 2025-2030 (%)
Chart on Regional Comparison - APAC
Data Table on Regional Comparison - APAC

12.5.1 China - Market size and forecast 2025-2030

Chart on China - Market size and forecast 2025-2030 ($ thousand)
Data Table on China - Market size and forecast 2025-2030 ($ thousand)
Chart on China - Year-over-year growth 2025-2030 (%)
Data Table on China - Year-over-year growth 2025-2030 (%)

12.5.2 Japan - Market size and forecast 2025-2030

Chart on Japan - Market size and forecast 2025-2030 ($ thousand)
Data Table on Japan - Market size and forecast 2025-2030 ($ thousand)
Chart on Japan - Year-over-year growth 2025-2030 (%)
Data Table on Japan - Year-over-year growth 2025-2030 (%)

12.5.3 South Korea - Market size and forecast 2025-2030

Chart on South Korea - Market size and forecast 2025-2030 ($ thousand)
Data Table on South Korea - Market size and forecast 2025-2030 ($ thousand)
Chart on South Korea - Year-over-year growth 2025-2030 (%)
Data Table on South Korea - Year-over-year growth 2025-2030 (%)

12.5.4 Australia - Market size and forecast 2025-2030

Chart on Australia - Market size and forecast 2025-2030 ($ thousand)
Data Table on Australia - Market size and forecast 2025-2030 ($ thousand)
Chart on Australia - Year-over-year growth 2025-2030 (%)
Data Table on Australia - Year-over-year growth 2025-2030 (%)

12.5.5 India - Market size and forecast 2025-2030

Chart on India - Market size and forecast 2025-2030 ($ thousand)
Data Table on India - Market size and forecast 2025-2030 ($ thousand)
Chart on India - Year-over-year growth 2025-2030 (%)
Data Table on India - Year-over-year growth 2025-2030 (%)

12.5.6 Indonesia - Market size and forecast 2025-2030

Chart on Indonesia - Market size and forecast 2025-2030 ($ thousand)
Data Table on Indonesia - Market size and forecast 2025-2030 ($ thousand)
Chart on Indonesia - Year-over-year growth 2025-2030 (%)
Data Table on Indonesia - Year-over-year growth 2025-2030 (%)

12.6 Middle East and Africa - Market size and forecast 2025-2030

Chart on Middle East and Africa - Market size and forecast 2025-2030 ($ thousand)
Data Table on Middle East and Africa - Market size and forecast 2025-2030 ($ thousand)
Chart on Middle East and Africa - Year-over-year growth 2025-2030 (%)
Data Table on Middle East and Africa - Year-over-year growth 2025-2030 (%)
Chart on Regional Comparison - Middle East and Africa
Data Table on Regional Comparison - Middle East and Africa

12.6.1 Israel - Market size and forecast 2025-2030

Chart on Israel - Market size and forecast 2025-2030 ($ thousand)
Data Table on Israel - Market size and forecast 2025-2030 ($ thousand)
Chart on Israel - Year-over-year growth 2025-2030 (%)
Data Table on Israel - Year-over-year growth 2025-2030 (%)

12.6.2 UAE - Market size and forecast 2025-2030

Chart on UAE - Market size and forecast 2025-2030 ($ thousand)
Data Table on UAE - Market size and forecast 2025-2030 ($ thousand)
Chart on UAE - Year-over-year growth 2025-2030 (%)
Data Table on UAE - Year-over-year growth 2025-2030 (%)

12.6.3 Saudi Arabia - Market size and forecast 2025-2030

Chart on Saudi Arabia - Market size and forecast 2025-2030 ($ thousand)
Data Table on Saudi Arabia - Market size and forecast 2025-2030 ($ thousand)
Chart on Saudi Arabia - Year-over-year growth 2025-2030 (%)
Data Table on Saudi Arabia - Year-over-year growth 2025-2030 (%)

12.6.4 South Africa - Market size and forecast 2025-2030

Chart on South Africa - Market size and forecast 2025-2030 ($ thousand)
Data Table on South Africa - Market size and forecast 2025-2030 ($ thousand)
Chart on South Africa - Year-over-year growth 2025-2030 (%)
Data Table on South Africa - Year-over-year growth 2025-2030 (%)

12.6.5 Turkey - Market size and forecast 2025-2030

Chart on Turkey - Market size and forecast 2025-2030 ($ thousand)
Data Table on Turkey - Market size and forecast 2025-2030 ($ thousand)
Chart on Turkey - Year-over-year growth 2025-2030 (%)
Data Table on Turkey - Year-over-year growth 2025-2030 (%)

12.7 South America - Market size and forecast 2025-2030

Chart on South America - Market size and forecast 2025-2030 ($ thousand)
Data Table on South America - Market size and forecast 2025-2030 ($ thousand)
Chart on South America - Year-over-year growth 2025-2030 (%)
Data Table on South America - Year-over-year growth 2025-2030 (%)
Chart on Regional Comparison - South America
Data Table on Regional Comparison - South America

12.7.1 Brazil - Market size and forecast 2025-2030

Chart on Brazil - Market size and forecast 2025-2030 ($ thousand)
Data Table on Brazil - Market size and forecast 2025-2030 ($ thousand)
Chart on Brazil - Year-over-year growth 2025-2030 (%)
Data Table on Brazil - Year-over-year growth 2025-2030 (%)

12.7.2 Argentina - Market size and forecast 2025-2030

Chart on Argentina - Market size and forecast 2025-2030 ($ thousand)
Data Table on Argentina - Market size and forecast 2025-2030 ($ thousand)
Chart on Argentina - Year-over-year growth 2025-2030 (%)
Data Table on Argentina - Year-over-year growth 2025-2030 (%)

12.7.3 Colombia - Market size and forecast 2025-2030

Chart on Colombia - Market size and forecast 2025-2030 ($ thousand)
Data Table on Colombia - Market size and forecast 2025-2030 ($ thousand)
Chart on Colombia - Year-over-year growth 2025-2030 (%)
Data Table on Colombia - Year-over-year growth 2025-2030 (%)

12.8 Market opportunity by geography

Market opportunity by geography ($ thousand)
Data Tables on Market opportunity by geography ($ thousand)

13. Drivers, Challenges, and Opportunity

13.1 Market drivers

Ethical and environmental sustainability imperatives driving cultured meat market
Technological innovations in serum-free growth media and industrial bioprocessing
Strategic capital inflow and collaborative alliances across value chain

13.2 Market challenges

Prohibitive capital outlays and capital intensity of scaled infrastructure
Regulatory complexities and fragmented global approval protocols
Consumer ambivalence, sensory fidelity challenges, and market acceptance limits

13.3 Impact of drivers and challenges

Impact of drivers and challenges in 2025 and 2030

13.4 Market opportunities

Regulatory harmonization and accelerated novel food approval frameworks
Commercialization via hybrid formulations and sensory optimization
Decentralized biomanufacturing networks and downstream integration

14. Competitive Landscape

14.1 Overview

14.2

Overview on criticality of inputs and factors of differentiation

14.3 Landscape disruption

Overview on factors of disruption

14.4 Industry risks

Impact of key risks on business

15. Competitive Analysis

15.1 Companies profiled

Companies covered

15.2 Company ranking index

15.3 Market positioning of companies

Matrix on companies position and classification

15.4 Aleph Farms Ltd.

Aleph Farms Ltd. - Overview
Aleph Farms Ltd. - Product / Service
Aleph Farms Ltd. - Key offerings
SWOT

15.5 BlueNalu Inc.

BlueNalu Inc. - Overview
BlueNalu Inc. - Product / Service
BlueNalu Inc. - Key offerings
SWOT

15.6 Bluu GMBH

Bluu GMBH - Overview
Bluu GMBH - Product / Service
Bluu GMBH - Key offerings
SWOT

15.7 CELLMEAT CO. LTD

CELLMEAT CO. LTD - Overview
CELLMEAT CO. LTD - Product / Service
CELLMEAT CO. LTD - Key offerings
SWOT

15.8 Clever Carnivore

Clever Carnivore - Overview
Clever Carnivore - Product / Service
Clever Carnivore - Key offerings
SWOT

15.9 Finless Foods Inc.

Finless Foods Inc. - Overview
Finless Foods Inc. - Product / Service
Finless Foods Inc. - Key offerings
SWOT

15.10 Fork and Good Inc

Fork and Good Inc - Overview
Fork and Good Inc - Product / Service
Fork and Good Inc - Key offerings
SWOT

15.11 GOOD Meat

GOOD Meat - Overview
GOOD Meat - Product / Service
GOOD Meat - Key offerings
SWOT

15.12 Mission Barns

Mission Barns - Overview
Mission Barns - Product / Service
Mission Barns - Key offerings
SWOT

15.13 Mosa Meat BV

Mosa Meat BV - Overview
Mosa Meat BV - Product / Service
Mosa Meat BV - Key offerings
SWOT

15.14 SuperMeat

SuperMeat - Overview
SuperMeat - Product / Service
SuperMeat - Key offerings
SWOT

15.15 Upside Foods Inc.

Upside Foods Inc. - Overview
Upside Foods Inc. - Product / Service
Upside Foods Inc. - Key offerings
SWOT

15.16 Vital Meat

Vital Meat - Overview
Vital Meat - Product / Service
Vital Meat - Key offerings
SWOT

15.17 Vow

Vow - Overview
Vow - Product / Service
Vow - Key offerings
SWOT

15.18 Wildtype

Wildtype - Overview
Wildtype - Product / Service
Wildtype - Key offerings
SWOT

16. Appendix

16.1 Scope of the report

Market definition
Objectives
Notes and caveats

16.2 Inclusions and exclusions checklist

Inclusions checklist
Exclusions checklist

16.3 Currency conversion rates for US$

16.4 Research methodology

16.5 Data procurement

Information sources

16.6 Data validation

16.7 Validation techniques employed for market sizing

16.8 Data synthesis

16.9 360 degree market analysis

16.10 List of abbreviations

Research Methodology

Technavio presents a detailed picture of the market by way of study, synthesis, and summation of data from multiple sources. The analysts have presented the various facets of the market with a particular focus on identifying the key industry influencers. The data thus presented is comprehensive, reliable, and the result of extensive research, both primary and secondary.

INFORMATION SOURCES

Primary sources

  • Manufacturers and suppliers
  • Channel partners
  • Industry experts
  • Strategic decision makers

Secondary sources

  • Industry journals and periodicals
  • Government data
  • Financial reports of key industry players
  • Historical data
  • Press releases

DATA ANALYSIS

Data Synthesis

  • Collation of data
  • Estimation of key figures
  • Analysis of derived insights

Data Validation

  • Triangulation with data models
  • Reference against proprietary databases
  • Corroboration with industry experts

REPORT WRITING

Qualitative

  • Market drivers
  • Market challenges
  • Market trends
  • Five forces analysis

Quantitative

  • Market size and forecast
  • Market segmentation
  • Geographical insights
  • Competitive landscape

Interested in this report?

Get your sample now to see our research methodology and insights!

Download Now

Frequently Asked Questions

Cultured Meat market growth will increase by USD 489164.5 thousand thousand during 2026-2030.

The Cultured Meat market is expected to grow at a CAGR of 19.1% during 2026-2030.

Cultured Meat market is segmented by Source (Poultry, Beef, Seafood, Pork, Duck) End-user (Foodservice, Food manufacturers, Retail, Research institutes) Application (Nuggets, Burgers, Meatballs, Sausages, Hot Dogs)

Aleph Farms Ltd., BlueNalu Inc., Bluu GMBH, CELLMEAT CO. LTD, Clever Carnivore, Finless Foods Inc., Fork and Good Inc, Forsea, GOOD Meat, Gourmey, Ivy Farm, Magic Valley, Mission Barns, Mosa Meat BV, SuperMeat, Upside Foods Inc., Vital Meat, Vow, Wanda Fish, Wildtype are a few of the key vendors in the Cultured Meat market.

North America will register the highest growth rate of 32.7% among the other regions. Therefore, the Cultured Meat market in North America is expected to garner significant business opportunities for the vendors during the forecast period.

US, Canada, Mexico, The Netherlands, UK, Germany, France, Italy, Spain, China, Japan, South Korea, Australia, India, Indonesia, Israel, UAE, Saudi Arabia, South Africa, Turkey, Brazil, Argentina, Colombia

  • Ethical and environmental sustainability imperatives driving cultured meat market is the driving factor this market.

The Cultured Meat market vendors should focus on grabbing business opportunities from the Source segment as it accounted for the largest market share in the base year.
RIA - Research AI Assistant
Ask RIA
