Cultured Wheat Market Size 2025-2029
The cultured wheat market size is forecast to increase by USD 230.7 million at a CAGR of 6.8% between 2024 and 2029.
- The market is experiencing significant growth, driven primarily by the increasing consumer preference for healthier alternatives to traditional wheat products. This trend is being fueled by rising awareness regarding the health benefits of cultured wheat and its potential to address common wheat intolerances. Furthermore, technological advancements in the agriculture sector are enabling the large-scale production of cultured wheat, making it a more viable and accessible option for consumers. However, market expansion is not without challenges. Stringent regulations on food products, particularly those related to labeling and safety, can impact adoption and require careful navigation by market participants. Additionally, supply chain inconsistencies can temper growth potential, as ensuring a steady and reliable supply of cultured wheat is crucial for meeting demand and maintaining customer satisfaction. The segment is expected to witness notable expansion due to its increasing use in various industries, including food and animal feed.
- Companies seeking to capitalize on market opportunities and navigate these challenges effectively must stay informed of regulatory requirements and invest in robust supply chain management strategies. Furthermore, North America actively contributes to the market by embracing innovative and sustainable food alternatives and vegan fast.
What will be the Size of the Cultured Wheat Market during the forecast period?
- In the market, supply chain management plays a crucial role in ensuring the efficient production and distribution of cultured grains. Microbial fermentation techniques are utilized to enhance the nutrient bioavailability and antioxidant properties of these grains, making them a popular choice among consumers. Food trends, driven by consumer insights, favor the use of digestive enzymes and flavor compounds in cultured wheat products. Distribution channels continue to evolve, with online retail becoming increasingly significant. Food safety regulations mandate rigorous testing for food allergens and sensitivities, necessitating brand positioning as a key differentiator. Ethical sourcing and sustainability initiatives, such as circular economy and food waste reduction, are gaining traction. The agriculture market encompasses a diverse range of commodities, including grains such as wheat, as well as fruits and vegetables like grapes, bananas, apples, limes, lemons, pears, onions, carrots, peppers, chilies, beans, turnips, oranges, peaches, avocados, and strawberries.
- Fermentation processes also contribute to the production of leavening agents, which are essential for baking applications. Ingredient sourcing, market research, and pricing strategies are critical factors influencing the competitiveness of cultured wheat brands. The gut microbiome's role in food safety and consumer health further s the importance of food traceability and product labeling. Antioxidant properties, food safety, and ethical sourcing are key considerations for consumers, shaping the market dynamics. Cultured wheat's potential as a sustainable and nutrient-rich alternative to traditional grains is driving growth in the sector. Pricing strategies and sustainability initiatives are crucial elements in the circular economy, ensuring long-term market success. Soya beans are rich in high-quality protein, which helps reduce the risk of various health issues, including cardiovascular disease, stroke, and coronary heart disease (CHD), as well as certain cancers and bone health problems.
How is this Cultured Wheat Industry segmented?
The cultured wheat industry research report provides comprehensive data (region-wise segment analysis), with forecasts and estimates in "USD million" for the period 2025-2029, as well as historical data from 2019-2023 for the following segments.
- Type
- Organic
- Conventional
- Distribution Channel
- Offline
- Online
- Product Type
- Lab-grown wheat
- Cell culture wheat
- Technology
- Tissue engineering
- Fermentation-based wheat
- Geography
- North America
- US
- Canada
- Mexico
- Europe
- France
- Germany
- Italy
- UK
- APAC
- China
- India
- Japan
- Rest of World (ROW)
- North America
By Type Insights
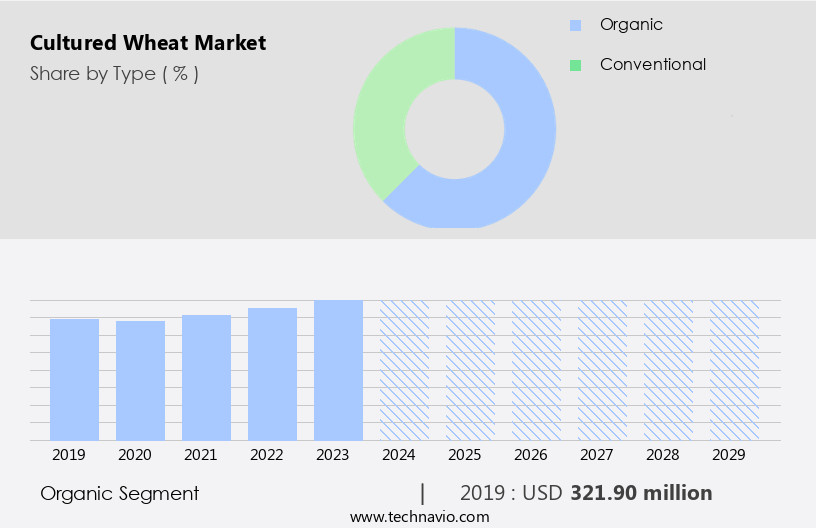
The organic segment is estimated to witness significant growth during the forecast period. The market is experiencing significant growth due to the rising consumer demand for dietary fiber-rich functional food options. Whole grain and whole wheat bread, made with cultured wheat, are popular choices for health-conscious consumers seeking improved digestive health and enhanced nutritional value. Product innovation in the form of bread alternatives, such as pizza dough and artisan bread, has also gained traction. Processing methods, including the use of lactic acid bacteria and yeast starters, ensure extended shelf life and consistent flavor profiles. Consumer preferences for sustainable agriculture and gut health have the market forward. Sustainable farming practices and the use of organic grains in cultured wheat production align with these preferences. Farmers in Argentina express interest in advanced technologies, such as GPS, but most lack the financial resources for such investments. High-quality fertilizers are valued, yet often unavailable due to low agricultural market profits.
Food manufacturers are responding by introducing innovative products and improving processing methods to meet these evolving consumer demands. The market's dynamics continue to shift as the demand for cultured wheat-based products grows.
The Organic segment was valued at USD 321.90 million in 2019 and showed a gradual increase during the forecast period. Moreover, the increasing popularity of grain-free and specialty breads has broadened the market scope. Food safety and quality control are paramount for food manufacturers, ensuring the production of safe and nutritious products. Bakery industry players are focusing on improving dough development and baking time to cater to the diverse consumer base. Sourdough bread, with its unique flavor profile and superior nutritional value, is a notable trend. Sprouted bread, another emerging trend, offers additional health benefits and longer shelf life. Proper storage conditions are essential to maintain the quality and freshness of cultured wheat products. The market is driven by consumer preferences for healthier, more sustainable food options, with a focus on digestive health, nutritional value, and flavor profile.
Regional Analysis
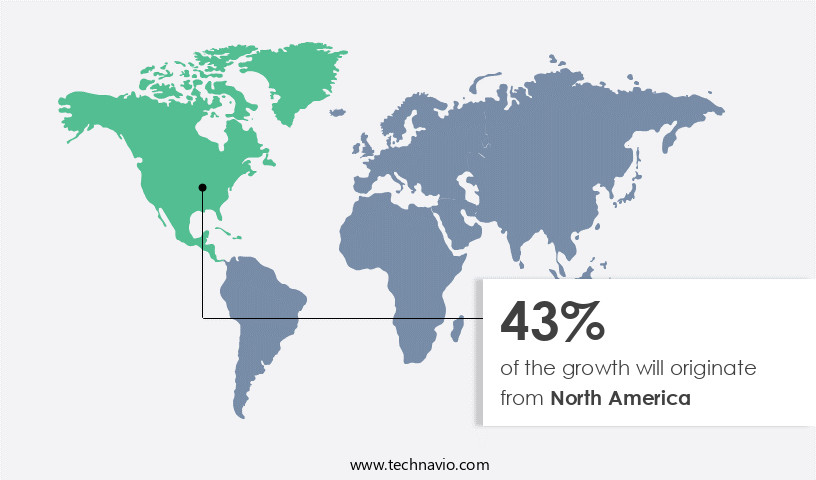
North America is estimated to contribute 43% to the growth of the global market during the forecast period.Technavio's analysts have elaborately explained the regional trends and drivers that shape the market during the forecast period.
The market in North America is experiencing significant growth due to increasing consumer demand for healthier and sustainable food alternatives. This region is at the forefront of innovation in the food industry, with companies investing in research and development to create a diverse range of cultured wheat products. These offerings include bread, pasta, and snacks, catering to various consumer preferences for whole grain, lactic acid bacteria, and protein-rich options. Whole wheat bread and sourdough bread are popular choices, while grain-free and sprouted bread are also gaining traction. The use of cultured wheat in dough development enhances the nutritional value and shelf life of these products.
Sustainable agriculture practices and food safety measures are essential considerations for food manufacturers, ensuring the highest quality and consumer trust. Consumer preferences for digestive health and gut health are driving the demand for cultured wheat products, which offer superior flavor profiles and longer baking times compared to traditional wheat. The bakery industry is embracing these trends, with artisan bread and specialty breads becoming increasingly popular. Overall, the market in North America is poised for continued growth, driven by consumer preferences, product innovation, and processing methods that prioritize health and wellness.
Market Dynamics
Our researchers analyzed the data with 2024 as the base year, along with the key drivers, trends, and challenges. A holistic analysis of drivers will help companies refine their marketing strategies to gain a competitive advantage.
What are the Cultured Wheat market drivers leading to the rise in the adoption of Industry?
- The increasing consumer preference for healthier options in place of conventional wheat products serves as the primary market catalyst. The market is witnessing significant growth due to increasing consumer preference for healthier alternatives to traditional wheat products. Instead of refined wheat flour bread, consumers are gravitating towards cultured products like whole grain and sourdough bread. The fermentation process used in producing these breads not only enhances their nutritional value but also improves digestibility. Lactic acid bacteria, which are active during fermentation, help break down gluten and phytic acid, making the bread easier to digest. Furthermore, these bacteria contribute to a unique flavor profile.
- Beyond bread, cultured wheat is being utilized in the production of specialty foods, such as probiotic-enriched snacks and beverages. These functional foods offer additional health benefits by incorporating live cultures that promote gut health and boost the immune system. Sustainable agriculture practices are also gaining popularity in the production of cultured wheat, adding to its appeal for health-conscious consumers.
What are the Cultured Wheat market trends shaping the Industry?
- The agricultural sector is experiencing significant technological advancements, which has become a notable market trend. Innovations in farming technology are increasingly shaping the industry, with a focus on improving efficiency, productivity, and sustainability. The market has experienced significant growth due to advancements in agriculture technology. Precision farming techniques and modern machinery have increased wheat production efficiency, resulting in higher yields and meeting the global demand. Additionally, the development of genetically modified wheat varieties with enhanced pest and disease resistance has boosted crop resilience, reducing potential yield losses. Innovations in irrigation systems and data analytics have optimized water usage and resource management, positively influencing wheat cultivation. Consumer preferences for digestive health and the production of artisan bread have also driven market growth. Another trend is the growing focus on horticulture and specialty seeds, as consumer preferences shift towards healthier and more diverse food options Cultured wheat, which involves the use of a yeast starter in the fermentation process, offers superior taste and texture to traditional bread.
- Moreover, the protein content in cultured wheat is higher than that of regular wheat, leading to longer baking times. Food safety concerns have been addressed through rigorous testing and quality control measures, ensuring the production of safe and healthy bread products. Sprouted bread, another variant of cultured wheat, offers additional health benefits, further expanding the market's appeal.
How does Cultured Wheat market faces challenges face during its growth?
- The stringent regulations governing the food industry pose a significant challenge to its growth, requiring companies to adhere to rigorous standards in order to ensure product safety and consumer protection. The market faces regulatory challenges due to stringent government and food safety regulations in various countries. These regulations impact new product launches, market entry, product specifications, sales, marketing, and advertising. For instance, in July 2018, India's Food Safety and Standards Authority of India (FSSAI) introduced new regulations for organic packaged foods, including wheat-based staples. These regulations require compliance with the National Program for Organic Production (NPOP) administered by the Indian government. Adhering to these diverse regulations can pose a significant challenge for market participants.
- In the bakery industry and among food manufacturers prioritizing gut health and health and wellness trends, cultured wheat offers benefits. Quality control is crucial to maintain consistency and meet regulatory requirements. Companies must navigate these regulations to ensure the production and distribution of high-quality cultured wheat products.
Exclusive Customer Landscape
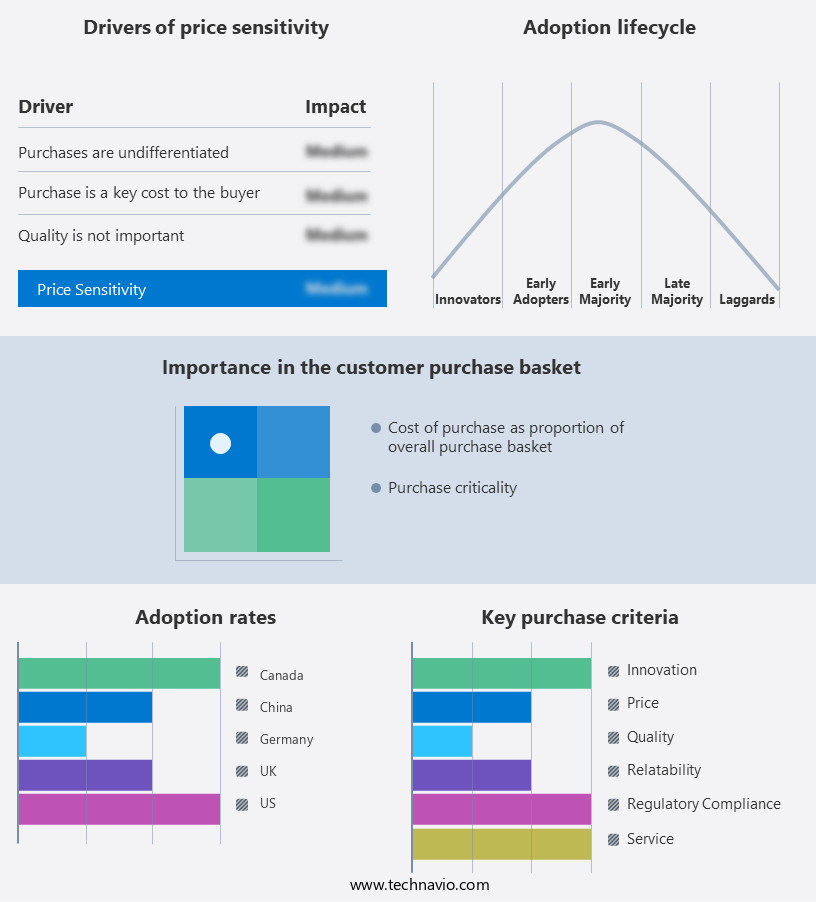
The cultured wheat market forecasting report includes the adoption lifecycle of the market, covering from the innovator's stage to the laggard's stage. It focuses on adoption rates in different regions based on penetration. Furthermore, the cultured wheat market report also includes key purchase criteria and drivers of price sensitivity to help companies evaluate and develop their market growth analysis strategies.
Customer Landscape
Key Companies & Market Insights
Companies are implementing various strategies, such as strategic alliances, cultured wheat market forecast, partnerships, mergers and acquisitions, geographical expansion, and product/service launches, to enhance their presence in the industry.
Brolite Products Inc. - The company specializes in the production of a diverse range of cultured wheats, including BREAD FLAVOR R, BRO RYE SOUR, BROLITE 1A, Butter Burst, Dark RYE SOUR, and FFP WHITE SOUR.
The industry research and growth report includes detailed analyses of the competitive landscape of the market and information about key companies, including:
- Brolite Products Inc.
- Cain Food Industries Inc.
- Corbion N.V.
- Groupe Limagrain
- J and K Ingredients
- Jiangsu Boli Bioproducts Co. Ltd.
- Kerry Group Plc
- Lesaffre Corp.
- Mezzoni Foods Inc.
- Puratos NV SA
Qualitative and quantitative analysis of companies has been conducted to help clients understand the wider business environment as well as the strengths and weaknesses of key industry players. Data is qualitatively analyzed to categorize companies as pure play, category-focused, industry-focused, and diversified; it is quantitatively analyzed to categorize companies as dominant, leading, strong, tentative, and weak.
Recent Development and News in Cultured Wheat Market
- In February 2024, General Mills, a leading food company, announced the launch of its new line of cultured wheat products under the brand name "RePlant." This innovation marks a significant step in the market, as it is the first major food corporation to commercially introduce cultured wheat products to the market (General Mills Press Release, 2024).
- In May 2025, DuPont Nutrition & Biosciences, a global biotechnology company, entered into a strategic partnership with Perfect Day, a California-based food technology firm, to co-develop and commercialize cultured wheat proteins. This collaboration is expected to accelerate the market growth by combining DuPont's expertise in plant-based protein production with Perfect Day's proprietary precision fermentation technology (DuPont Nutrition & Biosciences Press Release, 2025).
- In July 2024, Cargill, a global food and agriculture company, invested USD100 million in Memphis Meats, a leading cellular agriculture company, to expand its capacity for producing cultured meat and plant-based proteins, including cultured wheat. This investment is a clear indication of the growing interest and commitment of traditional agribusiness players in the market (Cargill Press Release, 2024).
- In November 2025, the European Commission approved the use of cultured wheat proteins as novel foods, paving the way for their commercialization in Europe. This approval marks a significant milestone for the market, as Europe is a major consumer market for plant-based proteins (European Commission Press Release, 2025).
Research Analyst Overview
The market continues to evolve, driven by consumer preferences for functional food and bread alternatives. Dough development and processing methods are key areas of innovation, with a focus on improving nutritional value, digestive health, and flavor profile. Whole wheat and whole grain breads remain popular, as consumers seek out products with increased dietary fiber and lactic acid bacteria for gut health benefits. Shelf life and food safety are critical concerns for both bakeries and food manufacturers. Innovations in baking time and storage conditions are essential to maintain product quality and consumer satisfaction. The market for artisan bread and specialty breads is growing, as consumers seek out unique and authentic flavors.
Protein content is another area of interest, with grain-free breads and other high-protein alternatives gaining popularity. Sustainable agriculture practices are also increasingly important, as consumers demand transparency and accountability in their food sources. Yeast starters and sprouted bread are also gaining traction, as they offer unique textures and flavors, as well as potential health benefits. The bakery industry is continually adapting to meet these evolving consumer demands, with a focus on product innovation, quality control, and health and wellness.
Dive into Technavio's robust research methodology, blending expert interviews, extensive data synthesis, and validated models for unparalleled Cultured Wheat Market insights. See full methodology.
|
Market Scope |
|
|
Report Coverage |
Details |
|
Page number |
213 |
|
Base year |
2024 |
|
Historic period |
2019-2023 |
|
Forecast period |
2025-2029 |
|
Growth momentum & CAGR |
Accelerate at a CAGR of 6.8% |
|
Market growth 2025-2029 |
USD 230.7 million |
|
Market structure |
Concentrated |
|
YoY growth 2024-2025(%) |
6.3 |
|
Key countries |
US, Germany, UK, Canada, China, France, Italy, Mexico, Japan, and India |
|
Competitive landscape |
Leading Companies, Market Positioning of Companies, Competitive Strategies, and Industry Risks |
What are the Key Data Covered in this Cultured Wheat Market Research and Growth Report?
- CAGR of the Cultured Wheat industry during the forecast period
- Detailed information on factors that will drive the growth and forecasting between 2025 and 2029
- Precise estimation of the size of the market and its contribution of the industry in focus to the parent market
- Accurate predictions about upcoming growth and trends and changes in consumer behaviour
- Growth of the market across North America, Europe, APAC, South America, and Middle East and Africa
- Thorough analysis of the market's competitive landscape and detailed information about companies
- Comprehensive analysis of factors that will challenge the cultured wheat market growth of industry companies
We can help! Our analysts can customize this cultured wheat market research report to meet your requirements.


