Cylindrical Lithium-Ion Battery Market Size 2025-2029
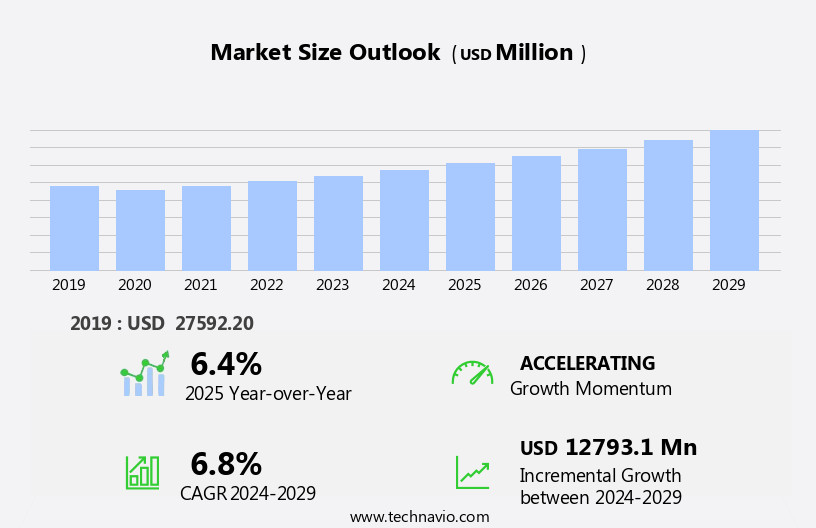
The cylindrical lithium-ion battery market size is forecast to increase by USD 12.79 billion, at a CAGR of 6.8% between 2024 and 2029. The market is experiencing significant shifts due to the automotive industry's transition towards electric vehicles (EVs). This trend is driving the demand for cylindrical lithium-ion batteries, as they are the preferred battery type for EV applications.
Major Market Trends & Insights
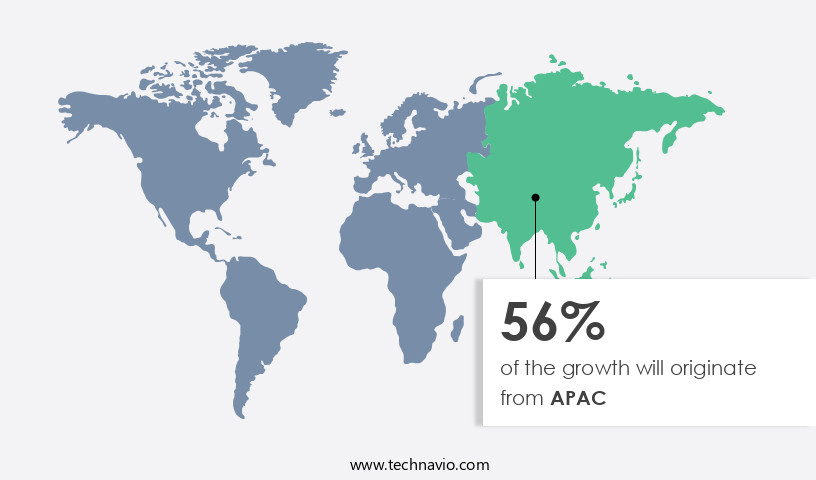
- APAC dominated the market and contributed 56% to the growth during the forecast period.
- The market is expected to grow significantly in North America region as well over the forecast period.
- Based on the Application, the Automotive segment led the market and was valued at USD 15.31 billion of the global revenue in 2023.
- Based on the Type, the Lithium nickel manganese cobalt segment accounted for the largest market revenue share in 2023.
Market Size & Forecast
- Market Opportunities: USD 65.32 Million
- Future Opportunities: USD 12.79 Billion
- CAGR (2024-2029): 6.8%
- APAC: Largest market in 2023
The market continues to evolve, driven by advancements in technology and increasing demand across various sectors. Fast charging standards are a key focus, with prismatic lithium-ion batteries gaining popularity due to their ability to support faster charging times. This trend is particularly notable in the electric scooter and e-bike industries, where convenience and quick turnaround are essential. Cathode material innovation is another significant market dynamic. New materials, such as lithium nickel manganese cobalt oxide (NMC) and lithium iron phosphate (LFP), offer improved energy density and longer cycle life. However, battery aging and failure modes remain concerns, with battery swapping and cell chemistry optimization being explored as potential solutions.
What will be the Size of the Cylindrical Lithium-Ion Battery Market during the forecast period?
Explore in-depth regional segment analysis with market size data - historical 2019-2023 and forecasts 2025-2029 - in the full report.
Request Free Sample
Battery testing, thermal management, and safety standards are crucial aspects of the manufacturing process. Cost analysis and supply chain optimization are also essential for market competitiveness. The integration of renewable energy sources and grid-scale energy storage is a growing trend, with power density and performance degradation being key considerations. The market's ongoing evolution is further influenced by regulatory compliance, energy density, and battery pack design. Machine learning and artificial intelligence are being employed to enhance battery performance and optimize charging infrastructure. The manufacturing process, from raw materials sourcing to battery pack assembly, is under constant scrutiny for quality control and carbon footprint reduction.
The continuous unfolding of market activities and evolving patterns in the market demonstrate its dynamic nature. From electric vehicles to electric scooters and renewable energy integration, the applications are diverse, and the challenges are numerous. The market's continuous evolution underscores the importance of staying informed and adaptable.
The market continues to evolve in various sectors. However, this growth comes with challenges. Safety concerns are at the forefront, with revisions in lithium-ion battery safety standards becoming increasingly stringent. These regulations aim to mitigate risks associated with battery fires and explosions. The challenges posed by these safety concerns necessitate continuous research and development efforts to ensure the production of safer and more reliable batteries. Additionally, ensuring compliance with these standards adds to the manufacturing costs, potentially impacting market competitiveness. Companies must navigate these challenges while also capitalizing on the market opportunities presented by the growing EV market.
How is this Cylindrical Lithium-Ion Battery Industry segmented?
The cylindrical lithium-ion battery industry research report provides comprehensive data (region-wise segment analysis), with forecasts and estimates in "USD million" for the period 2025-2029, as well as historical data from 2019-2023 for the following segments.
- Application
- Automotive
- Industrial
- Consumer Electronics
- Energy Storage Systems
- Power Tools
- Telecommunication
- Aerospace
- Medical Equipment
- Unmanned Aerial Vehicles
- Others
- Type
- Lithium nickel manganese cobalt
- Lithium titanate
- Lithium iron phosphate
- Lithium cobalt oxide
- Lithium Manganese Oxide
- Lithium Nickel Cobalt Aluminium Oxide (NCA)
- Cobalt-Manganese Mixture
- Ternary Lithium Batteries
- Geography
- North America
- US
- Canada
- Europe
- France
- Germany
- Middle East and Africa
- UAE
- APAC
- Australia
- China
- India
- Japan
- South Korea
- South America
- Brazil
- Rest of World (ROW)
- North America
By Application Insights
The automotive segment is estimated to witness significant growth during the forecast period. The segment was valued at USD 15.31 billion in 2023. It continued to the largest segment at a CAGR of 6.04%.
The market is witnessing significant growth, particularly in the automotive segment, which encompasses applications in electric vehicles (EVs) and electric bicycles (e-bikes). This expansion is driven by the advantages of cylindrical lithium-ion batteries over other chemistries, such as lead-acid and traditional batteries. These batteries offer higher energy density, superior performance, and longer cycle life, making them a more attractive choice for the electric transportation sector. Cylindrical lithium-ion batteries have achieved higher levels of regulatory compliance and production automation, ensuring greater security and weight reduction. Consequently, their production costs are lower than those of prismatic or laminate lithium-ion batteries, making them a preferred option for leading EV manufacturers like Tesla.
Raw materials sourcing and sustainability are essential considerations in the market. The industry is focusing on reducing the carbon footprint of battery production through the use of renewable energy integration and life cycle assessments. Data analytics and machine learning are also playing a crucial role in optimizing battery performance, managing thermal management, and predicting battery aging and failure modes. Fast charging standards and battery swapping are essential for the widespread adoption of EVs. Manufacturers are investing in charging infrastructure and developing advanced battery pack designs to accommodate these requirements. The market is also witnessing advancements in cell chemistry, anode and cathode materials, and current collectors to improve power density, energy efficiency, and safety standards.
The supply chain is a critical aspect of the market, with a focus on ensuring quality control and maintaining a reliable and sustainable source of raw materials. The market is also subject to various regulatory compliance requirements and safety standards to ensure the safety and reliability of the batteries. In conclusion, the market is experiencing robust growth, driven by the advantages of lithium-ion batteries over traditional chemistries and the increasing demand for electric transportation. Manufacturers are focusing on optimizing production processes, improving battery performance, and ensuring regulatory compliance to meet the evolving needs of the market.
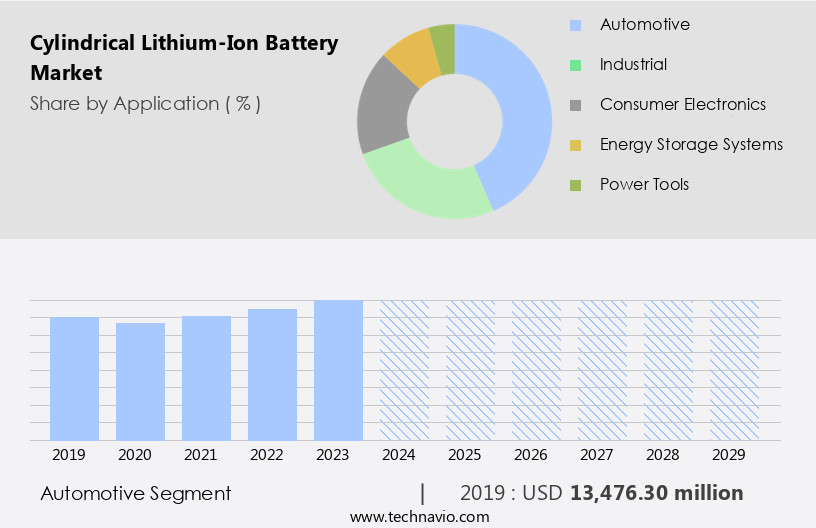
The Automotive segment was valued at USD 13.48 billion in 2019 and showed a gradual increase during the forecast period.
Regional Analysis
APAC is estimated to contribute 56% to the growth of the global market during the forecast period. Data suggests that the future opportunities for growth in the APAC region estimates to be around USD 16.12 billion. Technavio's analysts have elaborately explained the regional trends and drivers that shape the market during the forecast period.
The market is significantly influenced by several factors, with APAC leading the global scene due to its status as the primary manufacturing hub for these batteries. The region's dominance is further bolstered by the presence of a vast number of companies and end-users, including electric vehicle (EV) manufacturers, consumer electronics companies, and others. The automotive sector is the largest consumer of cylindrical lithium-ion batteries, contributing significantly to the market's growth. In the APAC region, rising living standards have led to increased consumer spending on premium items. Environmental concerns and regulatory compliance are crucial factors shaping the market.
Raw materials sourcing and life cycle assessment are essential aspects of manufacturing, with efforts underway to ensure sustainable sourcing and reduce the carbon footprint. Energy density, fast charging, and wireless charging are key features driving consumer demand. Prismatic lithium-ion batteries and electric scooters are emerging applications for this technology. Battery aging, battery swapping, and cell chemistry are critical elements of battery performance. Cost analysis, artificial intelligence (AI), and machine learning are essential tools for optimizing battery design, manufacturing, and performance. Safety standards, renewable energy integration, and power density are essential considerations for grid-scale energy storage. Quality control, supply chain, and fast charging standards are vital for maintaining consistency and efficiency in production.
Failure modes, thermal management, and battery pack design are essential aspects of battery performance and longevity. Anode and cathode materials, current collectors, and battery testing are crucial components of the manufacturing process. Performance degradation and power density are critical factors affecting battery efficiency and lifespan. The market is also witnessing advancements in battery technology, such as improvements in charging infrastructure and the integration of AI for predictive maintenance and optimization. In conclusion, the market is a dynamic and evolving landscape, driven by various factors, including technological advancements, consumer demand, and regulatory requirements. The market's future growth is expected to be influenced by factors such as the integration of renewable energy, advancements in battery chemistry, and the increasing adoption of electric vehicles and consumer electronics.
Market Dynamics
"The global Cylindrical Lithium-Ion Battery Market is driven by surging electric vehicle adoption, with Asia-Pacific leading due to its 56% market share in 2024."
- Rahul Somnath, Assistant Research Manager, Technavio
The market is a dynamic and growing sector in the global energy storage industry. These batteries, recognized for their cylindrical shape, offer several advantages over other battery types. Cylindrical lithium-ion batteries provide excellent energy density, enabling longer runtimes and lighter weight. Their design allows for efficient manufacturing processes and cost-effective production. Manufacturers prioritize safety in the market, implementing advanced safety features such as thermal runaway protection and pressure relief systems. These batteries are widely used in various applications, including electric vehicles, portable devices, and grid energy storage. The market benefits from ongoing research and development, driving innovation and improvements in performance, cost, and safety. Key players in the market invest in R&D to expand their product offerings and meet the evolving demands of consumers and industries. Advancements in materials science, such as the use of silicon anodes and solid-state electrolytes, contribute to the growth of the market. Additionally, government initiatives and incentives support the adoption of these batteries for sustainable energy solutions. The market is expected to experience significant growth due to its versatility, efficiency, and increasing demand for clean energy technologies. As the world transitions towards renewable energy sources and electric mobility, the role of cylindrical lithium-ion batteries becomes increasingly crucial.
What are the key market drivers leading to the rise in the adoption of Cylindrical Lithium-Ion Battery Industry?
- The transition in the automotive industry towards electric vehicles (EVs) serves as the primary catalyst for market growth.
- The market is experiencing significant growth due to the increasing popularity of electric vehicles (EVs) and the push for a more sustainable ecosystem in the automotive industry. Governments worldwide are implementing policies to reduce air pollution and vehicle emissions, making EVs an attractive alternative to conventional gasoline vehicles. On average, EVs emit half the greenhouse gases (GHGs) of gasoline vehicles, contributing to a substantial reduction in carbon footprint. As the demand for EVs rises, there is a growing focus on improving battery technology to enhance cycle life, energy density, and environmental sustainability. Raw materials sourcing and regulatory compliance are critical factors influencing the market.
- Data analytics and life cycle assessment are essential tools for optimizing battery performance and minimizing environmental impact. Quality control and supply chain management are crucial aspects of the market. Wireless charging technology is also gaining traction, offering convenience and reducing the need for physical charging infrastructure. Ensuring regulatory compliance, energy density, and quality control are essential to maintaining consumer trust and market competitiveness. Cylindrical lithium-ion batteries are expected to play a significant role in the decarbonization of the transport sector, making it an exciting and dynamic market to watch.
What are the market trends shaping the Cylindrical Lithium-Ion Battery Industry?
- Lithium-ion battery safety standards are undergoing revisions, representing a significant market trend in the professional battery industry. Ensuring enhanced safety measures is a crucial aspect of this evolution.
- Lithium-ion batteries have gained significant attention in various industries due to their high energy density and fast charging capabilities. The International Electrotechnical Commission (IEC), established in 1906, plays a crucial role in setting global battery standards, including those for lithium-ion batteries. These standards ensure uniformity and safety in battery designs and sizes. Fast charging standards are essential for electric vehicles, including scooters, and lithium-ion batteries have become the preferred choice due to their ability to charge quickly. Prismatic lithium-ion batteries, a common type, offer advantages such as improved safety and longer cycle life. However, like all battery technologies, they are subject to failure modes, such as thermal runaway and battery aging.
- Battery aging and failure can be mitigated through cell chemistry optimization and cost analysis. Battery swapping is another solution that has gained popularity in the electric vehicle market, allowing for quick battery replacement instead of lengthy charging times. Cathode materials, a critical component of lithium-ion batteries, are continually being researched and developed to improve battery performance and safety. Fast charging is a significant consideration for the adoption of lithium-ion batteries, especially in the electric scooter market. However, it's essential to balance charging speed with safety and battery life. Proper battery management systems and charging infrastructure are crucial to ensuring safe and efficient charging.
- In conclusion, the lithium-ion battery market is dynamic, with ongoing research and development focused on improving safety, performance, and cost-effectiveness. The IEC's role in setting global standards and the advancements in cell chemistry, charging infrastructure, and battery management systems are driving the growth and innovation in this market.
What challenges does the Cylindrical Lithium-Ion Battery Industry face during its growth?
- Lithium-ion battery safety concerns represent a significant challenge that necessitates continuous industry innovation to ensure growth and mitigate potential risks.
- Lithium-ion batteries, known for their high energy density and superior electrochemical performance, are extensively utilized in the automotive industry and various consumer electronic devices. However, these batteries pose safety concerns due to their susceptibility to leakage and membrane rupture, which may result in explosions or short-circuits. The batteries rely on electrolytes as a catalyst to function, but direct exposure to lithium metal can lead to safety issues, including fires and explosions, as per the International Air Transportation Association (IATA) guidelines. The overpacking of Lithium-ion batteries is prohibited by IATA. In response to these challenges, advancements in technology are being made.
- For instance, artificial intelligence (AI) and machine learning are being integrated into battery pack architecture for improved charging infrastructure and battery testing. Additionally, thermal management systems are being developed to mitigate overheating issues. Anode material research is ongoing to enhance battery performance and safety. These innovations aim to address the safety concerns associated with Lithium-ion batteries while preserving their energy density benefits.
Exclusive Customer Landscape
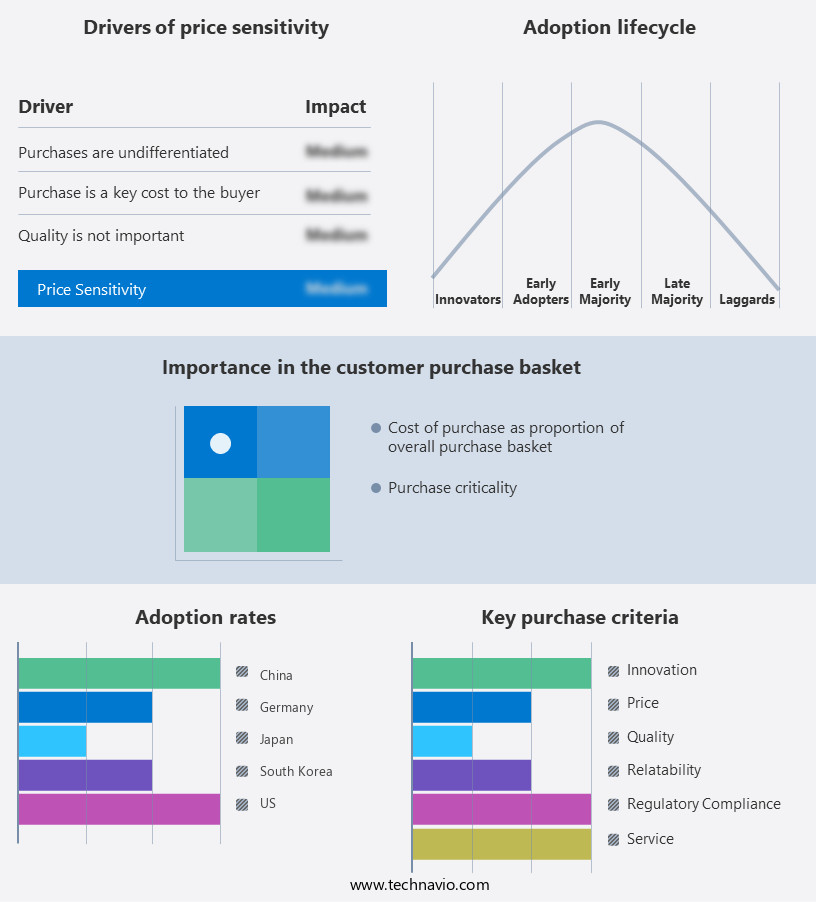
The cylindrical lithium-ion battery market forecasting report includes the adoption lifecycle of the market, covering from the innovator's stage to the laggard's stage. It focuses on adoption rates in different regions based on penetration. Furthermore, the cylindrical lithium-ion battery market report also includes key purchase criteria and drivers of price sensitivity to help companies evaluate and develop their market growth analysis strategies.
Customer Landscape
Key Companies & Market Insights
Companies are implementing various strategies, such as strategic alliances, cylindrical lithium-ion battery market forecast, partnerships, mergers and acquisitions, geographical expansion, and product/service launches, to enhance their presence in the industry.
Altertek Ltd. - The company specializes in advanced cylindrical lithium-ion battery solutions, featuring the innovative AKM CYC ultra high energy battery system.
The industry research and growth report includes detailed analyses of the competitive landscape of the market and information about key companies, including:
- Altertek Ltd.
- BorgWarner Inc.
- E One Moli Energy Corp.
- EVE Energy Co. Ltd.
- Hitachi Ltd.
- LG Chem Ltd.
- Lithion Power Group Ltd.
- Lithium Werks
- Murata Manufacturing Co. Ltd.
- Nanograf Corp.
- Northvolt AB
- OptimumNano Energy Co. Ltd.
- Panasonic Holdings Corp.
- PowerTech Systems
- Samsung SDI Co. Ltd.
- Sony Group Corp.
- TADIRAN BATTERIES Ltd.
- Tesla Inc.
- The Duracell Co.
- VARTA AG
Qualitative and quantitative analysis of companies has been conducted to help clients understand the wider business environment as well as the strengths and weaknesses of key industry players. Data is qualitatively analyzed to categorize companies as pure play, category-focused, industry-focused, and diversified; it is quantitatively analyzed to categorize companies as dominant, leading, strong, tentative, and weak.
Recent Development and News in Cylindrical Lithium-Ion Battery Market
- In January 2024, Tesla, a leading electric vehicle manufacturer, announced the expansion of its Gigafactory Shanghai, focusing on the production of cylindrical lithium-ion batteries. This expansion aimed to increase the factory's annual battery production capacity to 200 GWh by 2030 (Tesla Press Release).
- In March 2024, LG Chem, a major global battery manufacturer, entered into a strategic partnership with Ford Motor Company to supply cylindrical lithium-ion batteries for Ford's electric vehicles. This collaboration was expected to support Ford's electrification plans and help LG Chem expand its presence in the automotive market (Reuters).
- In May 2024, Contemporary Amperex Technology Co. Limited (CATL), the world's largest producer of lithium-ion batteries, raised USD 2.36 billion in a share sale. The proceeds were intended to support the company's research and development efforts, as well as its expansion into new markets (Bloomberg).
- In April 2025, Panasonic Corporation, a leading electronics company, received approval from the Japanese Ministry of Economy, Trade and Industry to begin construction of a new cylindrical lithium-ion battery production facility in Himeji, Japan. This project was expected to create an annual production capacity of 10 GWh (Nikkei Asia).
Research Analyst Overview
- In the dynamic market, temperature sensors play a crucial role in ensuring optimal battery performance and safety. Advanced design optimization, aided by material science and electrical engineering, continues to reduce internal resistance, enhancing battery efficiency. Sodium-ion batteries and lithium-sulfur batteries are emerging alternatives, offering potential cost savings and improved environmental sustainability. Galvanostatic charge-discharge methods and chemical engineering advancements contribute to longer cycle life and higher energy density. Power tools and consumer electronics industries rely heavily on these batteries for portability and performance, necessitating overcurrent protection, current sensors, and battery monitoring systems. Mechanical engineering innovations address thermal management and mechanical stress challenges.
- Self-discharge rate minimization is crucial for medical devices, which require high coulombic efficiency and predictive modeling to optimize battery performance. Big data and data visualization tools enable real-time battery analysis, while short circuit protection and voltage sensors ensure safety. Cyclic voltammetry (CV) techniques in battery research provide valuable insights into battery chemistry, contributing to the development of solid-state batteries and other advanced technologies. Overcharge and overdischarge protection systems are essential to prevent damage and extend battery life.
Dive into Technavio's robust research methodology, blending expert interviews, extensive data synthesis, and validated models for unparalleled Cylindrical Lithium-Ion Battery Market insights. See full methodology.
|
Market Scope |
|
|
Report Coverage |
Details |
|
Page number |
207 |
|
Base year |
2024 |
|
Historic period |
2019-2023 |
|
Forecast period |
2025-2029 |
|
Growth momentum & CAGR |
Accelerate at a CAGR of 6.8% |
|
Market growth 2025-2029 |
USD 12793.1 million |
|
Market structure |
Fragmented |
|
YoY growth 2024-2025(%) |
6.4 |
|
Key countries |
China, US, Japan, Germany, South Korea, Canada, India, France, Australia, UAE, and Brazil |
|
Competitive landscape |
Leading Companies, Market Positioning of Companies, Competitive Strategies, and Industry Risks |
What are the Key Data Covered in this Cylindrical Lithium-Ion Battery Market Research and Growth Report?
- CAGR of the Cylindrical Lithium-Ion Battery industry during the forecast period
- Detailed information on factors that will drive the growth and forecasting between 2025 and 2029
- Precise estimation of the size of the market and its contribution of the industry in focus to the parent market
- Accurate predictions about upcoming growth and trends and changes in consumer behaviour
- Growth of the market across APAC, North America, Europe, South America, and Middle East and Africa
- Thorough analysis of the market's competitive landscape and detailed information about companies
- Comprehensive analysis of factors that will challenge the cylindrical lithium-ion battery market growth of industry companies
We can help! Our analysts can customize this cylindrical lithium-ion battery market research report to meet your requirements.