
Data-as-a-service (daas) Market Size 2026-2030
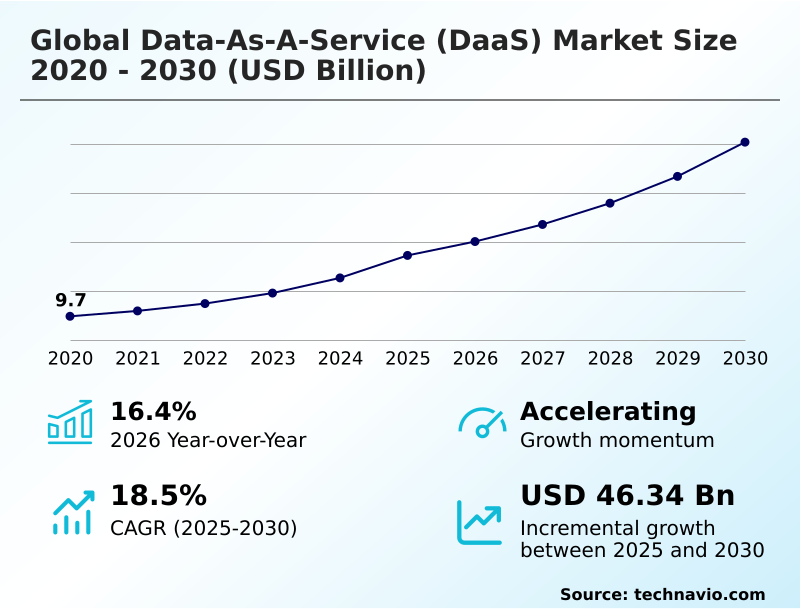
The data-as-a-service (daas) market size is valued to increase by USD 46.34 billion, at a CAGR of 18.5% from 2025 to 2030. Proliferation of big data and need for scalable data management will drive the data-as-a-service (daas) market.
Major Market Trends & Insights
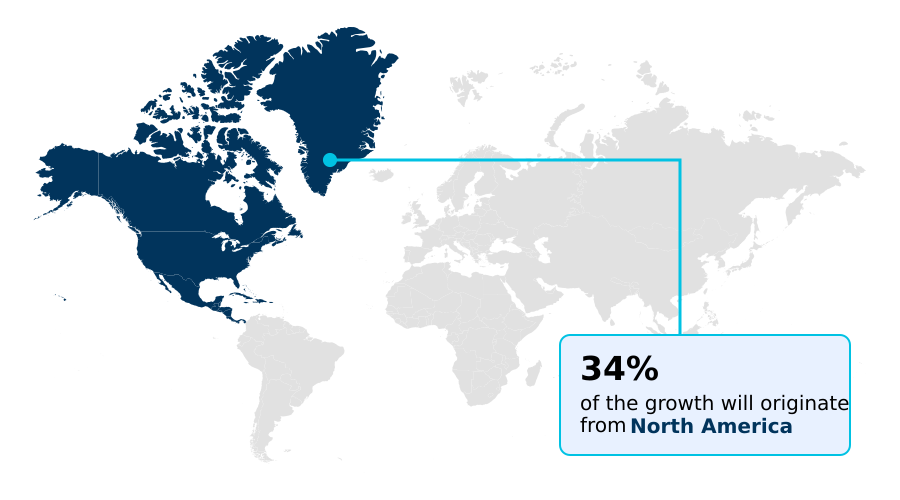
- North America dominated the market and accounted for a 34.2% growth during the forecast period.
- By End-user - BFSI segment was valued at USD 8.59 billion in 2024
- By Deployment - Cloud segment accounted for the largest market revenue share in 2024
Market Size & Forecast
- Market Opportunities: USD 71.24 billion
- Market Future Opportunities: USD 46.34 billion
- CAGR from 2025 to 2030 : 18.5%
Market Summary
- The data-as-a-service (daas) market is undergoing a profound transformation, moving beyond simple data provision to become a cornerstone of modern enterprise strategy. The core driver is the shift to a data-as-a-utility model, where organizations leverage cloud-based data delivery for on-demand data access to curated information.
- This paradigm is fueled by the growing need for real-time data streaming to power immediate business intelligence and self-service analytics. For instance, in supply chain management, companies utilize DaaS for DaaS for supply chain management to ingest live logistics data, enabling predictive routing and inventory optimization that was previously unattainable.
- Key trends include advanced data enrichment services and the rise of sophisticated data monetization platforms. However, success hinges on robust data governance frameworks and stringent data quality management. The ability to seamlessly utilize API-based data access for data integration while ensuring data compliance management is what separates leaders, allowing them to harness predictive data analytics for a decisive competitive edge.
- This evolution empowers even DaaS for SMEs, democratizing access to powerful insights.
What will be the Size of the Data-as-a-service (daas) Market during the forecast period?
Get Key Insights on Market Forecast (PDF) Get Free Sample
How is the Data-as-a-service (daas) Market Segmented?
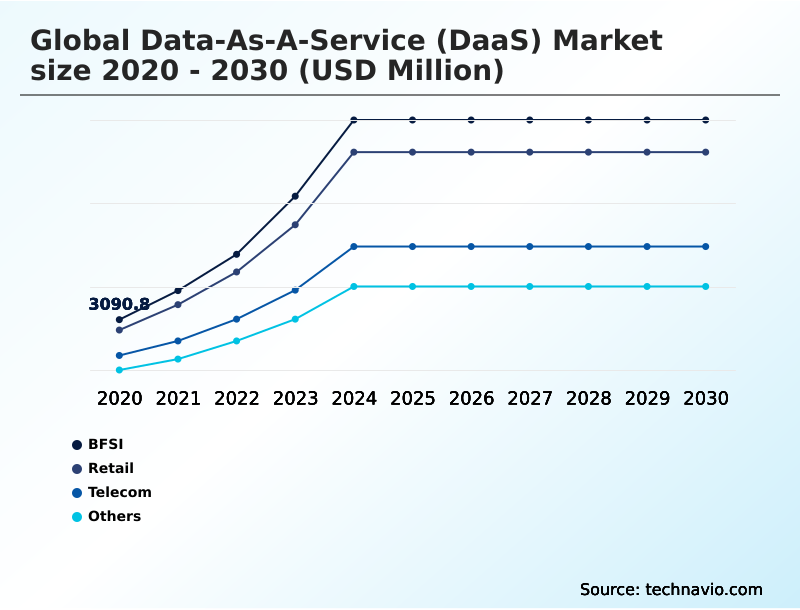
The data-as-a-service (daas) industry research report provides comprehensive data (region-wise segment analysis), with forecasts and estimates in "USD million" for the period 2026-2030, as well as historical data from 2020-2024 for the following segments.
- End-user
- BFSI
- Retail
- Telecom
- Others
- Deployment
- Cloud
- On-premises
- Sector
- Large enterprises
- SMEs
- Geography
- North America
- US
- Canada
- Mexico
- Europe
- UK
- Germany
- France
- APAC
- China
- Japan
- India
- South America
- Brazil
- Argentina
- Colombia
- Middle East and Africa
- Saudi Arabia
- UAE
- South Africa
- Rest of World (ROW)
- North America
By End-user Insights
The bfsi segment is estimated to witness significant growth during the forecast period.
The BFSI sector's adoption of data-as-a-service is driven by the need for robust risk management and regulatory adherence.
Financial institutions leverage external financial data feeds and consumer data analytics to augment internal datasets, improving the accuracy of predictive data analytics for credit scoring and fraud detection.
Effective data quality management and clear data lineage tracking are essential for compliance. While DaaS for financial services offers significant advantages, overcoming DaaS integration challenges with legacy systems remains a priority.
A well-defined enterprise DaaS strategy focused on secure data integration platforms and GDPR compliant DaaS protocols is critical, as effective programs have shown to improve anomaly detection rates by over 25%, bolstering data compliance management and overall DaaS security standards.
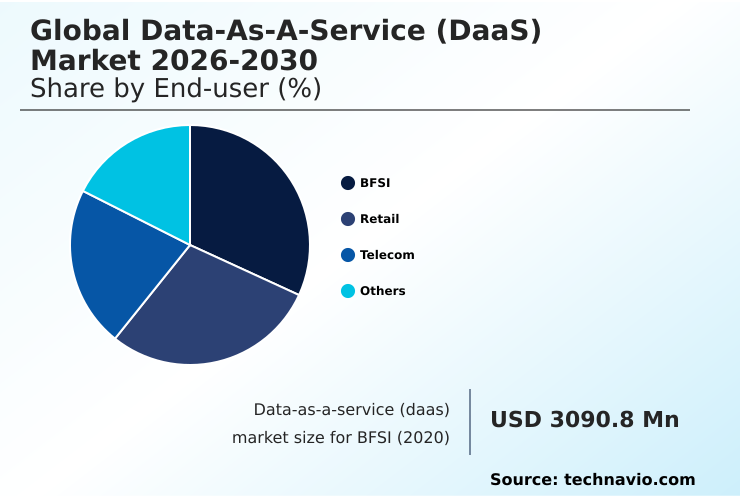
The BFSI segment was valued at USD 8.59 billion in 2024 and showed a gradual increase during the forecast period.
Regional Analysis
North America is estimated to contribute 34.2% to the growth of the global market during the forecast period.Technavio’s analysts have elaborately explained the regional trends and drivers that shape the market during the forecast period.
See How Data-as-a-service (daas) Market Demand is Rising in North America Get Free Sample
The geographic landscape is defined by varying levels of maturity and specialization. North America, contributing over 34% of market share, leads in sophistication, with a strong focus on data monetization platforms and advanced geospatial data services.
Europe emphasizes compliant data aggregation services and robust master data management to navigate its regulatory environment.
Meanwhile, the APAC region represents the fastest-growing market, with its contribution to incremental growth expected to reach nearly 30%, driven by demand for b2b data platforms and mobile-centric big data DaaS solutions.
Success in these diverse regions requires localized strategies, whether offering specialized firmographic data solutions in mature markets or simplified data cataloging software for emerging enterprises.
Providers focusing on data monetization with DaaS and geospatial DaaS providers are finding significant opportunities, particularly by enabling a customer 360 with DaaS view for global retail and finance clients.
Market Dynamics
Our researchers analyzed the data with 2025 as the base year, along with the key drivers, trends, and challenges. A holistic analysis of drivers will help companies refine their marketing strategies to gain a competitive advantage.
- Enterprises are increasingly focused on building a data-driven culture with daas, moving beyond theoretical benefits to specific, high-impact applications. For marketing teams, leveraging cloud daas solutions for personalized marketing is now standard practice, with many organizations also using daas to enrich crm data to achieve a complete customer view.
- In finance, the focus is on implementing real-time daas for fraud detection and selecting the right daas providers for financial market data. A key driver for adoption is reducing data infrastructure costs with daas, as the economic advantages are clear.
- Operationally, the benefits of using daas for supply chain visibility are significant, with some firms seeing inventory holding costs fall by over 15% compared to legacy approaches. Manufacturers are using daas for iot data in manufacturing to enable ai-powered daas for predictive maintenance. The rise of daas platforms for esg data analytics demonstrates the model's expansion into new strategic areas.
- The question for many is how daas improves business intelligence reporting, a query answered by the adoption of self-service analytics using daas and bi tools. While there are challenges of integrating daas with legacy systems, the availability of on-demand access to curated b2b data through a daas marketplace for third-party datasets provides a compelling reason to modernize.
- This strategic shift requires managing data compliance with daas platforms, especially for secure cross-border data transfer using daas. Success requires implementing data quality management best practices in daas and exploring innovations like synthetic data generation using daas for model training. Finally, selecting appropriate daas pricing models for enterprise use is crucial for scaling these initiatives effectively.
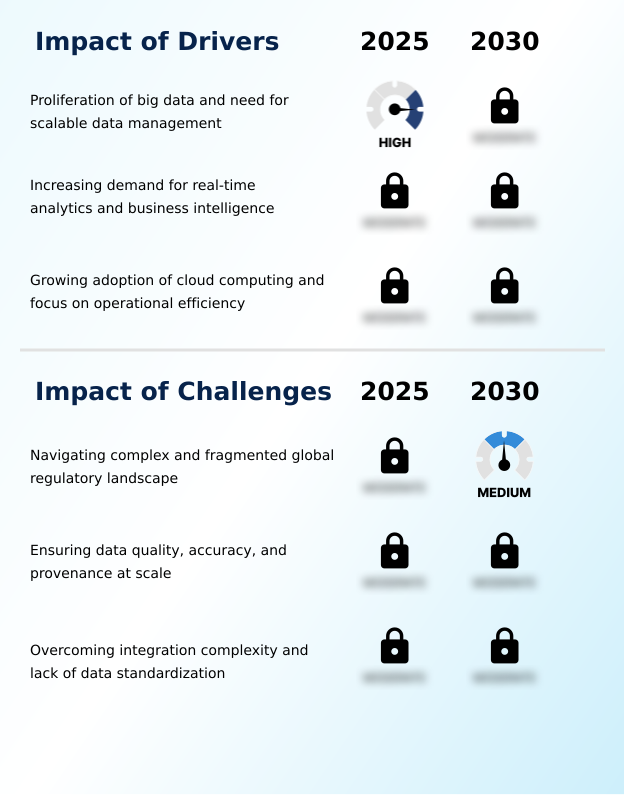
What are the key market drivers leading to the rise in the adoption of Data-as-a-service (daas) Industry?
- The proliferation of big data, coupled with the critical need for scalable data management solutions, serves as a primary driver for market growth.
- The fundamental shift toward cloud computing and operational efficiency is a primary market driver. The data-as-a-utility model allows organizations to leverage cloud-based data delivery for scalable, on-demand data access, converting large capital expenditures into predictable operational costs.
- Enterprises adopting this approach report reductions in data infrastructure spending by up to 60%. The cloud DaaS benefits extend to offloading complex tasks like ETL-as-a-service and cloud data warehousing management.
- This frees internal teams to focus on strategy rather than maintenance. Flexible DaaS pricing models and data virtualization layers further democratize access, enabling more agile data consumption.
- A core advantage is enhanced security, with providers managing sophisticated data security protocols, a key consideration when comparing DaaS with traditional on-premises DaaS architecture, reducing security overhead for clients by an estimated 25%.
What are the market trends shaping the Data-as-a-service (daas) Industry?
- The market is witnessing a fundamental shift toward dynamic service architectures. This evolution is defined by the escalating demand for real-time and hyper-personalized data streams.
- A key market trend is the integration of AI, transforming DaaS from a data conduit into an intelligence source. This AI/ML data-as-a-service evolution is powered by real-time data streaming and advanced predictive data analytics, with predictive DaaS offerings becoming standard. Leading providers are embedding algorithms for automated data enrichment services and anomaly detection.
- A significant innovation is synthetic data generation, which allows for robust model training without compromising privacy, a critical factor for healthcare DaaS benefits. Adoption of synthetic data in DaaS has grown by over 25% as it resolves privacy concerns. Data anonymization techniques are also becoming more sophisticated.
- This trend is crucial for sectors handling sensitive financial data feeds or large-scale IoT data integration, as intelligent DaaS platforms provide the curated, high-quality data necessary for next-generation applications and IoT data DaaS platforms.
What challenges does the Data-as-a-service (daas) Industry face during its growth?
- Navigating the complex and fragmented global regulatory landscape presents a significant challenge to industry growth.
- Ensuring data integrity and seamless integration remain significant market challenges. The imperative for high data quality in DaaS is paramount, as poor data can cost businesses up to 20% of revenue. Organizations grapple with DaaS integration challenges, especially when connecting to legacy systems, a process that can increase project timelines by over 50%.
- Effective data quality management requires robust data validation protocols and data cleansing automation. Furthermore, navigating regulatory requirements necessitates strong data governance frameworks and comprehensive metadata management solutions. Clients increasingly demand transparent data lineage tracking using dedicated DaaS data lineage tools to ensure compliance, a key feature for any GDPR compliant DaaS offering.
- These challenges are forcing a re-evaluation in the DaaS vs ETL comparison, pushing providers to offer more sophisticated, built-in data integration platforms to simplify adoption.
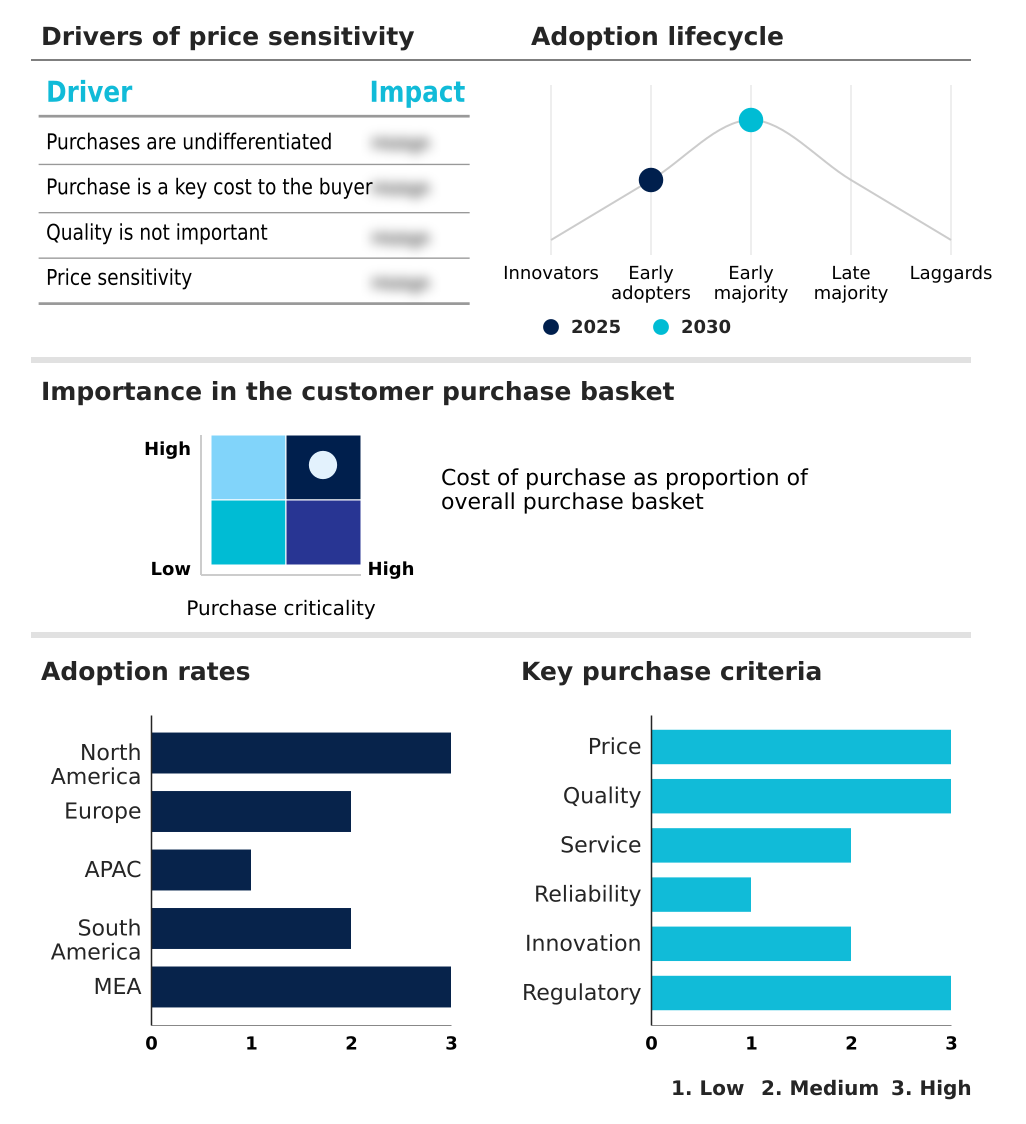
Exclusive Technavio Analysis on Customer Landscape
The data-as-a-service (daas) market forecasting report includes the adoption lifecycle of the market, covering from the innovator’s stage to the laggard’s stage. It focuses on adoption rates in different regions based on penetration. Furthermore, the data-as-a-service (daas) market report also includes key purchase criteria and drivers of price sensitivity to help companies evaluate and develop their market growth analysis strategies.
Customer Landscape of Data-as-a-service (daas) Industry
Competitive Landscape
Companies are implementing various strategies, such as strategic alliances, data-as-a-service (daas) market forecast, partnerships, mergers and acquisitions, geographical expansion, and product/service launches, to enhance their presence in the industry.
3 Step IT Group Oy - Key offerings include scalable cloud data platforms providing enterprise-grade analytics, business intelligence, and integrated data-as-a-service (DaaS) solutions for comprehensive data management.
The industry research and growth report includes detailed analyses of the competitive landscape of the market and information about key companies, including:
- 3 Step IT Group Oy
- Accenture Plc
- Amazon Web Services Inc.
- Bloomberg LP
- Bright Data Ltd.
- Computacenter plc
- Dell Technologies Inc.
- Dow Jones and Co. Inc.
- Dun and Bradstreet Holdings Inc
- Foxway AB
- IBM Corp.
- Lenovo Group Ltd.
- Microsoft Corp.
- Oracle Corp.
- RELX Plc
- S and P Global Inc.
- Salesforce Inc.
- SAP SE
- Snowflake Inc.
- Thomson Reuters Corp.
Qualitative and quantitative analysis of companies has been conducted to help clients understand the wider business environment as well as the strengths and weaknesses of key industry players. Data is qualitatively analyzed to categorize companies as pure play, category-focused, industry-focused, and diversified; it is quantitatively analyzed to categorize companies as dominant, leading, strong, tentative, and weak.
Recent Development and News in Data-as-a-service (daas) market
- In September 2024, Oracle Corp. announced the general availability of its Globally Distributed Autonomous Database, designed to help organizations automatically distribute and store data across various physical locations to address data sovereignty and scalability.
- In February 2025, Amazon Web Services Inc. launched its integrated AWS SageMaker Data Canopy, a service embedded within the SageMaker ecosystem to allow direct streaming of third-party DaaS feeds into model training environments.
- In April 2025, a consortium including General Motors, Ford, and Waymo formed the Automotive Data Trust, a secure DaaS platform for sharing anonymized vehicle telemetry data to accelerate autonomous driving development.
- In May 2025, European public stakeholders formally launched the European Health Data Space (EHDS) initiative, creating a pan-European DaaS ecosystem for secure, cross-border access to anonymized health data for research and innovation.
Dive into Technavio’s robust research methodology, blending expert interviews, extensive data synthesis, and validated models for unparalleled Data-as-a-service (daas) Market insights. See full methodology.
| Market Scope | |
|---|---|
| Page number | 304 |
| Base year | 2025 |
| Historic period | 2020-2024 |
| Forecast period | 2026-2030 |
| Growth momentum & CAGR | Accelerate at a CAGR of 18.5% |
| Market growth 2026-2030 | USD 46340.2 million |
| Market structure | Fragmented |
| YoY growth 2025-2026(%) | 16.4% |
| Key countries | US, Canada, Mexico, UK, Germany, France, The Netherlands, Sweden, Spain, China, Japan, India, Australia, South Korea, Indonesia, Brazil, Argentina, Colombia, Saudi Arabia, UAE, South Africa, Egypt and Turkey |
| Competitive landscape | Leading Companies, Market Positioning of Companies, Competitive Strategies, and Industry Risks |
Research Analyst Overview
- The data-as-a-service market is now a strategic boardroom focus, shifting to a data-as-a-utility model that prioritizes agility. This model is built on cloud-based data delivery for on-demand data access and real-time data streaming. Central to its success is stringent data quality management, enforced through data validation protocols and data cleansing automation.
- Providers offer comprehensive data curation services and data enrichment services, with outputs managed via cloud data warehousing and ETL-as-a-service capabilities. For end-users, API-based data access and self-service analytics tools are critical, simplified by data virtualization layers. Effective governance requires strong data governance frameworks, data lineage tracking, and metadata management solutions integrated with data cataloging software and data observability platforms.
- DaaS also enables master data management and specialized insights from geospatial data services, firmographic data solutions for b2b data platforms, consumer data analytics, iot data integration, and financial data feeds. As the market matures, data marketplace platforms enable data monetization platforms. Security and compliance are ensured by data security protocols, data anonymization techniques, and robust data compliance management.
- Integrating AI for predictive data analytics and synthetic data generation has reduced processing times by up to 30%, making data integration platforms and data aggregation services more powerful than ever.
What are the Key Data Covered in this Data-as-a-service (daas) Market Research and Growth Report?
-
What is the expected growth of the Data-as-a-service (daas) Market between 2026 and 2030?
-
USD 46.34 billion, at a CAGR of 18.5%
-
-
What segmentation does the market report cover?
-
The report is segmented by End-user (BFSI, Retail, Telecom, and Others), Deployment (Cloud, and On-premises), Sector (Large enterprises, and SMEs) and Geography (North America, Europe, APAC, South America, Middle East and Africa)
-
-
Which regions are analyzed in the report?
-
North America, Europe, APAC, South America and Middle East and Africa
-
-
What are the key growth drivers and market challenges?
-
Proliferation of big data and need for scalable data management, Navigating complex and fragmented global regulatory landscape
-
-
Who are the major players in the Data-as-a-service (daas) Market?
-
3 Step IT Group Oy, Accenture Plc, Amazon Web Services Inc., Bloomberg LP, Bright Data Ltd., Computacenter plc, Dell Technologies Inc., Dow Jones and Co. Inc., Dun and Bradstreet Holdings Inc, Foxway AB, IBM Corp., Lenovo Group Ltd., Microsoft Corp., Oracle Corp., RELX Plc, S and P Global Inc., Salesforce Inc., SAP SE, Snowflake Inc. and Thomson Reuters Corp.
-
Market Research Insights
- The market's dynamics are increasingly shaped by an enterprise-wide push for data-driven agility. A core part of enterprise DaaS strategy involves implementing DaaS governance best practices to manage complex information flows. Organizations leveraging a self-service DaaS platform report up to a 30% reduction in time-to-insight, empowering business users directly.
- While DaaS integration challenges persist, the clear ROI, with some firms seeing a 20% improvement in operational efficiency, accelerates adoption. This shift benefits not just large corporations but also DaaS for SMEs, which can now access enterprise-grade analytics without significant upfront investment.
- Examining a DaaS provider comparison now focuses heavily on API flexibility and support for real-time analytics DaaS, which are becoming standard expectations.
We can help! Our analysts can customize this data-as-a-service (daas) market research report to meet your requirements.
 RIA -
RIA - 
