
India Data Center Cooling Market Size 2026-2030
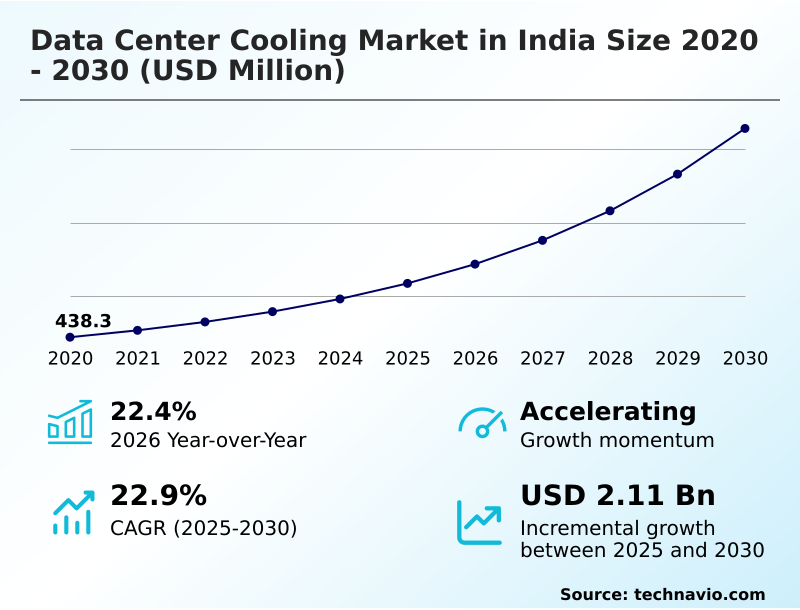
The india data center cooling market size is valued to increase by USD 2.11 billion, at a CAGR of 22.9% from 2025 to 2030. Exponential growth of high-density computing will drive the india data center cooling market.
Major Market Trends & Insights
- By Technology - Liquid-based cooling segment was valued at USD 601.8 million in 2024
- By Product - Air conditioning segment accounted for the largest market revenue share in 2024
Market Size & Forecast
- Market Opportunities: USD 2.85 billion
- Market Future Opportunities: USD 2.11 billion
- CAGR from 2025 to 2030 : 22.9%
Market Summary
- The data center cooling market in India is undergoing a profound transformation, positioning the nation as a key digital infrastructure hub. This evolution is driven by the rapid expansion of hyperscale facilities and a critical shift toward sustainable operations.
- As rack power densities increase dramatically, the efficacy of conventional air-based cooling systems is challenged, accelerating the adoption of advanced thermal management solutions. Stakeholders are increasingly prioritizing liquid-based cooling technologies, including direct-to-chip and immersion cooling, to address the intense heat dissipation requirements of high-performance computing.
- For example, a financial services firm deploying an AI-driven analytics platform must use such advanced cooling to prevent hardware throttling and ensure the operational stability of its mission-critical assets.
- The tropical climate further necessitates innovations in humidity control and adiabatic cooling to maintain efficiency while minimizing water and energy consumption, a necessity dictated by rising operational costs and stringent sustainability mandates. This integrated approach, where cooling architecture is planned in tandem with power and server density, ensures the digital backbone of the country remains resilient, scalable, and environmentally responsible.
- The technical complexity and a shortage of skilled manpower to manage these sophisticated systems remain significant considerations for operators navigating this dynamic environment.
What will be the Size of the India Data Center Cooling Market during the forecast period?
Get Key Insights on Market Forecast (PDF) Request Free Sample
How is the India Data Center Cooling Market Segmented?
The india data center cooling industry research report provides comprehensive data (region-wise segment analysis), with forecasts and estimates in "USD million" for the period 2026-2030, as well as historical data from 2020-2024 for the following segments.
- Technology
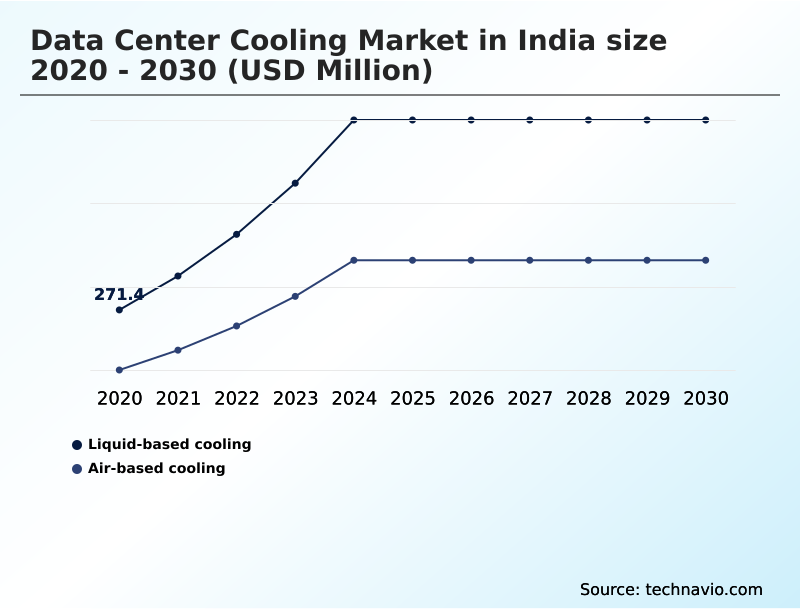
- Liquid-based cooling
- Air-based cooling
- Product
- Air conditioning
- Economizers
- Cooling towers
- Chillers
- Others
- Type
- Room cooling
- Rack and row cooling
- Geography
- APAC
- India
- APAC
By Technology Insights
The liquid-based cooling segment is estimated to witness significant growth during the forecast period.
Liquid-based cooling is rapidly becoming the essential technology for modern data centers, driven by the demands of high-density computing. As facilities transition to high-density server racks, traditional cooling methods falter, creating an urgent need for advanced liquid cooling methodologies.
This segment, which includes direct-to-chip cooling and total immersion cooling, excels at efficient heat dissipation directly at the source.
Utilizing components like cold plates, these systems manage intense thermal loads, which is critical for optimizing white space utilization in costly urban facilities. This approach not only supports unprecedented compute densities but also significantly improves power usage effectiveness (PUE).
Facilities adopting these hybrid cooling systems have reported up to a 40% reduction in cooling-related energy consumption, validating its role in creating sustainable cooling solutions and effective cooling capacity planning.
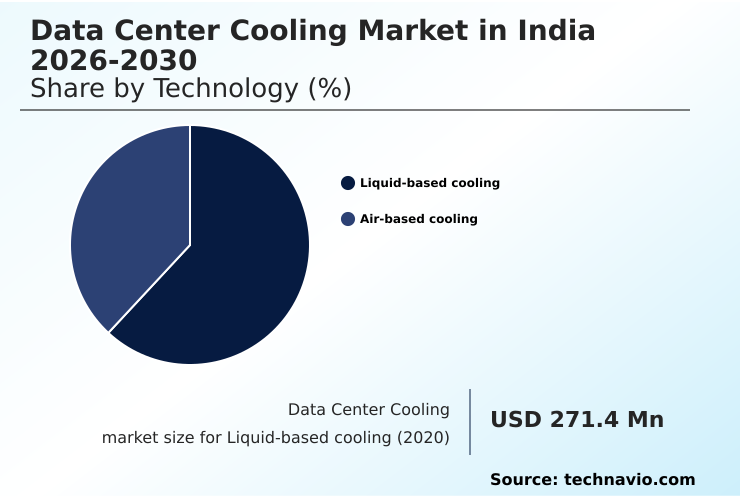
The Liquid-based cooling segment was valued at USD 601.8 million in 2024 and showed a gradual increase during the forecast period.
Market Dynamics
Our researchers analyzed the data with 2025 as the base year, along with the key drivers, trends, and challenges. A holistic analysis of drivers will help companies refine their marketing strategies to gain a competitive advantage.
- The strategic direction of the market is increasingly shaped by specialized use cases, with a significant focus on liquid cooling for AI workloads. A direct comparison of air vs liquid cooling efficiency consistently demonstrates the superiority of liquid-based systems in managing thermal loads in data centers, particularly for immersion cooling for high-performance computing.
- This is leading to a re-evaluation of data center cooling energy consumption, as operators seek PUE improvement with liquid cooling. The adoption of sustainable data center cooling methods is now a competitive differentiator, not just a matter of compliance. For instance, facilities implementing direct-to-chip cooling benefits from lower opex, with some showing a 20% faster ROI compared to air-cooled counterparts.
- The challenges of high-density cooling are being met with innovative cooling strategies for hyperscale data centers, including assessments of rear-door heat exchanger performance. Cooling solutions for edge computing require modular data center cooling design to function in diverse environments. In regions with specific climatic challenges, adiabatic cooling in tropical climates offers a balance between efficiency and water usage.
- This has intensified the focus on reducing water usage in data centers and optimizing data center airflow patterns. Furthermore, the integration of AI in data center thermal management automates complex processes like data center humidity control strategies, mitigating risks associated with the high cost of direct-to-chip cooling implementation and maximizing energy savings from free cooling.
What are the key market drivers leading to the rise in the adoption of India Data Center Cooling Industry?
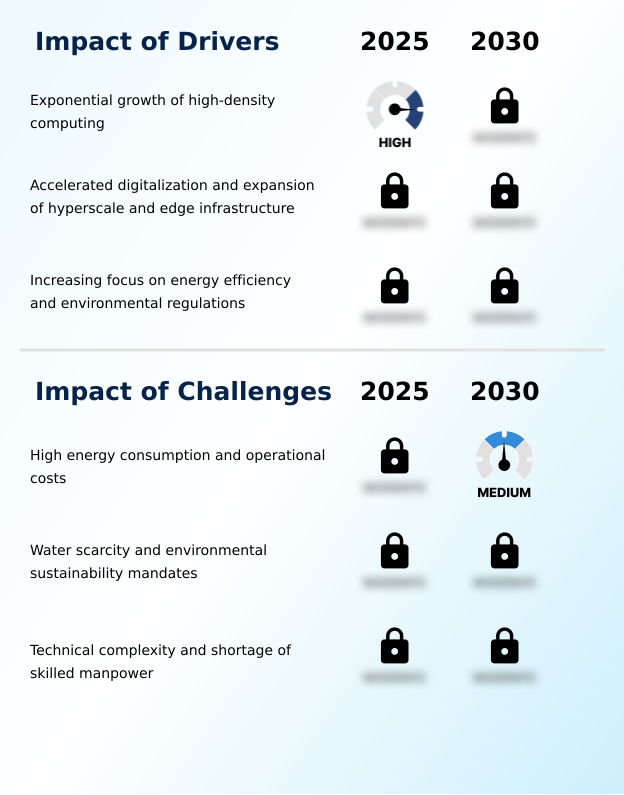
- The exponential growth of high-density computing serves as the foremost driver propelling demand for advanced thermal management solutions in the market.
- The foremost driver is the exponential growth in high-density computing, which renders traditional cooling methods inadequate. The deployment of high-density server racks for AI and analytics workloads demands advanced thermal management solutions capable of superior heat dissipation.
- This has created critical demand for liquid-based cooling, rear-door heat exchangers, and other modular cooling solutions. The rapid expansion of hyperscale cooling infrastructure and edge data center cooling further fuels this need.
- Operators are adopting green data center practices, optimizing chilled water flow rates to reduce energy use by over 30%.
- This shift is not optional; failure to upgrade cooling results in performance throttling that can reduce compute output by as much as 25% under peak thermal load.
What are the market trends shaping the India Data Center Cooling Industry?
- The widespread adoption of direct-to-chip and immersion liquid cooling architectures represents a primary trend. This shift is reshaping thermal management strategies across the industry.
- A primary trend reshaping the market is the accelerated shift toward advanced liquid cooling, specifically direct-to-chip cooling and immersion cooling. As high-density computing becomes standard, the limitations of air are driving adoption of these highly efficient methods. The use of in-row cooling units offers a modular approach, while two-phase immersion cooling with dielectric fluid provides unparalleled thermal stability.
- This transition is reinforced by AI-driven cooling optimization and predictive cooling management, which use thermal anomaly detection to prevent hotspots, improving uptime by over 15%. This focus on sustainable cooling solutions is also leading to water-neutral cooling designs that reduce water consumption by up to 80% compared to traditional evaporative systems, significantly improving power usage effectiveness (PUE).
What challenges does the India Data Center Cooling Industry face during its growth?
- High energy consumption and associated operational costs present a key challenge, impacting the profitability and sustainable growth of the industry.
- A primary challenge is managing the substantial energy consumption required to handle increasing thermal load, especially in India's tropical climate. The reliance on legacy air-based cooling systems, including chillers and cooling towers, results in high operational costs, with cooling accounting for up to 40% of a facility's total power usage.
- Transitioning to energy-efficient cooling hardware like variable frequency drive (VFD) pumps presents a significant capital barrier for many operators. Poor data center airflow management can lead to hotspots, jeopardizing IT equipment thermal safety. Inefficient cooling capacity planning also leads to wasted energy, with some facilities overprovisioning cooling by as much as 50%, hindering effective white space utilization and financial sustainability.
Exclusive Technavio Analysis on Customer Landscape
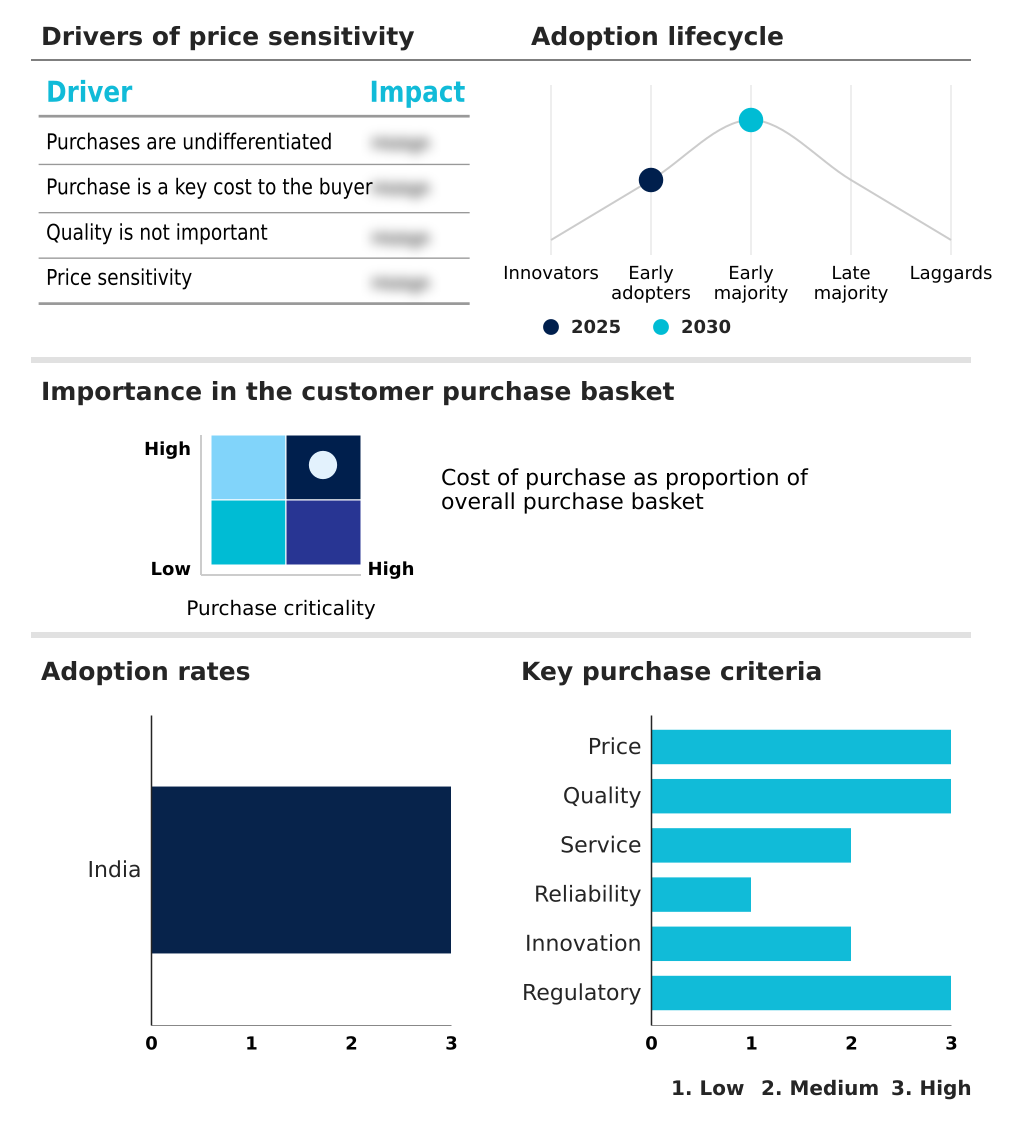
The india data center cooling market forecasting report includes the adoption lifecycle of the market, covering from the innovator’s stage to the laggard’s stage. It focuses on adoption rates in different regions based on penetration. Furthermore, the india data center cooling market report also includes key purchase criteria and drivers of price sensitivity to help companies evaluate and develop their market growth analysis strategies.
Customer Landscape of India Data Center Cooling Industry
Competitive Landscape
Companies are implementing various strategies, such as strategic alliances, india data center cooling market forecast, partnerships, mergers and acquisitions, geographical expansion, and product/service launches, to enhance their presence in the industry.
Alfa Laval AB - Specialized thermal management, including liquid cooling and heat exchanger technologies, optimizes heat dissipation for high-density data centers, enhancing operational performance and reliability.
The industry research and growth report includes detailed analyses of the competitive landscape of the market and information about key companies, including:
- Alfa Laval AB
- Blue Star Ltd.
- Carrier Global Corp.
- Daikin Industries Ltd.
- Danfoss AS
- Delta Electronics Inc.
- Eaton Corp. Plc
- Grundfos Holding AS
- Johnson Controls International
- Legrand SA
- Mitsubishi Electric Corp.
- Munters Group AB
- nVent Electric Plc
- Rittal GmbH and Co. KG
- Schneider Electric SE
- STULZ GmbH
- Submer Technologies SL
- Thermax Ltd.
- Trane Technologies plc
- Vertiv Holdings Co.
Qualitative and quantitative analysis of companies has been conducted to help clients understand the wider business environment as well as the strengths and weaknesses of key industry players. Data is qualitatively analyzed to categorize companies as pure play, category-focused, industry-focused, and diversified; it is quantitatively analyzed to categorize companies as dominant, leading, strong, tentative, and weak.
Recent Development and News in India data center cooling market
- In November 2024, Schneider Electric SE announced the commissioning of a new manufacturing plant in Bengaluru, focused on producing advanced liquid cooling solutions to address the growing demand from AI and high-performance computing clusters in the region.
- In January 2025, Submer Technologies SL entered into a strategic alliance with Anant Raj Cloud to co-develop sustainable, AI-ready data centers, introducing modular liquid-cooling systems designed to minimize energy consumption and physical footprint.
- In April 2025, the Government of India launched the National Data Center Mission, a large-scale initiative aimed at promoting the development of 100 green-certified data centers, directly stimulating demand for energy-efficient and sustainable cooling technologies.
- In May 2025, Blue Star Ltd. revealed it had reached the final stages of developing proprietary cooling distribution units and high-efficiency chillers, with prototypes undergoing testing to meet the thermal requirements of next-generation local data centers.
Dive into Technavio’s robust research methodology, blending expert interviews, extensive data synthesis, and validated models for unparalleled India Data Center Cooling Market insights. See full methodology.
| Market Scope | |
|---|---|
| Page number | 193 |
| Base year | 2025 |
| Historic period | 2020-2024 |
| Forecast period | 2026-2030 |
| Growth momentum & CAGR | Accelerate at a CAGR of 22.9% |
| Market growth 2026-2030 | USD 2112.9 million |
| Market structure | Fragmented |
| YoY growth 2025-2026(%) | 22.4% |
| Key countries | India |
| Competitive landscape | Leading Companies, Market Positioning of Companies, Competitive Strategies, and Industry Risks |
Research Analyst Overview
- The market is defined by a critical pivot from traditional room cooling and air-based cooling toward advanced thermal management solutions. The proliferation of high-density computing creates thermal load challenges that legacy computer room air conditioner (CRAC) and computer room air handler (CRAH) units cannot efficiently address.
- Consequently, liquid-based cooling, including direct-to-chip cooling and two-phase immersion cooling using dielectric fluid, is gaining significant traction. These systems, featuring components like cold plates and advanced heat exchangers, offer superior heat dissipation and heat rejection.
- Boardroom decisions now heavily factor in power usage effectiveness (PUE), driving investment in in-row cooling units and rack cooling designs that utilize sophisticated airflow management and containment strategies like hot aisle containment and cold aisle containment. This strategic shift has enabled some operators to increase rack density by over 50% without compromising thermal safety.
- The ecosystem also includes chillers, cooling towers, and economizers, often integrated into systems with variable frequency drive (VFD) technology and chilled water flow rates optimized for sensible cooling and latent cooling. Technologies such as rear-door heat exchangers, precision air conditioning, and closed-loop liquid cooling are becoming standard for new builds, with many leveraging free cooling modes for opex reduction.
What are the Key Data Covered in this India Data Center Cooling Market Research and Growth Report?
-
What is the expected growth of the India Data Center Cooling Market between 2026 and 2030?
-
USD 2.11 billion, at a CAGR of 22.9%
-
-
What segmentation does the market report cover?
-
The report is segmented by Technology (Liquid-based cooling, and Air-based cooling), Product (Air conditioning, Economizers, Cooling towers, Chillers, and Others), Type (Room cooling, and Rack and row cooling) and Geography (APAC)
-
-
Which regions are analyzed in the report?
-
APAC
-
-
What are the key growth drivers and market challenges?
-
Exponential growth of high-density computing, High energy consumption and operational costs
-
-
Who are the major players in the India Data Center Cooling Market?
-
Alfa Laval AB, Blue Star Ltd., Carrier Global Corp., Daikin Industries Ltd., Danfoss AS, Delta Electronics Inc., Eaton Corp. Plc, Grundfos Holding AS, Johnson Controls International, Legrand SA, Mitsubishi Electric Corp., Munters Group AB, nVent Electric Plc, Rittal GmbH and Co. KG, Schneider Electric SE, STULZ GmbH, Submer Technologies SL, Thermax Ltd., Trane Technologies plc and Vertiv Holdings Co.
-
Market Research Insights
- The market is characterized by a strategic shift towards advanced data center thermal orchestration and sustainable cooling solutions. The adoption of liquid cooling methodologies and dynamic thermal management is accelerating, with AI-driven cooling optimization leading to enhanced predictive cooling management and thermal anomaly detection. This transition supports the expansion of hyperscale cooling infrastructure and addresses edge data center cooling needs.
- Operators are implementing green data center practices, prioritizing water-neutral cooling and energy-efficient cooling hardware, with some achieving a 15% improvement in PUE. The focus on modular cooling solutions and rack-level thermal solutions enhances white space utilization.
- These containment strategies and hybrid cooling systems are critical for maintaining IT equipment thermal safety, with comprehensive cooling capacity planning now reducing overprovisioning by up to 25%.
We can help! Our analysts can customize this india data center cooling market research report to meet your requirements.
 RIA -
RIA - 
